


First degree relatives of patients with allergic diseases are at increased risk of having the disorder. However, it is not clear whether two such related patients with allergic diseases are sensitive to the same antigens or not.
ObjectiveThe aim of this study to determine whether or not first degree relatives with respiratory allergies are more likely to be skin test positive to the same allergen extracts as unrelated patients.
Patients and MethodsSkin test results for 35 common aeroallergens were compared in 264 pairs of genetically related subjects and 264 pairs of age and sex matched, but unrelated, subjects. We calculate the percentages of the concordant and discordant results in each group. Results are compared by using χ2 test.
ResultsFor all related and unrelated groups combined, there were significant differences with mites (der. pteronyssinus, der. farinae) and some moulds (aspergillus mix and rhizopus nigricans) (p < 0.05); When the groups were subdivided into parent-child pairs and same or different sibling pairs, and the same comparisons were made, a significant difference was only found in both sibling pairs (p < 0.05), not in parent-child pairs (p > 0.05). Since there was no both positivity with aspergillus mix and rhizopus nigricans in the two groups, these two allergens were excluded from the study.
ConclusionIt is concluded that we could not say that if one or both of parents are atopic to any allergens, their child will be atopic to the same allergens. Besides, when a respiratory allergy occurs in siblings, only the one who has house dust mite allergy sensitivity can possess the similar antigen sensitivity.
Because of the gradual increase in the prevalence, morbidity and mortality of allergic respiratory diseases in recent years, there is a detailed need for understanding their pathogenesis and physiopathology. However, there is a running doubt on how to develop allergies. While some researchers emphasize the importance of the genetic factor in the development of this picture, others seem to consider that the environmental factor is the most effective.
In addition, the question that persons of atopic constitution who have first degree relativity (parent-child or sibling) are sensitive or not to those antigens as well, appears to have been raised recently.
Skin tests, (especially epidermal testing), remain the most useful method of establishing specific causative allergens. Therefore, to determine the answer to the above question, the antigen similarities in atopic pairs who are first degree relatives were examined through skin prick test (SPT).
MATERIALS AND METHODSTwo hundred and sixty-four pairs (528 patients), were constituted retrospectively and prospectively in the Department of Allergic Diseases in GATA in Ankara, Turkey. Diagnoses were set through history, physical findings and SPT. The only inclusion criterion was a positive atopic family history. This was confirmed by sensitization to an environmental allergen (SPT) in at least one parent or sibling of the patient. Only those patients who have respiratory system allergies were studied. Pairs were matched as parent-child (mother-child/father-child) or sibling (same sex/different sex).
As a control group, again, among the patients, 264 pairs that have no relation between each other and whose ages and sexes were concordant to the patients, are selected randomly and evaluated.
The sensitivities to 35 common aeroallergens were assessed by SPT using lancets (1/20 wt/vol for pollens and moulds, 10,000AU/ml for mites) (Greer Lab., LaNoir, NC, USA) (Table I). Positive (10mg/ml histamine base) and negative (phosphate saline solution) controls were simultaneously applied. Patients avoided antihistamines and antidepressants for at least 72 hours before testing. For each test, the greatest diameter of the erythema and wheal in millimetres were recorded at 15 minutes. Reactions with a wheal diameter greater than or equal to 3mm were considered positive.1 No adverse effect was observed.
Number and percentage of antigen
| No | Antigen | % |
| a1 | Cockroach American | 8 |
| a2 | Mold mix | 2.3 |
| a3 | Trichophyton rubrum | 1.1 |
| a4 | Salix | 1.5 |
| a5 | Artemisia vulgaris | 17.4 |
| a6 | Der. pteronyssinus | 35.2 |
| a7 | Avena sativa | 68.9 |
| a8 | Eastern oak mix | 5.7 |
| a9 | Festuca Elatior | 70.8 |
| a10 | Pine mix | 1.5 |
| a11 | Maple mix | 3 |
| a12 | Aspergillus mix | 3.4 |
| a13 | Rose | 3.8 |
| a14 | Rhizopus nigricans | 0.8 |
| a15 | Phleum pratense | 72 |
| a16 | Cat epithelia | 9.5 |
| a17 | Populus | 8 |
| a18 | Dog epithelia | 1.1 |
| a19 | Sunflower | 4.2 |
| a20 | Hormodendrum | 2.7 |
| a21 | Dactylis glomerata | 72.3 |
| a22 | Der. farinae | 33.7 |
| a23 | Eastern tree mix | 8 |
| a24 | Poa pratensis | 70.8 |
| a25 | Fusarium mix | 1.5 |
| a26 | Daisy chrysanthemum | 2.3 |
| a27 | Chenopodium mix | 8 |
| a28 | Salsola | 4.2 |
| a29 | Monilia mix | 2.7 |
| a30 | Horse epithelia | 2.3 |
| a31 | Lolium perenne | 71.2 |
| a32 | Olea Europea | 15.2 |
| a33 | Ash mix | 7.6 |
| a34 | Juglans | 1.9 |
| a35 | Birch mix | 1.5 |
Data were entered into the computer through the SPSS for Windows 11.5 statistical software application, and computed. The percentage of concordant results (+/ or –/–) and discordant results (+/–) among pairs for each group were calculated for all allergens. The results were compared with χ2 analysis.
RESULTSTwo hundred and sixty-four pairs of first degree relatives (167 parent-child pairs [113 mother-child, 54 father-child] and 97 sibling pairs [45 different sex, 52 same sex]) and 264 pairs of age-matched and sex-matched but unrelated subjects, all with respiratory allergies, were studied. Characteristics of the patients are shown in Table II. SPT positivity in mother-child pairs was found to be double that in father-child pairs (113 versus 54). Mean antigen numbers in the two groups were found to be nearly equal, as shown in Table III (p > 0.05). The number and percentage for positive skin tests in the study group are shown in Table I. Grasses (festuca elatior, phleum pratense, dactylis glomerata, poa pratensis, lolium perenne), cereals (avena sativa) and mites (der. pteronyssinus, der. farinae) were higher than for the other allergens. This situation is similar to our previous study which was about the allergen spectrum of Turkey.2 The concordant and discordant skin test results and their analyses are shown in Table IV.
Demographic properties of the study group
| Ages | Median | Range | Sex (Male/Female) | ||
| Parent-child (167 pairs) | Mother (113) | 40.96 ± 8.18 | 41 | 26-69 | –/113 |
| Child | 15.04 ± 6.97 | 14 | 5-41 | 59/54 | |
| Father (54) | 43.39 ± 11.55 | 43 | 13-71 | 54/– | |
| Child | 15.61 ± 9.77 | 12.5 | 5-44 | 32/22 | |
| Sibling (97 pairs) | Same sex (52 pairs) | 18.4 ± 8.13 | 17 | 5-38 | 21 pairs/31 pairs |
| Different sex (45 pairs) | 18.4 ± 9.88 | 17 | 7-55 | 45/45 |
Concordant and discordant skin test results for all antigens
| a1 | a2 | a3 | a4 | a5 | a6 | a7 | a8 | a9 | a10 | a11 | a12 | a13 | a14 | a15 | a16 | a17 | a18 | a19 | a20 | a21 | a22 | a23 | a24 | a25 | a26 | a27 | a28 | a29 | a30 | a31 | a32 | a33 | a34 | a35 | ||
| PATIENT | Concordance% | 84.1 | 95.1 | 95.5 | 96.6 | 81.4 | 66.7 | 65.9 | 91.7 | 65.9 | 97.3 | 95.5 | 93.6 | 93.2 | 98.1 | 65.5 | 89.4 | 92 | 98.1 | 93.2 | 93.6 | 65.5 | 67 | 90.2 | 65.9 | 97 | 94.3 | 90.2 | 94.7 | 95.1 | 97.7 | 66.7 | 84.8 | 92.8 | 96.2 | 98.9 |
| Both positive* | 7 | 2 | 0 | 1 | 14 | 61 | 122 | 5 | 128 | 0 | 1 | 0 | 1 | 0 | 129 | 4 | 6 | 1 | 1 | 0 | 130 | 56 | 3 | 127 | 0 | 2 | 6 | 2 | 1 | 0 | 128 | 14 | 6 | 0 | 1 | |
| Both negative* | 215 | 249 | 252 | 254 | 201 | 115 | 52 | 237 | 46 | 257 | 251 | 247 | 245 | 259 | 44 | 232 | 237 | 258 | 245 | 247 | 43 | 121 | 235 | 47 | 256 | 247 | 232 | 248 | 250 | 258 | 48 | 210 | 239 | 254 | 260 | |
| Discordance% | 15.9 | 4.9 | 4.5 | 3.4 | 18.6 | 33.3 | 34.1 | 8.3 | 34.1 | 2.7 | 4.5 | 6.4 | 6.8 | 1.9 | 34.5 | 10.6 | 8 | 1.9 | 6.8 | 6.4 | 34.5 | 33 | 9.8 | 34.1 | 3 | 5.7 | 9.8 | 5.3 | 4.9 | 2.3 | 33.3 | 15.2 | 7.2 | 3.8 | 1.1 | |
| CONTROL | Concordance% | 82.6 | 96.2 | 96.6 | 98.9 | 77.3 | 51.1 | 61.4 | 93.9 | 61.7 | 95.8 | 97 | 98.1 | 91.3 | 100 | 61.7 | 87.9 | 91.7 | 97.7 | 92.4 | 97 | 61.7 | 54.9 | 93.9 | 60.6 | 98.9 | 91.7 | 91.7 | 96.6 | 92.8 | 98.1 | 61.4 | 78 | 93.2 | 98.9 | 98.9 |
| Both positive* | 1 | 0 | 0 | 0 | 4 | 26 | 146 | 1 | 146 | 0 | 0 | 0 | 0 | 0 | 149 | 0 | 0 | 0 | 0 | 0 | 149 | 22 | 0 | 146 | 0 | 0 | 0 | 0 | 0 | 0 | 147 | 4 | 2 | 0 | 0 | |
| Both negative* | 217 | 254 | 255 | 261 | 200 | 109 | 16 | 247 | 17 | 253 | 256 | 259 | 241 | 264 | 14 | 232 | 242 | 258 | 244 | 256 | 14 | 123 | 248 | 14 | 261 | 242 | 242 | 265 | 245 | 259 | 15 | 202 | 244 | 261 | 261 | |
| Discordance | 17.4 | 3.8 | 3.4 | 1.1 | 22.7 | 48.9 | 38.6 | 6.1 | 38.3 | 4.2 | 3 | 1.9 | 8.7 | 0 | 38.3 | 12.1 | 8.3 | 2.3 | 7.6 | 3 | 38.3 | 45.1 | 6.1 | 39.4 | 1.1 | 8.3 | 8.3 | 4.4 | 7.2 | 1.9 | 38.6 | 22 | 6.8 | 1.1 | 1.1 | |
| χ2 test | 0.218 | 0.409 | 0.446 | 3.07 | 1.39 | 13.15 | 1.179 | 1.02 | 0.993 | 0.92 | 0.831 | 6.83 | 0.661 | 5.048 | 0.818 | 0.301 | 0.025 | 0.093 | 0.113 | 3.40 | 0.818 | 8.151 | 2.587 | 1.597 | 2.321 | 1.424 | 0.367 | 1.136 | 1.198 | 0.093 | 1.611 | 4.06 | 0.029 | 3.86 | 0 | |
| p | > 0.05 | > 0.05 | > 0.05 | > 0.05 | > 0.05 | < 0.01 | > 0.05 | > 0.05 | > 0.05 | > 0.05 | > 0.05 | < 0.01 | > 0.05 | < 0.05 | > 0.05 | > 0.05 | > 0.05 | > 0.05 | > 0.05 | > 0.05 | > 0.05 | < 0.01 | > 0.05 | > 0.05 | > 0.05 | > 0.05 | > 0.05 | > 0.05 | > 0.05 | > 0.05 | > 0.05 | > 0.05 | > 0.05 | > 0.05 | > 0.05 |
When we looked at concordance and discordance results for all related and unrelated groups combined, there were significant differences with mites and some moulds (p < 0.05); Upon subdividing the groups into parent-child pairs and sibling pairs, and the same comparisons were made, a significant difference was only found in the both sibling pairs (p < 0.05).
When allergens were evaluated one by one, significant differences were found for der. pteronyssinus, der. farinae, aspergillus mix and rhizopus nigricans (p < 0.05) (Tables V, VI). When we look at the concordance of aspergillus mix and rhizopus nigricans, there is no both positivity in the two groups. We therefore excluded these two last allergens from the study.
Concordant and discordant skin test results for Der. Pteronyssinus
| Patient | Control | χ2 | p | ||
| Mother-Child (113 pairs) | Concordance | 71 (62.8%) | 60 (53.1%) | ||
| Both Positive | 26 (23.0) | 17 (15.0) | |||
| Both Negative | 45 (39.8) | 43 (38.1) | 2.197 | 0.138 | |
| Discordance | 42 (37.2%) | 53 (46.9%) | |||
| Father-Child (54 pairs) | Concordance | 32 (59.3%) | 26 (48.1%) | ||
| Both Positive | 17 (31.5) | 1 (1.9) | |||
| Both Negative | 15 (27.8) | 25 (46.3) | 1.341 | 0.247 | |
| Discordance | 22 (40.7%) | 28 (51.9%) | |||
| Same sex sibling (52 pairs) | Concordance | 39 (75%) | 27 (51.9%) | ||
| Both Positive | 12 (23.1) | 5 (9.6) | |||
| Both Negative | 27 (51.9) | 22 (42.3) | 5.971 | 0.015 | |
| Discordance | 13 (25%) | 25 (48.1%) | |||
| 25 (48.1%)Different sex sibling (45 pairs) | Concordance | 34 (75.6%) | 22 (48.9%) | ||
| Both Positive | 6 (13.3) | 3 (6.7) | |||
| Both Negative | 28 (62.2) | 19 (42.2) | 6.807 | 0.009 |
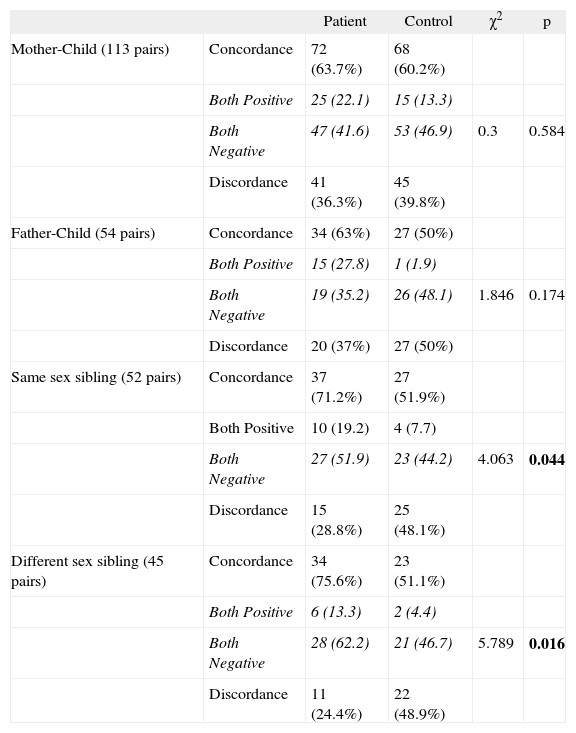
Concordant and discordant skin test results for Der. Farinae
| Patient | Control | χ2 | p | ||
| Mother-Child (113 pairs) | Concordance | 72 (63.7%) | 68 (60.2%) | ||
| Both Positive | 25 (22.1) | 15 (13.3) | |||
| Both Negative | 47 (41.6) | 53 (46.9) | 0.3 | 0.584 | |
| Discordance | 41 (36.3%) | 45 (39.8%) | |||
| Father-Child (54 pairs) | Concordance | 34 (63%) | 27 (50%) | ||
| Both Positive | 15 (27.8) | 1 (1.9) | |||
| Both Negative | 19 (35.2) | 26 (48.1) | 1.846 | 0.174 | |
| Discordance | 20 (37%) | 27 (50%) | |||
| Same sex sibling (52 pairs) | Concordance | 37 (71.2%) | 27 (51.9%) | ||
| Both Positive | 10 (19.2) | 4 (7.7) | |||
| Both Negative | 27 (51.9) | 23 (44.2) | 4.063 | 0.044 | |
| Discordance | 15 (28.8%) | 25 (48.1%) | |||
| Different sex sibling (45 pairs) | Concordance | 34 (75.6%) | 23 (51.1%) | ||
| Both Positive | 6 (13.3) | 2 (4.4) | |||
| Both Negative | 28 (62.2) | 21 (46.7) | 5.789 | 0.016 | |
| Discordance | 11 (24.4%) | 22 (48.9%) |
There is a family predisposition to respiratory allergies, the incidence of which is highest among first degree relatives. Among children with bilateral family histories of allergic rhinitis or asthma, one of these conditions will develop in 70 % of cases, and among those with unilateral family histories, in 50%.3,4 The association of atopic diathesis with the inheritance of histocompatibility (HLA) antigen haplotypes in families has been demonstrated and suggests that immune response genes associated with the major histocompatibility complexes may genetically determine or define the atopic state. Indeed, correlations have been established in population studies between specific IgE antibodies to Amb a V and HLA DR2 and Lol p I and II and HLA DR3.5,6 Establishment of the correlation among the pollens and HLA II types and showing the statistical grass pollen similarity between first degree relative pairs together, brings out the existence of a genetic passage with respect to grass pollen antigens. Furthermore, these correlations were also demonstrated between HLA Class II allele and mites with Lin's study (der. farinae and HLA-DR 13),7 and Lara-Marquez's study (HLA-DRB1*1101, DQA1*0501, DQB1*0301 and der. pteronyssinus and der. farinae),8 but not by Stephan9 and Holloway.10
Some researchers reported a multicentre study in Germany, to better understand the relationship between sensitization and atopic family history or levels of IgE antibody in umbilical cord blood as predictors of future allergy in neonates. They emphasized that family history, most reliably predicts the type of allergy the atopic child will express, that is, the child is most likely to express the same allergy or allergies as the parents.11
Although it is accepted that genetic passage plays an important role in allergic diseases according to the above studies, consensus exists with regard to allergenic similarity among the first degree relatives. When a child of a father or mother with a pollen or mite allergy, has an atopy, at the same time, should they be sensitive to the same antigens or not? This question has yet to be completely answered.
On the other hand, others notified that the environmental factors play an essential role in atopy development, while genetic factors have a limited effect. They indicated the growing importance of house dust mite in the development of allergy and stated that, widely used social settings such as central heating, double glazing, fitted carpets, and other factors optimize conditions for house dust mite proliferation, and also strongly implicated tobacco smoke in the rising prevalence of allergies.12 Contrarily, Murray et al. investigated the effect of in uterine and postnatal environmental tobacco smoke exposure on respiratory symptoms and atopy in the first 3years of life in children at high risk of allergic disease (both parents atopic), and they found environmental tobacco smoke exposure has little or no effect on the development of atopy.13 Huss showed that the higher the levels of house dust mite exposure, the more likely the patients were to have positive allergy skin test responses.14 On the contrary, Gereda reported that children exposed to a high amount of house dust endotoxins may be protected from developing allergic sensitization, as these substances are Th1 stimulant.15 Duse emphasized that atopy among 13- to 14-yr-old adolescents is significantly associated with some family and environmental factors, providing further support for the hygiene hypothesis (frequent infections and exposure to bacterial endotoxins in the early years of life are related to a low risk of developing atopic disease).16 Besides, Remes declared that a farm environment reduces the occurrence of asthma, allergic diseases, and atopic sensitization in children.17 Stelmach also stated that poor living conditions or living in orphanages lower the risk of atopy.18
After these conflicting results, the recent common consideration in atopy development is: that in addition to the genetic factors, specific environmental factors (such as magnitude of allergen exposure, early allergen exposure) and non-specific environmental factors (nutrition, active or passive smoker, maternal smoking, housing conditions, viral infections) play the important roles.
This is the third study (to our knowledge) about allergenic similarity between first degree relatives. First, Kelso reported in 32 genetically related pairs and 32 unrelated subjects that they are no more likely to be skin test positive to the same allergen than unrelated persons with allergic rhinitis, except to oak.19 Second, Silvestri declared that parents and children (85 families) showed a similar prevalence; and coincidence of sensitization to house dust mites was more frequent than pollens.20 Our study was confirmed among the first degree relatives since the SPT outcomes among children were independent of the SPT responses of their parents. When a child of a father or mother who has a pollen or mite allergy, has an atopy, at the same time, we can never say that that child should be sensitive to the same antigens.
Conversely to Kelsos' study, we found house dust mite and mould antigen similarities between the siblings (p < 0.05). Der. pteronyssinus and der. farinae, aspergillus mix and rhizopus nigricans showed statistical differences between the siblings (p < 0.05), but, aspergillus mix and rhizopus nigricans differences are only due to negativity of allergens. Therefore, we could not make any comment about allergenic similarities with these mould antigens.
Many related or unrelated allergens share common epitopes, resulting in cross-reactivities, or co-sensitization. Grass and cereal pollens, of which six were used (avena sativa, festuca elatior, phleum pratense, dactylis glomerata, poa pratensis, lolium perenne) in our study showed cross-reactivity, while cynodon dactylon has not submitted any relation between these grass pollens because of an antigenically distinct structure.21,22 The rate of these six grass pollen similarities was also found to be nearly equal in our study. In fact, it is recommended that only one species is usually sufficient for diagnosis of grass pollen allergy.22 Grass and cereal pollens are the leading aeroallergens in Turkey,2 and these sensitivities were found to be high, nearly 70 % of the patients in our study.
A large proportion of atopy develops in childhood, and early life exposures are suspected to play a considerable role in the inception. Lierl point out that, while the onset of nasal allergy appears to be highest before 5years of age, upper respiratory allergy develops in the primary-school age group.3 The SPACE study demonstrated that early intervention may modulate the natural course of atopic disease.23 As a result, development of sensitization in the early years of life is a general impression, although atopy rarely develops in elderly age.
Many studies, mentioned above, show controversial results, either the hygiene hypothesis or allergen exposure is responsible from development of sensitization. Living in the same place, especially in the early years of life, can result in allergic sensitization among the siblings. It can be said that if one sibling is atopic to mites, then they have to take the same precautions to the other siblings before development of allergenic sensitization and symptoms.
In conclusion, in contrast to Kelso's previously published evidence, it can be stated that, when a respiratory allergy occurs in siblings, only the ones who have house dust mite allergy sensitivity can possess the similar antigen sensitivity. At the same time, we could not affirm that if one or both of parents are atopic to any allergens, then their child will be atopic to the same allergens (when atopy develops).
As the study includes fewer numbers of pairs, more detailed and advanced studies will continue.
