


Background. T-cell populations regulate the balance of immune responses. The CD (Cluster of differentiation) 4+CD25+ regulatory T cells (Tregs) are crucial for maintaining negative control of various immune responses. There are different T-cell subpopulations with regulatory functions, as natural killer T cells, CD8+ and CD28. The forkhead box P3 (FOXP3) regulates Treg development and is required for its suppressive function.
Aim. To evaluate the hepatic expression of the intrahepatic Tregs, Ig (immunoglobulin) G and IgM plasma cells in autoimmune hepatitis (AIH) and other chronic liver diseases (CLDs).
Material and methods. This study included 100 pediatric patients; 50 AIH and 50 CLDs other than AIH. All patients were subjected to routine investigations of CLDs plus immune-staining of liver tissue for FOXp3, IgG and IgM plasma cells, CD4 and CD8 T-cells.
Results. The FOXP3+ T cells in patients with AIH (6.3 ± 5) were significantly higher than that in the non-AIH (2.1 ± 2.6). FOXP3+ T cells were abundant in liver tissue with marked inflammatory cellular infiltrate. CD4+ and CD8+ infiltrating the liver tissue and IgG positive cells were significantly higher in AIH group, while the expression of IgM positive cells showed no significant difference. The IgG/IgM was significantly higher in the AIH treatment responders (3 ± 3) than non-responders (1.6 ± 0.5), while there was no significant difference regarding the intrahepatic expression of FOXP3+, CD4+, CD8+ cells, T-cells, IgG and IgM plasma cells.
Conclusion. Intrahepatic Tregs were increased in number in patients with AIH in the initial presentation, and their presence is associated with increased activity and inflammation in liver biopsy.
T-cell populations regulate and control the balance of immune responses. The CD4 + CD25+ Tregs are crucial for maintaining immunologic self-tolerance and negative control of various immune responses. CD4+ Treg is defined by high levels of CD25, low levels of CD127, and expression of the transcription factor FOXP3, comprise 1–5 % of circulating T cells. FOXP3, which regulates Treg development, is required for suppressive function.1 Genetic alterations in the development and function of Tregs population can induce autoimmune disease, immune based pathology and allergy in humans.2 In addition, there are different T-cell subpopulations with regulatory functions, such as natural killer T cells, T helper 3, T regulatory 1, CD8+ and CD28-, these types of T cells may also prevent the activation of autoreactive T cells and be involved in the failure of homeostasis.3
Objectives: To evaluate the hepatic expression of the intrahepatic regulatory T cells, IgG and IgM plasma cells in autoimmune hepatitis (AIH), autoimmune sclerosing cholangitis (ASC) and in other chronic liver diseases and to find if there is a role for these cells in the pathogenesis and diagnosis of AIH.
Material and MethodsThis case control study conducted in National Liver Institute, Menofia University, Egypt, included 100 pediatric patients (53 girls and 47 boys). 50 patients were diagnosed as AIH satisfying the international criteria for diagnosis of AIH and the other 50 patients were diagnosed to have chronic liver disease of different etiology than AIH. Study group patients were selected retrospectively and prospectively from the outpatient clinic, Pediatric Hepatology Department, National Liver Institute, Menofia University. Data at the time of diagnosis in the initial presentation of all included cases were included to be investigated.
All children in this study were subjected to the following: Full history taking, thorough clinical examination, abdominal ultrasonography, Liver function tests, complete blood count, serum autoantibodies [Antinuclear antibody (ANA), anti-smooth muscle antibody (ASMA) and liver kidney microsomal antibody-1 (anti-LKM-1) were done by indirect immunofluorescence technique].4 Protein electrophoresis, HBV (hepatitis C virus)-DNA (deoxyribonucleic acid) for HBsAg (hepatitis B virus surface antigen) positive children, hepatitis C virus antibody (anti-HCV) in serum, HCV-RNA (Ribonucleic acid) by qualitative polymerase chain reaction (PCR) in serum were done for all patients.
Liver biopsies were obtained by ultrasound percutaneous puncture (True-cut needle, Baxter International, Deerfield, IL). Routinely stained sections were retrieved from pathology archives for reevaluation according to Ishak staging and grading scores.5 Five different 4-μm thick sections were prepared from paraffin embedded liver biopsies of all cases included in this study and were used for immunostaining. Endogenous peroxidase was blocked using 3% H2O2. The immunostaining technique applied in this study was the improved horse raddish peroxidase amplified system. Antibodies their working concentrations and source are summarized in table 1.
Antibodies, their working concentrations and source.
| Antibody | Concentration | Source |
|---|---|---|
| FOXP3 monoclonal antibody | 50 μg/mL | Clone: 150 D Company (Biolegend; Indomedix Egypt) |
| Plasma cell IgG monoclonal antibody | 1:1000 | Clone: MOPC-21Company (Biolegend; Life Trade Egypt) |
| Plasma cell IgM monoclonal antibody | 1:1000 | Clone: MHM-88Company (Biolegend; Life Trade Egypt) |
| T cell CD4 monoclonal antibody | 1:10 | Dako, Life Trade Egypt |
| T cell CD8 monoclonal antibody | 1:100 | Dako, Life Trade Egypt |
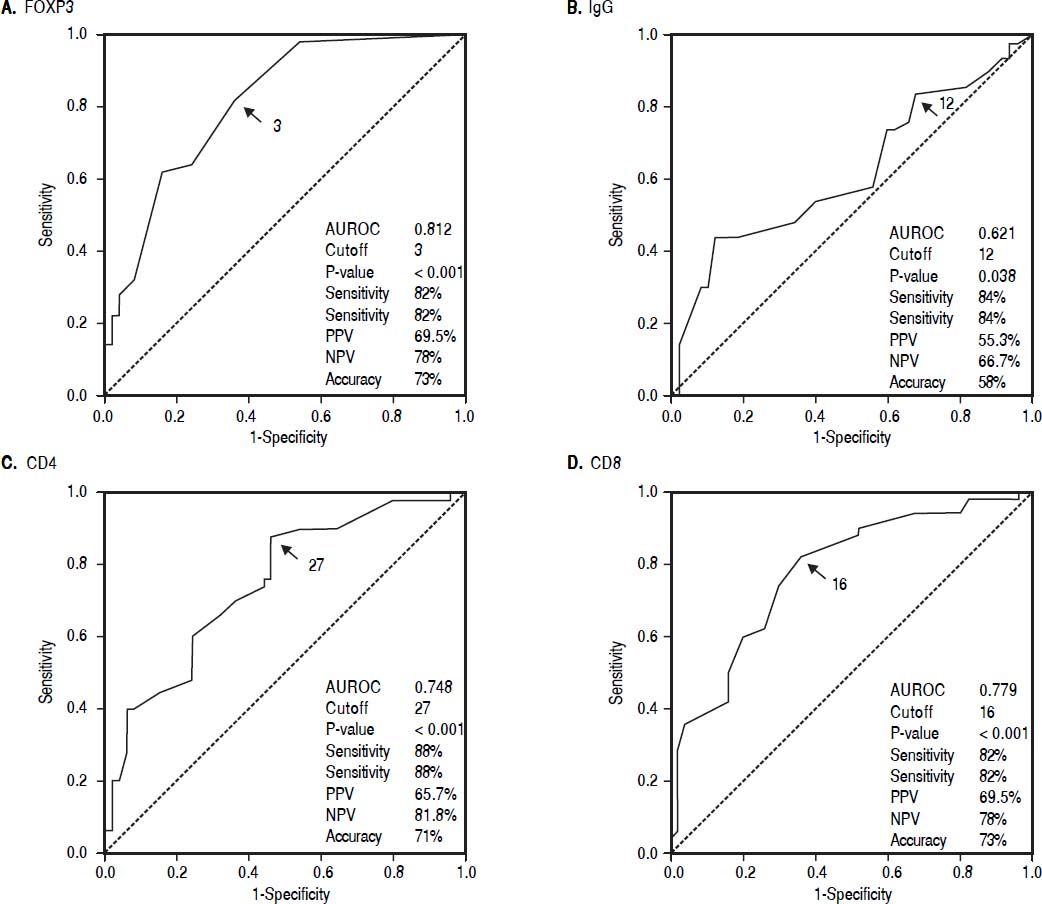
Qualitative data were expressed as frequency and percent. Quantitative data are shown as median or mean ± SD and range. Chi square (χ2) test was done to compare qualitative variables. Mann Whitney U test (Z) was done to compare the median of 2 sets of quantitative data. The Kruskal Wallis test was used for multiple sets of quantitative variables. The diagnostic values of FOXP3, CD4, CD8 and IgG in discriminating between AIH and CLD patients were assessed through The ROC curve by calculating the area under the receiver operator characteristic (AUROC) curves. The diagnostic performance was measured as sensitivity, specificity, positive predictive value (PPV) and negative predictive value (NPV). Results were considered significant if P ≤ 0.05. Statistical analysis was performed using SPSS software version 13 (SPSS Inc., Chicago, IL, United States).
ResultsAIH group included 17 males and 33 females. Twenty nine patients were type 1 AIH, 5 patients were type 2 AIH, 6 patients were diagnosed to have ASC, 2 patients had both HCV infection and AIH and 8 patients were seronegative. Patients had different clinical presentations and received different lines of treatment. Forty one patients were responders to treatment, while 9 patients didn’t show response.
Non-AIH group included 30 males, 20 females with different etiologies. 25 cases were HCV infection, glycogen storage disease (12 cases), Wilson disease (5 cases), congenital hepatic fibrosis (2 cases), galactosemia (3 cases) and there was one case of biliary atresia, one case of giant cell hepatitis and a case of mucopolysacharidosis (Table 2).
Baseline characteristics of AIH group and non-AIH.
| AIH (n = 50) | n (%) | Non-AIH (n = 50) | n (%) | |
|---|---|---|---|---|
| Underlying type | Type 1 | 29 (58) | HCV | 25 (50) |
| Type 2 | 5 (10) | Wilson | 5 (10) | |
| Seronegative | 8 (16) | GSD | 12 (24) | |
| ASC | 6 (12) | Galactosemia | 3 (6) | |
| AIH + HCV | 2 (4) | Giant cell hepatitis | 1 (2) | |
| Mucopolysaccaridosis | 1 (2) | |||
| Atypical CHF | 2 (4) | |||
| Biliary atresia | 1 (2) | |||
| Examination | HSM | 22 (44) | HSM | 2 (4) |
| Hepatomegaly | 5 (10) | Hepatomegaly | 14 (28) | |
| Jaundice | 1 (2) | Jaundice + HSM | 5 (10) | |
| Splenomegaly | 3 (6) | HSM + ascites | 1 (2) | |
| Jaundice + HSM | 16 (32) | HSM + dilated abdominal veins | 2 (4) | |
| HSM + cellulitis | 1 (2) | Doll face + short stature + hepatomegaly | 1 (2) | |
| HSM + short stature + coarse features | 1 (2) | |||
| Clinically free | 24 (48) |
Female gender was statistically significant higher in AIH group than non-AIH group (P = 0.016). The age of patients in AIH group was significantly older than the non- AIH group (P = 0.019) (Table 2).
Patients with AIH were divided according to response to treatment into responders (41 patients) and non-responder (9 patients) groups. The median of ALT level at presentation was significantly higher in the responder group; 268 IU/mL vs. 158 IU/mL in the non-responder group, P = 0.028. The median of GGT level was significantly higher in the non-responder group 87 IU/mL vs. 77 IU/mL in responder with P = 0.016. Gamma globulin level was found to be statistically significantly higher in the responder group (median = 3.7 gm/dL) than in the non-responder (median = 1.7 gm/dL) P = 0.002. Fibrosis stage was more significantly advanced at presentation in the non-responder group (4.5 ± 1.2) than in responder (3.4 ± 1.3) P = 0.026. The IgG/IgM was statistically significantly higher in the responder group (median = 2.5) while, in the non-responder (median = 1.6) P = 0.009. Contrary, there was no statistical significant difference regarding the intrahepatic expression of FOXP3 +, CD4 +, CD8+ cells, T-cells, IgG and IgM plasma cells between responders and non-responders (P > 0.05).
The median ALT level was significantly higher in the AIH patients than in non-AIH group; 124 IU/mL in AIH and 91 IU/mL in the other group P = 0.007. Total bilirubin levels were significantly higher in the AIH patients than in non-AIH group with a median bilirubin level 3 mg/dL in AIH and 0.7 mg/dL in non-AIH patients P = 0.037.
Prothrombin time was found to be significantly more prolonged in AIH than in non-AIH group 16.9 ± 4.8 Sec in AIH and 13.1 ± 1.8 Sec in non-AIH patients P < 0.001. Hemoglobin level was of a mean of 10.6 ± 1.3 gm/dL in AIH vs. 11.4 ± 1.1 gm/dL in non-AIH patients (P = 0.003). The median of the platelet count was significantly lower in AIH patients than for non-AIH patients (149 vs. 320) × 103/mm3 (P < 0.001).
Histopathological evaluation revealed that the histological activity index (HAI) mean was 9.4 ± 3.5 in AIH group vs. 4.5 ± 1.8 in non-AIH group P < 0.001. The mean stage of fibrosis was 3.6 ± 1.4 in AIH group vs. 2.2 ± 1.2 in non-AIH group P < 0.001 (Table 3). The FOXP3+ T cells in patients with AIH (median = 5) was statistically significantly higher than that in the non-AIH patients (median = 2) P < 0.001. FOXP3+ T cells were detected in liver tissue with marked inflammatory cellular infiltrate, whereas, weak reaction or negative for FOXP3 cells was noticed in conditions associated with minimal inflammatory infiltrate. The FOXP3+ cells to CD4+ cells was 15.6% in the AIH group while was 7% in non-AIH group (Table 3).
Immunological markers in the AIH and non-AIH groups.
| Immunological markers | AIH (n = 50) | Non-AIH (n = 50) | P-value | |
|---|---|---|---|---|
| FOXP3 | Range | 0-20 | 0-13 | < 0.001 |
| Median | 5 | 2 | ||
| IgG | Range | 0-40 | 0-46 | 0.046 |
| Median | 17 | 14 | ||
| IgM | Range | 0-20 | 0-22 | 0.826 |
| Median | 8 | 8 | ||
| CD4 | Range | 15-60 | 6-55 | < 0.001 |
| Median | 36 | 26 | ||
| CD8 | Range | 6-38 | 2-31 | < 0.001 |
| Median | 19 | 15 | ||
| IgG/IgM | Range | 0.5-20 | 0-6 | 0.237 |
| Median | 2.2 | 1.8 | ||
| FOXP3/CD4 | Range | 0-0.375 | 0-0.375 | < 0.001 |
| Median | 0.14 | 0.08 |
Immunostaining of CD4+ cells and CD8+ cells showed that CD4+ and CD8+ infiltrating the liver tissue was significantly higher in AIH patients than in the non-AIH patients P < 0.001. IgG or IgM plasma cells were absent or weakly expressed in some conditions of chronic liver diseases other than AIH. The median of expression of IgG positive cells in AIH was 17 while it was 14 in non-AIH patients P = 0.046. The median of expression of IgM positive cells were 8 in both groups with no significant difference (Table 3).
AIH groupData from this study revealed that in AIH group, there is a significant positive correlation between FOXP3 cells and IgG plasma cells, CD4+and CD8+ (P < 0.05).There were statistically significant positive correlation between the number of IgG plasma cells and the number of IgM plasma cells, FOXP3 cells, CD4+ and CD8+ (P < 0.05). There were statistically significant positive correlation between the number of IgM plasma cells and the number of IgG plasma cells, CD4+, CD8+ and grade of activity in liver biopsy and significant negative correlation with the IgG/IgM ratio (P < 0.05) (Table 4).
Correlation between FOXP3, CD4+, CD8+ and all studied parameters in AIH group.
| FOXP3 | CD4+ | CD8+ | ||||
|---|---|---|---|---|---|---|
| r | P-value | r | P-value | r | P-value | |
| FOXP3 | 0.734** | < 0.001 | 0.665** | < 0.001 | ||
| CD4+ | 0.734** | < 0.001 | 0.951** | < 0.001 | ||
| CD8+ | 0.665** | < 0.001 | 0.951** | < 0.001 | ||
| ALT (IU/mL) | 0.190 | 0.187 | 0.034 | 0.813 | 0.048 | 0.743 |
| AST (IU/mL) | 0.119 | 0.412 | 0.003 | 0.983 | 0.019 | 0.897 |
| PT (Seconds) | -0.045 | 0.757 | 0.037 | 0.799 | 0.029 | 0.840 |
| Hb (gm/dL) | -0.015 | 0.915 | 0.078 | 0.592 | 0.111 | 0.443 |
| WBCs (× 103/ mm3) | -0.088 | 0.543 | 0.024 | 0.869 | 0.018 | 0.904 |
| Platelet (× 103/ mm3) | -0.081 | 0.575 | 0.005 | 0.970 | 0.011 | 0.938 |
| Activity | 0.125 | 0.394 | 0.143 | 0.328 | 0.226 | 0.119 |
| Fibrosis | -0.005 | 0.972 | -0.065 | 0.658 | 0.002 | 0.991 |
Also significant positive correlation between the number of CD4+and the number of FOXP3 cells, CD8+, IgG plasma cells and IgM plasma cells (P < 0.05). There were statistically significant positive correlation between the number of infiltrating CD8+ and FOXP3, CD4+, IgG and IgM plasma cells (P < 0.05) (Table 4).
Non-AIH groupIn non-AIH group, there were statistically significant positive correlation between the FOXP3 cells and the CD4+, CD8+, IgG, and IgM plasma cells, total bilirubin and direct bilirubin levels. There were statistically significant positive correlation between the CD4+ and FOXP3 cells, CD8+, IgG, and IgM plasma cells (P < 0.05). Also, there was statistically significant negative correlation between the number of infiltrating CD4+and the white blood cell count (P < 0.05) (Table 5).
Correlation between FOXP3, CD4+, CD8+and all the patient parameters in the non-AIH group.
| FOXP3 | CD4+ | CD8+ | ||||
|---|---|---|---|---|---|---|
| r | P-value | r | P-value | r | P-value | |
| FOXP3 | 0.465** | < 0.001 | 0.434** | 0.002 | ||
| CD4+ | 0.465** | <0.001 | 0.882** | < 0.001 | ||
| CD8+ | 0.434** | 0.002 | 0.882** | < 0.001 | ||
| ALT (IU/mL) | 0.053 | 0.716 | -0.176 | 0.220 | -0.207 | 0.150 |
| AST (IU/mL) | 0.095 | 0.513 | -0.126 | 0.383 | -0.180 | 0.211 |
| T.BIL (mg/dL) | 0.300* | 0.034 | -0.077 | 0.596 | -0.058 | 0.690 |
| D.BIL (mg/dL) | 0.359* | 0.010 | -0.067 | 0.646 | -0.047 | 0.746 |
| PT (Seconds) | -0.060 | 0.677 | -0.048 | 0.742 | -0.140 | 0.333 |
| Hb (gm/dL) | -0.184 | 0.200 | 0.057 | 0.693 | 0.130 | 0.368 |
| WBCs (× 103/ mm3) | -0.123 | 0.395 | -0.340* | 0.016 | -0.376** | 0.007 |
| Platelet (× 103/mm3) | 0.228 | 0.111 | -0.042 | 0.774 | -0.011 | 0.942 |
| Activity | 0.124 | 0.430 | 0.284 | 0.065 | 0.248 | 0.108 |
| Fibrosis | -0.094 | 0.549 | -0.031 | 0.845 | -0.166 | 0.286 |
Also significant positive correlation between the CD8+ T lymphocytes and FOXP3 cells, CD4+, IgG and IgM plasma cells (P < 0.05). Also, there was statistically significant negative correlation between the number of infiltrating CD4+ and the white blood cell count (P < 0.05) (Table 5).
A significant positive correlation between the IgG plasma cells and FOXP3 cells, IgM plasma cells, IgG/ IgM, CD4+ and CD8+ (P < 0.05) were found (Table 5).
A significant positive correlation between the number of IgM cells and FOXP3 cells, IgG plasma cells, CD4+and CD8+ and statistically significant negative correlation between the IgM plasma cells and IgG/IgM were found (P < 0.05) (Table 5).
Cutoff values of the immunological markers between AIH and non-AIH groupsIntrahepatic FOXP3 cells in portal tracts with a cutoff value ≥ 3 cells /HPF, intrahepatic CD4+ cells ≥ 27 /HPF, The number of intrahepatic CD8+ cells ≥ 16 /HPF and the number of IgG plasma cells in portal tracts ≥ 12 /HPF support the diagnosis of AIH (Figure 1).
Discussion
Autoimmune hepatitis is a chronic and progressive necroinflammatory and fibrotic process of the liver of unknown cause. The diagnosis is made regarding clinical, biochemical and histological findings, abnormal levels of immunoglobulin G, the presence of the characteristic autoimmune antibodies and associated autoimmune diseases as idiopathic thrombocytopenic purpura.6 Thrombocytopenia also occurs in patients with AIH due to sequestration of platelets in the spleen in cases with splenomegaly,7in addition to defective thrombopoietin production in cases with liver cirrhosis.8
The spleen has been deemed an ancillary organ in portal hypertension. Now, it is thought to be central in regulating the immune system. In humans, the spleen does not act as a reservoir for red blood cells but it can store platelets in case of an emergency. Platelets are major carriers of serotonin (5-HT) in the blood. 5-HT has been reported to modulate T cell and natural killer (NK) cell proliferation.9
Liver biopsy represents an important part of the diagnostic evaluation of AIH patients. Significant histopathologic overlap exists among different autoimmune liver diseases and other chronic liver diseases.10 Little information is available regarding the intrahepatic distribution of Treg cells and its relation to CD4+, CD8+ and plasma cells infiltrating the liver in AIH in pediatrics.
Results from this study showed that the number of FOXP3 and CD4 cells in liver tissue from children with AIH was statistically significantly higher in AIH than non-AIH patients. FOXP3+ T cells were detected in liver tissue with marked inflammatory cellular infiltrate. Whereas, weak reaction or negative for FOXP3 cells was noticed in conditions associated with minimal inflammatory infiltrate. The percentage of FOXP3+ cells to CD4+ cells was 15.6% in AIH group while was 7 % in non-AIH group. Both effector lymphocytes (Th1, Th17, cytotoxic CD8+ cells) and Tregs are present in the human liver. The normal liver contains a low frequency of CD8+, CD4+ effector, and Tregs; however, inflammatory and autoimmune liver diseases are associated with enrichment of both subsets of lymphocytes. The balance of effector and regulatory cells generally determines the outcome of hepatitis.11
Therefore, findings from this study indicated that a generalized defect in Treg number does not seem to be a common disease feature of AIH. Although previous studies like those of Ichiki, et al.,12 Ma, et al.,13 Longhi, et al.,14 and Longhi, et al.,15 showed reduced numbers and defective Treg function in AIH.
On a study of Peiseler, et al.,16 they found higher Treg frequencies in blood and liver tissue during active disease compared with remission. Also, Buckner17 reported increased Treg frequencies in tissue with moderate to marked inflammation in other autoimmune diseases. Peiseler, et al.,16 explained their results by the use of better Treg markers in their study as they used low levels of CD127 and FOXP3 to accurately distinguish Treg cells from effector T cells. Earlier studies that used CD25 to define Treg cells appeared to be detecting effector CD4+ T cells and not Treg cells.
Furthermore, results from this study revealed that the intrahepatic expression of FOXP3 positive cells correlated with the grade of necro-inflammatory activity. Correlation of the number of intrahepatic FOXP3 cells with all investigated parameters in each of the 2 studied groups (AIH and non-AIH) revealed that the number of intrahepatic FOXP3 cells was correlated with the CD4+, CD8+, IgG plasma cells in the AIH group. In non-AIH group the number of intrahepatic FOXP3 cells was correlated with the CD4+, CD8+, IgG and IgM plasma cells as well as total and direct bilirubin levels.
While, when studying the relation of intrahepatic localization of FOXP3 positive cells to all the studied parameters in both groups together it was found that increased frequency of FOXP3 cells is associated with increased infiltration of CD4+, CD8+, IgG and IgM cells, serum AST, ALT and bilirubin total and direct levels. Also more prolongation in the prothrombin time and more necro-inflammatory activity and advanced fibrosis associated with more expression of FOXP3 positive cells, indicating that the infiltration of FOXP3 cells is associated with more inflammation.
Longhi, et al.18 reported that inability of Tregs to regulate CD8+ T-cell function at diagnosis may contribute to the initiation of autoimmune liver damage. The ability of Tregs to regulate CD8+ proliferation and IL-4 production during drug-induced remission suggests a role for immunosuppressive treatment at reconstituting Tregs function. Therefore, the author concluded that the liver-infiltrating Treg were not able to arrest the disease process. Oo, et al.,19 suggesting that the specific microenvironment of the liver might inhibit the suppressor activity of intrahepatic Tregs either by impairing Treg function itself or by increasing the resistance of effector cells to suppression by Treg. Wiegard, et al.20 had found that various liver cells were able to control the suppressive activity of Tregs. Another possibility is that the inherent plasticity of Treg may allow them to contribute to hepatic inflammation, or that the inflammatory stimulus may be too strong to be controlled by intrahepatic Treg cells. Yet another possibility is that the Treg cells, which accumulate in the liver, do not recognize the specific liver autoantigens, and hence do not exhibit suppressor activity. The identification of the relevant autoantigens is fundamental in understanding the disease pathogenesis.
The mean number of CD4+ and CD8+ cells infiltrating the liver tissue was significantly higher in AIH patients than in the non-AIH patients. These data support the evidence of the involvement of cellular immune mechanisms in the pathogenesis of autoimmune liver damage and suggesting that AIH patients have circulating lymphocytes ‘sensitized’ to liver antigens. The autoantibodies to CYP2D6 belong to the IgG isotype, implicating a CD4+ dependent class switch, and that the majority of T-cells infiltrating the liver in AIH are CD4+ lymphocytes.21
A study of Longhi, et al.22 had identified CYP2D6-specific CD8+ T-cells capable of secreting IFN-γ and of exerting cytotoxicity after recognition of CYP2D6 epitopic sequences in an HLA class I restricted fashion. The possibility that CYP2D6-specific CD8+ T-cell immune responses are directly involved in liver damage is suggested by the association of their strength with indices of disease activity and by their presence within the portal tract cellular infiltrate. These data are in accordance with results from this study in which the increased number of infiltrating CD4+ and CD8+ T-cells were associated with increase infiltration FOXP3 cells, IgG plasma cells and IgM plasma cells in AIH and non-AIH patients.
The necro-inflammatory activity in liver tissue, total bilirubin level and prothrombin time were also increased with the increased infiltration of CD4+ and CD8+ T-cells indicating more advanced liver disease and affection of the synthetic function of the liver with more infiltration of these cells in the liver tissue.
Positive cells for IgG and IgM were seen scattered in portal tracts and around bile ducts in liver tissue of AIH patients. IgG or IgM cells were absent in some conditions of CLD other than AIH. Weak presences of IgG or IgM positive cells were detected in some conditions of non-AIH liver diseases.
IgG positive cells in AIH were significantly statistically higher than in non-AIH liver diseases. While, there were no statistical significant difference in the number of IgM positive cells in AIH and non-AIH. In a study of Fallatah and Akbar23 the overall, patients with AIH had mean serum IgG levels that were significantly higher than in patients with other liver diseases. They used the mean serum IgG level for the AIH group (30.6 gm/L) and obtained a sensitivity of 90–98% and a specificity of about 96% for the diagnosis of AIH patients.
The IgG/IgM didn’t differ between AIH patients and patients with ASC which may be explained by the small number of ASC patients. However, there was a wide range in this ratio in AIH patients (0-20) while a narrow range was observed in the ASC patients (1.8–2.5).
Cabibi, et al24 found, specifically in liver biopsy of patients with a definite diagnosis of PBC, a marked amount of IgM plasma cells in the portal and peri-portal tracts compared to patients with AIH and PSC such as to patients with CHC, so showed that this finding significantly correlated with every typical clinical and histological feature of PBC. Conversely, IgG plasma cells were observed mostly in cases characterized by a more pronounced inflammatory activity, for example those with a diagnosis of AIH. Also a ratio IgG/IgM plasma cells mean counts of less than 1 was found only in these patients with PBC and in patients with AIC.
Cabibi, et al.,24 also, reported that in the subgroup of patients with a diagnosis of overlap PBC/AIH or AIC/AIH, a value of the IgG/IgM > 1 in all of them was found because they showed a more pronounced inflammatory activity, explained by biochemical and histological features, evidently related to the predominance of IgG plasma cells on liver biopsy. This finding is in accordance with results from this study where, the more infiltration of IgG plasma cells in liver tissue of all patients included in this study was associated with increase grade of necro-inflammatory activity in liver tissues at initial biopsy for diagnosis in all patients.
Data from this investigation revealed that increased infiltration of IgG plasma cells in all studied patients was correlated with the immunoreactive FOXP3 cells, IgM plasma cells, CD4+, CD8+ T cells and increased ratio of IgG plasma cells to the IgM cell ratio, while in AIH intrahepatic IgG plasma cells infiltration was only correlated with intrahepatic infiltration with FOXP3, CD4+ and CD8+ T cells and IgM plasma cells.
Moreover, the number of IgM plasma cells in the AIH group significantly correlated with the number of IgG plasma cells, CD4+ cells, CD8+cells and to the grade of necro-inflammatory activity in liver tissue. While on correlating the infiltrating number of IgM plasma cells with the patient parameters in non-AIH group and in all included patients there was statistically positive correlation between the IgM cells and FOXP3 cells and this may indicate that the IgM cells has no relation to the diagnosis of AIH and only related to the increase in the HAI in the liver biopsy which leads to increased infiltration of functioning Tregs. Increased ratio of IgG to the IgM plasma cells was associated with a higher diagnostic score of AIH patients.
The co-localization of B, CD4+ and CD8+ T-cell suggests functional interrelations between immune responses to a particular region. B-cells can function as antigen presenting cells to CD4+ T-helper lymphocytes that in turn provide help to cytotoxic T-lymphocytes.
The intrahepatic expression of FOXP3, CD4+, CD8+ cells, IgG, IgM plasma cells and the ratio of IgG to IgM plasma cells were compared between the responders and non-responders groups of AIH. It was found that only the IgG/IgM was statistically significant higher in the responders group than in non-responders.
Cutoff level of the number of intrahepatic infiltrating FOXP3, CD4+ and CD8+ T-cells and IgG plasma cells can help in differentiating patients with AIH from patients with other chronic liver diseases. The cutoff level of the intrahepatic FOXP3, CD4+, CD8+ and IgG cells may be included and applied in the future pediatric scoring system.
ConclusionIntrahepatic Tregs were not decreased in number in patients with AIH at initial presentation, but they were increased in number and their presence is associated with increased activity and inflammation in liver biopsy. The increased frequency of Tregs in AIH reflecting the impaired regulatory function of these cells or abnormal environment that makes them lose their regulatory function.
Authors’ ContributionsBehairy E Behairy, Hanaa A El-Araby, Hasan H Abd El kader, Nermin A Ehsan, Mohammed A. Khedr, Menan E Salem, were involved in the study concept and design, recruitment of patients, clinical management, follow up and data acquisition; Haidy M Zakaria performed the statistical analysis, designed the figures; all the authors reviewed and approved the manuscript.
Conflicts of InterestNone declared.


