


Background. Visfatin is a proinflammatory and insulin-mimetic adipokine contributing to whole body glucose and lipid metabolism. Studies to date are conflicting regarding the relationship between visfatin and non-alcoholic fatty liver disease (NAFLD). The aim of the present study was to evaluate the relationship of circulating visfatin with NAFLD. Material and methods. The study included 114 NAFLD patients and 60 healthy non-diabetic controls. Plasma visfatin, adiponectin, tumor necrosis factor alpha (TNF-α) and interleukin-6 (IL-6) levels were measured by ELISA. High sensitive C-reactive protein (hsCRP) levels were measured by immunoturbidimetric fixed rate method. Insulin sensitivity determined by homeostasis model assessment (HOMA-IR) index. Results. TNF-α, IL-6 and hsCRP levels were higher and, Adiponectin levels were lower in NAFLD group when compared to healthy controls (p < 0.001, for all). However, no difference was found regarding to visfatin levels between two groups. Different histologic subgroups of NAFLD had a significantly higher TNF-α, IL-6 and hsCRP, and lower adiponectin levels than those with controls (p < 0.001, for all). On the other hand, no statistically significant difference was found regarding to visfatin levels among different histologic groups. Visfatin was found to be negatively correlated with TNF-α (r = −0.236, p = 0.011) in NAFLD group. However, no association was found between visfatin and histological findings. Conclusion. Our findings show that plasma visfatin levels are not altered in the early stages of NAFLD. However, it is inversely associated with TNF-α. These findings suggest a role for visfatin in protection against liver injury in this widespread disease.
Non-alcoholic fatty liver disease (NAFLD) is a clinicopathological entity which is characterized by the presence of fat droplets in the hepatocytes without alcohol consumption, representing a spectrum of hepatic injuries, ranging from pure fatty infiltration (simple steatosis: SS) to inflammation (non-alcoholic steatohepatitis: NASH), fibrosis, and cirrhosis.1 It is also the hepatic manifestation of the metabolic syndrome (MetS), with insulin resistance as the main pathogenetic mechanism.2,3 Adipose tissue acts as a store of energy and an active endocrine organ. Adipokines (adipocytokines) -agents secreted primarily by adipocytes-modulate lipid and glucose metabolism and insulin sensitivity.4 In addition to their well established role in controlling adipose tissue physiology, adipokines have been shown to be involved in regulation of the inflammatory response, angiogenesis and fibrogenesis. As a result, adipokines together with insulin resistance seem to play a distinct role in the pathogenesis of NAFLD.5,6
Visfatin, also known as nicotinamide phosphori-bosyltransferase (NAMPT) and pre-B-cell colony-enhancing factor 1 (PBEF-1), is a proteine with multiple immunomodulating and proinflammatory properties. The main sources of visfatin are lymphocytes, monocytes, neutrophils, hepatocytes, adipocytes and pneumocytes. It promotes B-cell maturation and inhibits neutrophil apoptosis. Visfatin enhances activation of leukocytes, synthesis of adhesion molecules and production of proinflammatory cytokines. Visfatin expression is upregulated in a variety of acute and chronic inflammatory diseases including rheumatoid arthritis, sepsis, acute lung injury, inflammatory bowel disease and psoriasis.7–9
The relationships between visfatin and NAFLD have recently been examined.10,11,12 However, the available information on visfatin is still too little and controversial leaving our understanding of this adipokine and its physiological and pathophysiologic roles in NAFLD in its infancy. The aim of the present study was to evaluate the relationships of plasma visfatin with both pro- and anti-inflammatory adipocytokines and liver histology in this clinically relevant condition.
Material and MethodsStudy populationFrom January 2008 to December 2011, we enrolled 114 consecutive, male patients with biopsy-proven NAFLD. All patients were recruited in the outpatient clinic and were on an unrestricted dietary regimen. Body weight was stable during the 3 months preceding the study. No participants had any clinical evidence of cancer, cirrhosis, overt nephropathy or cardiovascular disease. Type 2 diabetes (T2D) was excluded by oral glucose tolerance test in NAFLD group according to the American Diabetes Association classification.13 Subjects with hypertension were also excluded. None of them was taking any medications known to affect circulating visfatin and inflammatory biomarkers such as lipid-lowering medications, metformin or thiazoli-dinediones.
NAFLD diagnosis was based on chronic elevation of transaminases (1.5 times the upper normal value for 3 months or longer), absence of hepatitis B and C virus markers, absence of autoantibodies indicative of autoimmune hepatitis or celiac disease, absent or negligible alcohol consumption (< 20 g/day), and bright liver at ultrasound scanning. In all patients, diagnosis was confirmed by liver biopsy.
The control group, recruited from hospital staff members and relatives, consisted of 60 apparently healthy male volunteers with normal liver ultrasonography and normal liver function tests. Before inclusion, all the study and control subjects underwent careful physical examination and detailed laboratory investigations to exclude any condition that may interfere with glucose tolerance and inflammation. The study was approved by the local ethics committee of Gulhane School of Medicine and all participants gaved their written informed consent to study, which was conducted according to the Helsinki Declaration.
Clinical and laboratory dataAll participants provided a medical history and underwent a clinical examination. The weight and height of the participants were measured with a calibrated scale after the patients had removed their shoes and any heavy clothing. Body mass index (BMI) was computed as body weight/(height2). Waist circumference (WC) was measured as the mid-point between the lower costal margin and the level of the anterior superior iliac crests.
For biochemical analyses, all blood samples were collected from an antecubital vein, between 08.00 and 09.00 a.m. after an overnight fasting. The samples were centrifuged for 5 min at 4,000 rpm, aliquoted and immediately frozen at −80 oC for analyses until examination. All samples were run in the same assay. Fasting plasma glucose (FPG), total cholesterol (TC), triglyceride (TG), and high-density lipo-protein cholesterol (HDL-C) levels were measured by the enzymatic colorimetric method with Olympus AU2700 auto analyzer using reagents from Olympus Diagnostics (GmbH, Hamburg, Germany). Low density lipoprotein cholesterol (LDL-C) was calculated by Friedewald’s formula.14 HsCRP level was determined in serum by immune turbidimetric fixed rate method by Olympus AU-2700 autoanalyzer (Hamburg, Germany). Intra-assay coefficient of variation (CV) and inter-assay CV were 5.8 and 3.1%, respectively. The minimum detectable concentration for hsCRP was 0.07 mg/L.
The serum basal insulin level was measured in duplicate by the chemiluminescence’s method using reagents from Roche Diagnostics (Mannheim, Germany). Insulin resistance was calculated by modified homeostasis model assessment of insulin resistance (HOMA-IR), with the following formula: HOMA-IR = fasting plasma insulin (μU/mL) x fasting plasma glucose (mg/dL)/405. HOMA-IR was originally reported by Matthews, et al.,15 and this index has been shown to be well correlated with the results of the euglycemic-hyperinsulinemic clamp method to determine insulin resistance.16
Plasma visfatin levels were determined by ELISA method (Human visfatin ELISA kit, Phoenix Pharmaceuticals, Belmont, CA, USA). The minimum detectable concentration for visfatin was 2.25 ng/mL. Intra-assay CV and inter-assay CV were 5 and 12%, respectively. Plasma adiponectin levels were determined by ELISA (Human Adiponectin ELISA Kit, Sissach, Switzerland). The minimum detectable concentration for adiponectin was 0.6 ng/mL. Intra-assay CV ranged from 2.35 to 4.66%, while inter-assay CV ranged from 5.7 to 6.72% for adiponectin. Plasma TNF-α and IL-6 levels were determined by ELISA (Human TNF-α High Sensitivity ELISA and Human IL-6 High Sensitivity ELISA, eBioscience, Vienna, Austria). The minimum detectable concentration for TNF-α and IL-6 were 0.13 pg/mL and 0.03 pg/mL, respectively. The calculated overall intra-assay CV for TNF-α and IL-6 and were 8.5 and 4.9%, while the calculated overall inter-assay CV for TNF-α and IL-6 were 9.8 and 6.0%, respectively. Measurements were carried out using ELISA plate reader Bio-Tek Synergy HT (Biotek Instruments Inc., Winooski, VT, USA).
Liver histologyThe histological diagnosis of NAFLD was established by the study pathologist, blinded to subjects’ details. Liver biopsy specimens were scored using the semiquantitative classification of Kleiner, et al.17 Patients were subdivided into three histological groups: SS (steatosis in the absence of inflammation and ballooning hepatocyte degeneration), borderline NASH (steatosis with minimal, rare inflammation, and hepatocyte ballooning), and NASH (steatosis with inflammation and hepatocyte ballooning, often with fibrosis). In brief, the degree of steatosis, liver injury, and inflammatory activity were scored using an 8-point scale (steatosis 0-3; lobular inflammation 0–3; ballooning hepatocyte degeneration 0–2). The stage of fibrosis was scored using a 6-point scale (1a, b =mild (1a)/moderate (1b) zone 3 perisinusoidal fibrosis; 1c =portal fibrosis only; 2 =zone 3 and portal/periportal fibrosis; 3 = bridging fibrosis; 4 = cirrhosis).
Statistical analysisThe SPSS software package version 15.0 for Windows (SPSS, Chicago, IL) was used for statistical evaluation. Data are presented as the mean ± standard deviation (SD) and median (min-max). Kolmo-gorov-Smirnov test was used to determine the distribution characteristics of variables, and Levene’s test was used to evaluate the equality of variance. Differences between groups were tested for significance by Mann-Whitney U test and independent sample t-test. Analysis of covariance was performed to evaluate the effect of BMI on visfatin levels in NAFLD group. The relationship between variables was analyzed by Spearman’s rho correlation. P values < 0.05 were considered statistically significant.
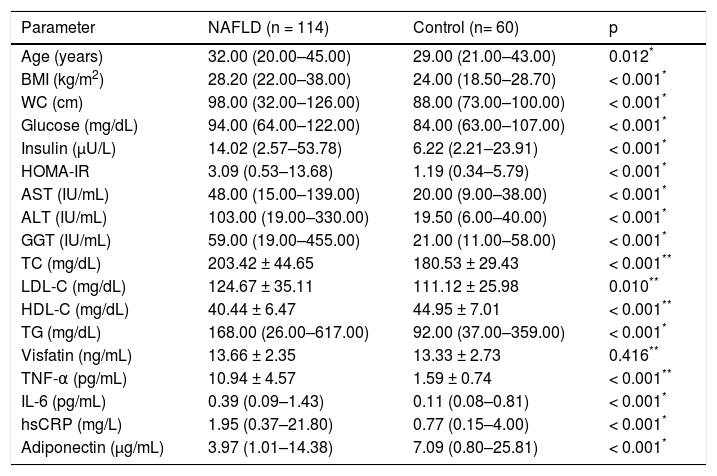
ResultsClinical and laboratory data of the patients and healthy controls included in the study are summarized in table 1. The NAFLD subjects have higher BMI, WC, FPG, TC, LDL-C, TG, fasting plasma insulin, HOMA-IR, ALT, AST and GGT than those of control subjects (p < 0.05 for all). In contrast, the control subjects have higher HDL cholesterol levels than patients. In addition, TNF-α, IL-6 and hsCRP levels were higher and adiponectin levels were lower in NAFLD group when compared with those of healthy controls (p < 0.001, for all). However, no difference was found regarding visfatin plasma levels between two groups.
The characteristics of the subjects with NAFLD and controls.
| Parameter | NAFLD (n = 114) | Control (n= 60) | p |
|---|---|---|---|
| Age (years) | 32.00 (20.00–45.00) | 29.00 (21.00–43.00) | 0.012* |
| BMI (kg/m2) | 28.20 (22.00–38.00) | 24.00 (18.50–28.70) | < 0.001* |
| WC (cm) | 98.00 (32.00–126.00) | 88.00 (73.00–100.00) | < 0.001* |
| Glucose (mg/dL) | 94.00 (64.00–122.00) | 84.00 (63.00–107.00) | < 0.001* |
| Insulin (μU/L) | 14.02 (2.57–53.78) | 6.22 (2.21–23.91) | < 0.001* |
| HOMA-IR | 3.09 (0.53–13.68) | 1.19 (0.34–5.79) | < 0.001* |
| AST (IU/mL) | 48.00 (15.00–139.00) | 20.00 (9.00–38.00) | < 0.001* |
| ALT (IU/mL) | 103.00 (19.00–330.00) | 19.50 (6.00–40.00) | < 0.001* |
| GGT (IU/mL) | 59.00 (19.00–455.00) | 21.00 (11.00–58.00) | < 0.001* |
| TC (mg/dL) | 203.42 ± 44.65 | 180.53 ± 29.43 | < 0.001** |
| LDL-C (mg/dL) | 124.67 ± 35.11 | 111.12 ± 25.98 | 0.010** |
| HDL-C (mg/dL) | 40.44 ± 6.47 | 44.95 ± 7.01 | < 0.001** |
| TG (mg/dL) | 168.00 (26.00–617.00) | 92.00 (37.00–359.00) | < 0.001* |
| Visfatin (ng/mL) | 13.66 ± 2.35 | 13.33 ± 2.73 | 0.416** |
| TNF-α (pg/mL) | 10.94 ± 4.57 | 1.59 ± 0.74 | < 0.001** |
| IL-6 (pg/mL) | 0.39 (0.09–1.43) | 0.11 (0.08–0.81) | < 0.001* |
| hsCRP (mg/L) | 1.95 (0.37–21.80) | 0.77 (0.15–4.00) | < 0.001* |
| Adiponectin (μg/mL) | 3.97 (1.01–14.38) | 7.09 (0.80–25.81) | < 0.001* |
Independent sample t-test. BMI: body mass index. WC: waist circumference. HOMA-IR: homeostasis model assessment for insulin resistance. AST: aspartate aminotransferase. ALT: alanine aminotransferase. GGT: gamma-glutamyl transpeptidase. TC: total cholesterol. LDL-C: low-density lipoprotein cholesterol. HDL-C: high-density lipoprotein cholesterol. TG: triglyceride. TNF-α: tumor necrosis factor alpha. IL-6: interleukin-6. hsCRP: high sensitivity C-reactive protein.
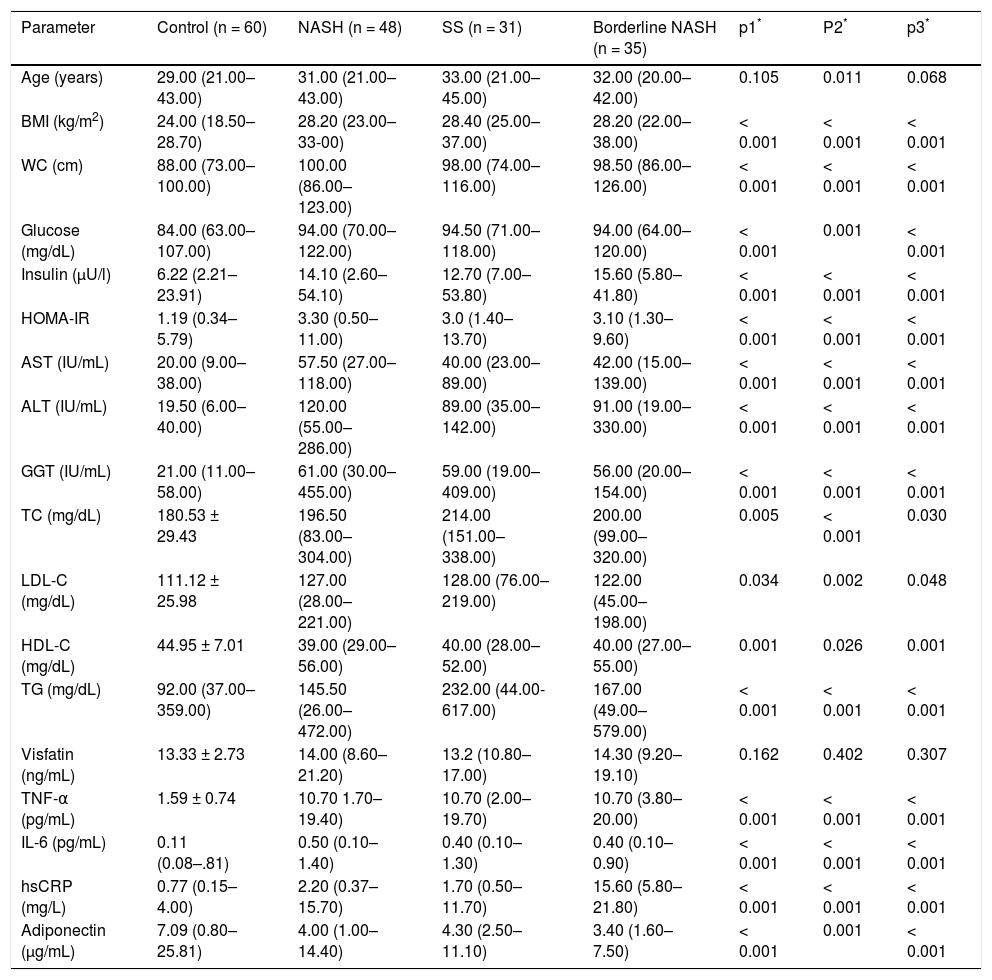
NAFLD patients were subsequently divided into SS (n = 31), borderline NASH (n = 35) and NASH (n = 48) groups. Groupwise comparisons showed that NASH, borderline NASH and SS patients have a significantly higher TNF-α, IL-6 and hsCRP, and lower adiponectin plasma levels than those with controls (p < 0.001, for all). On the other hand, no statistically significant difference was found regarding to visfatin levels among different histologic subgroups (Table 2).
The characteristics of the subjects with NAFLD subgroups and controls.
| Parameter | Control (n = 60) | NASH (n = 48) | SS (n = 31) | Borderline NASH (n = 35) | p1* | P2* | p3* |
|---|---|---|---|---|---|---|---|
| Age (years) | 29.00 (21.00–43.00) | 31.00 (21.00–43.00) | 33.00 (21.00–45.00) | 32.00 (20.00–42.00) | 0.105 | 0.011 | 0.068 |
| BMI (kg/m2) | 24.00 (18.50–28.70) | 28.20 (23.00–33-00) | 28.40 (25.00–37.00) | 28.20 (22.00–38.00) | < 0.001 | < 0.001 | < 0.001 |
| WC (cm) | 88.00 (73.00–100.00) | 100.00 (86.00–123.00) | 98.00 (74.00–116.00) | 98.50 (86.00–126.00) | < 0.001 | < 0.001 | < 0.001 |
| Glucose (mg/dL) | 84.00 (63.00–107.00) | 94.00 (70.00–122.00) | 94.50 (71.00–118.00) | 94.00 (64.00–120.00) | < 0.001 | 0.001 | < 0.001 |
| Insulin (μU/l) | 6.22 (2.21–23.91) | 14.10 (2.60–54.10) | 12.70 (7.00–53.80) | 15.60 (5.80–41.80) | < 0.001 | < 0.001 | < 0.001 |
| HOMA-IR | 1.19 (0.34–5.79) | 3.30 (0.50–11.00) | 3.0 (1.40–13.70) | 3.10 (1.30–9.60) | < 0.001 | < 0.001 | < 0.001 |
| AST (IU/mL) | 20.00 (9.00–38.00) | 57.50 (27.00–118.00) | 40.00 (23.00–89.00) | 42.00 (15.00–139.00) | < 0.001 | < 0.001 | < 0.001 |
| ALT (IU/mL) | 19.50 (6.00–40.00) | 120.00 (55.00–286.00) | 89.00 (35.00–142.00) | 91.00 (19.00–330.00) | < 0.001 | < 0.001 | < 0.001 |
| GGT (IU/mL) | 21.00 (11.00–58.00) | 61.00 (30.00–455.00) | 59.00 (19.00–409.00) | 56.00 (20.00–154.00) | < 0.001 | < 0.001 | < 0.001 |
| TC (mg/dL) | 180.53 ± 29.43 | 196.50 (83.00–304.00) | 214.00 (151.00–338.00) | 200.00 (99.00–320.00) | 0.005 | < 0.001 | 0.030 |
| LDL-C (mg/dL) | 111.12 ± 25.98 | 127.00 (28.00–221.00) | 128.00 (76.00–219.00) | 122.00 (45.00–198.00) | 0.034 | 0.002 | 0.048 |
| HDL-C (mg/dL) | 44.95 ± 7.01 | 39.00 (29.00–56.00) | 40.00 (28.00–52.00) | 40.00 (27.00–55.00) | 0.001 | 0.026 | 0.001 |
| TG (mg/dL) | 92.00 (37.00–359.00) | 145.50 (26.00–472.00) | 232.00 (44.00-617.00) | 167.00 (49.00–579.00) | < 0.001 | < 0.001 | < 0.001 |
| Visfatin (ng/mL) | 13.33 ± 2.73 | 14.00 (8.60–21.20) | 13.2 (10.80–17.00) | 14.30 (9.20–19.10) | 0.162 | 0.402 | 0.307 |
| TNF-α (pg/mL) | 1.59 ± 0.74 | 10.70 1.70–19.40) | 10.70 (2.00–19.70) | 10.70 (3.80–20.00) | < 0.001 | < 0.001 | < 0.001 |
| IL-6 (pg/mL) | 0.11 (0.08–.81) | 0.50 (0.10–1.40) | 0.40 (0.10–1.30) | 0.40 (0.10–0.90) | < 0.001 | < 0.001 | < 0.001 |
| hsCRP (mg/L) | 0.77 (0.15–4.00) | 2.20 (0.37–15.70) | 1.70 (0.50–11.70) | 15.60 (5.80–21.80) | < 0.001 | < 0.001 | < 0.001 |
| Adiponectin (μg/mL) | 7.09 (0.80–25.81) | 4.00 (1.00–14.40) | 4.30 (2.50–11.10) | 3.40 (1.60–7.50) | < 0.001 | 0.001 | < 0.001 |
Mann Whitney U test (Statistically significant ρ value is <0.008 since Bonferroni correction). p1: control vs. NASH. p2: control vs. SS. p3: control vs. Borderline NASH. BMI: body mass index. WC: waist circumference. HOMA-IR: homeostasis model assessment for insulin resistance. AST: aspartate aminotransferase. ALT: alanine aminotransferase. GGT: gamma-glutamyl transpeptidase. TC: total cholesterol. LDL-C: low-density lipoprotein cholesterol. HDL-C: high-density lipoprotein cholesterol. TG: triglyceride. TNF-α: tumor necrosis factor alpha. IL-6: interleukin-6. hsCRP: high sensitivity C-reactive protein.
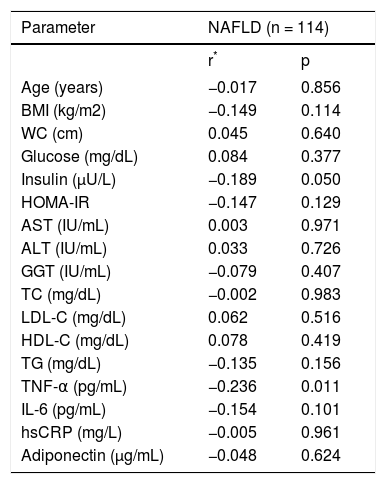
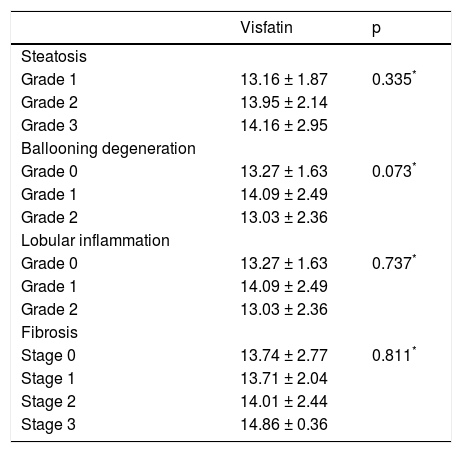
We further analyzed our results searching for possible interactions between visfatin and other parameters studied. Visfatin levels were found to be negatively correlated with TNF-α (r = −0.236, p = 0.011) in NAFLD group. However, visfatin was not associated with all the other parameters included in the study (Table 3). Moreover, no association was found between visfatin and histological findings (Table 4). Visfatin levels were also not found to be associated with NAFLD subgroups even after adjustment for BMI by covariance analysis (p = 0.49).
Correlations between visfatin and other variables in NAFLD group.
| Parameter | NAFLD (n = 114) | |
|---|---|---|
| r* | p | |
| Age (years) | −0.017 | 0.856 |
| BMI (kg/m2) | −0.149 | 0.114 |
| WC (cm) | 0.045 | 0.640 |
| Glucose (mg/dL) | 0.084 | 0.377 |
| Insulin (μU/L) | −0.189 | 0.050 |
| HOMA-IR | −0.147 | 0.129 |
| AST (IU/mL) | 0.003 | 0.971 |
| ALT (IU/mL) | 0.033 | 0.726 |
| GGT (IU/mL) | −0.079 | 0.407 |
| TC (mg/dL) | −0.002 | 0.983 |
| LDL-C (mg/dL) | 0.062 | 0.516 |
| HDL-C (mg/dL) | 0.078 | 0.419 |
| TG (mg/dL) | −0.135 | 0.156 |
| TNF-α (pg/mL) | −0.236 | 0.011 |
| IL-6 (pg/mL) | −0.154 | 0.101 |
| hsCRP (mg/L) | −0.005 | 0.961 |
| Adiponectin (μg/mL) | −0.048 | 0.624 |
Spearman correlation coefficient. BMI: body mass index. WC: waist circumference. HOMA-IR: homeostasis model assessment for insulin resistance. AST: aspartate aminotransferase. ALT: alanine aminotransferase. GGT: gamma-glutamyl transpeptidase. TC: total cholesterol. LDL-C: low-density lipoprotein cholesterol. HDL-C: high-density lipoprotein cholesterol. TG: triglyceride. TNF-α: tumor necrosis factor alpha. IL-6: in-terleukin-6. hsCRP:
Relationship between visfatin and histological findings.
| Visfatin | p | |
|---|---|---|
| Steatosis | ||
| Grade 1 | 13.16 ± 1.87 | 0.335* |
| Grade 2 | 13.95 ± 2.14 | |
| Grade 3 | 14.16 ± 2.95 | |
| Ballooning degeneration | ||
| Grade 0 | 13.27 ± 1.63 | 0.073* |
| Grade 1 | 14.09 ± 2.49 | |
| Grade 2 | 13.03 ± 2.36 | |
| Lobular inflammation | ||
| Grade 0 | 13.27 ± 1.63 | 0.737* |
| Grade 1 | 14.09 ± 2.49 | |
| Grade 2 | 13.03 ± 2.36 | |
| Fibrosis | ||
| Stage 0 | 13.74 ± 2.77 | 0.811* |
| Stage 1 | 13.71 ± 2.04 | |
| Stage 2 | 14.01 ± 2.44 | |
| Stage 3 | 14.86 ± 0.36 |
Because of the well-known relationship of visfatin with MetS,18 we aimed to search the possible association of this molecule with MetS in subjects with NAFLD. But, according to the National Cholesterol Education Program19 only 13 patients had MetS, so we couldn't analyze this relationship.
DiscussionThere are conflicting reports in the literature regarding the relationship between visfatin, an adi-pocytokine with proinflammatory and immunomodulating properties, and NAFLD. It has been reported that circulating visfatin levels were significantly increased in subjects with NAFLD when compared to both lean and obese healthy controls. In addition, visfatin levels decreased markedly when NASH was diagnosed. However, it was still significantly higher than in both lean and obese healthy subjects.20 Aller, et al. found that serum visfatin level was not related to steatosis grade and did not differ between groups with low and high-grade steatosis in overweight and obese patients with NAFLD. On the other hand, visfatin levels were related to the severity of portal inflammation and predicted the presence of portal inflammation. However, there was no association between visfatin and grade of lobular inflammation in NAFLD.12 In another study, Gaddipati, et al. showed that visceral visfatin in NASH were significantly lower than SS. Moreover, the visceral visfatin levels were higher in non-NAFLD subjects. The low level of visceral visfatin was independent of BMI and IR. On the basis of these findings, the authors pointed to the protective role of visfatin in NAFLD.21 A study by Dahl, et al. showed that liver visfatin expression and its serum level were markedly decreased in patients with NAFLD, with no difference between SS and NASH.11 In the present study, we did not find any difference regarding circulating visfatin levels in subjects with NAFLD when compared to healthy controls. In addition, no difference was found regarding visfatin plasma levels among the different histological groups of NAFLD.
We suggest some possible explanations for the lack of relationship between visfatin and NAFLD observed in our study. Firstly, when the above mentioned studies were analyzed separately, it can be seen that most of the patients with NAFLD had metabolic confounders like severe obesity, T2D and hypertension. It has been reported that visfatin levels may be affected from these metabolic risk factors.12,20,22 Secondly, some part of these subjects was also using the medications related to these metabolic problems. Various drug treatments for T2D, hypertension, and hyperlipidemia with thiazo-lidinediones, statins, angiotensin converting enzyme inhibitors, biguanide, and insulin therapy have been shown to alter adipokine levels measured in this cohort and thus blurred the distinction between histological groups.23–26 On the other hand, there are also contradictory findings regarding the effect of these confounders on circulating visfatin concentrations.27–29 We suggest that the lack of difference regarding visfatin levels in our groups could be dependent on the selection criteria of our study population, as we excluded subjects with T2D, hypertension and severe obesity (BMI ≥ 40 kg/m2). The abnormalities in glucose and blood pressure that can potentially affect circulating visfatin concentrations are frequently accompanied by NAFLD. Therefore, we think that including only the subjects free from these confounding factors is an important feature of the present investigation.
Visfatin has been suggested as an inflammatory cytokine that is produced and released by the adipose tissue derived macrophages.30,31 It promotes B-cell maturation and inhibits neutrophil apoptosis,32,33 and enhances activation of leukocytes, synthesis of adhesion molecules and production of proinflammatory cytokines.9,34 In CD14+ monocytes, visfatin enhanced the production of IL-1b, TNF-α, and especially of IL-6.30 On the other hand, visfatin expression in adipocytes was found to be downregulated by IL-6.35 Visfatin was also reported to be expressed in hepatocytes and inhibited apoptosis of hepatocytes in vitro. The antiapoptotic effect of visfatin in hepatocytes involved enzymatic synthesis of nicotinamide adenine dinucleotide.31 Plasma visfatin was found to be negatively correlated to the grade of necro-inflammatory activity in patients with chronic hepatitis C, suggesting that visfatin may be a regulator of the inflammatory process in this condition.36 Because hepatocyte apoptosis is an important feature of chronic hepatitis, downregulation of visfatin in advanced inflammatory processes suggests a hepatoprotective role for visfatin. Circulating visfatin levels were significantly decreased in liver cirrhosis compared with healthy controls, presumably owing to decreased hepatic expression and production. The different underlying etiologies of liver cirrhosis had no significant impact on plasma visfatin levels or on hepatic visfatin production. Patients in the early clinical stages of cirrhosis -child class A liver cirrhosis- already had decreased plasma visfatin levels that were, however, significantly higher than those of patients with child class B or C liver cirrhosis.37 In the present study, we did not find any association of visfatin with liver histology in NAFLD. On the other hand, visfatin levels were correlated negatively and significantly with TNF-α in our cohort. In light of the above data, we suggest that visfatin may have a protective role against hepatocyte injury during the ongoing inflammatory process in early stages of NAFLD. Hence, in agreement with this hypothesis, a similar protective effect of visfatin against hepatocyte injury was also described in NAFLD.38 Moreover, TNF-α levels in visceral adipose tissue were shown to be inversely associated with visceral visfatin levels, suggesting that TNF-α down regulates visfatin expression in NAFLD.21 These observations may additionally support a protective role of visfatin against the liver injury in this clinically relevant condition.
The present study has several limitations. Firstly, because of the small number of patients and the strict inclusion criteria, the findings obtained are not representative for all subjects with NAFLD. But we think that the design of our study was a requirement for the goals to achieve. Secondly, all participants were men, and that it remains to be determined if these results are similar also in women. Lastly, LDL-C levels were calculated by Friedewald’s formula. Although this formula is usually recommended for this purpose because of its low costs, accessibility and ease of use, it has several limitations.
In conclusion, the results of this study show that plasma visfatin levels are not altered in the early stages of NAFLD. However, it is inversely associated with TNF-α. Our findings further support a role for visfatin in protection against liver injury in this widespread disease. More studies in larger population are however needed to integrate these results.
Abbreviations- •
IL-6: interleukin-6.
- •
BMI: body mass index.
- •
BMI: body mass index.
- •
FPG: fasting plasma glucose.
- •
HDL-C: high-density lipoprotein cholesterol.
- •
HOMA-IR: insulin sensitivity determined by homeostasis model assessment index.
- •
hsCRP: high sensitive C-reactive protein.
- •
MetS: metabolic syndrome.
- •
NAFLD: non-alcoholic fatty liver disease.
- •
NAMPT: nicotinamide phosphoribosyltransferase.
- •
NASH: non-alcoholic steatohepatitis.
- •
PBEF-1: pre-B-cell colony-enhancing factor 1.
- •
SS: simple steatosis.
- •
T2D: type 2 diabetes.
- •
TC: total cholesterol.
- •
TG: triglyceride.
- •
TNF-a: tumor necrosis factor alpha.
The authors declare that there is no conflict of interest that could be perceived as prejudicing the impartiality of the research reported.
Financial DisclosureThis work was supported by a grant from the Research Center of Gulhane Medical School (2010/49).
AcknowledgmentNone.


