


Background. The study of NAFLD in humans has several limitations. Using murine models helps to understand disease pathogenesis.
Aim. Evaluate the impact of 4 different diets in the production of NAFLD with emphasis on a combined high-fat plus sustained high sucrose consumption.
Material and methods. Eight week-old male Wistar rats were divided in four groups and fed for 90 days with the following diets: 1) Control chow diet (C); 2) High-fat cholesterol diet (HFC) + 5% sucrose in drinking water. 3) High-fat cornstarch diet (HFCO) + 5% sucrose in drinking water. 4) Chow diet + 20% sucrose in drinking water (HSD). Metabolic changes, leptin levels, liver histology, hepatic and plasma lipid composition, fasting plasma glucose and insulin and liver gene expression of FAS, SREBP-1 and PPAR-α were evaluated.
Results. The HFC diet had the highest grade of steatosis (grade 2 of 3) and HSD showed also steatosis (grade 1). Liver weight TG and cholesterol concentrations in liver were greater in the HFC diet. There were no increased levels of iron in the liver. Rats in HFC gained significantly more weight (P < 0.001). All experimental groups showed fasting hyperglycemia. HFC had the highest glucose level (158.5 ± 7 mg/dL) (P < 0.005). The HSD and the HFCO diets developed also hyperglycemia. HSD had significantly higher fasting hyperinsulinemia. Serum leptin was higher in the HFC diet (p = 0.001). In conclusion, the HFC diet with combination of high fat and high sucrose is more effective in producing NAFLD compared with a high sucrose diet only.
Non-alcoholic fatty liver disease (NAFLD) is an important cause of liver disease and is emerging as the most common chronic liver condition in the Western World.1 It may progress to non-alcoholic steatohepatitis (NASH), fibrosis, cirrhosis and occasionally to hepatocellular carcinoma.2 Despite the high prevalence of NAFLD and its associated consequences, the underlying etiologic factors that determine disease progression are poorly understood.3
The study of NAFLD with human tissue has several limitations because the occurrence and progression of NAFLD requires a long period of time, it is difficult to obtaining tissue samples, there is a limited ability to define causes and effects and ethical limitations exists.4
Rodent biological processes are similar to those in man and using murine models help us to understand the disease pathogenesis. Up to the present time, no animal model completely reproduces the histopathology and pathophysiology of human NAFLD/NASH. The use of animal models with deletion or over-expression of a single gene, may not mimic the etiology of human disease because NAFLD is a complex pathology with many influencing factors. Also, experimental diets associated with development of NAFLD may not completely simulate the human diets, but they are theoretically desirable for their similarity to the human condition. The rodent model should exhibit also metabolic abnormalities such as obesity, insulin resistance, fasting hyperglycemia, dyslipidemia and altered adipokine profile. Thus the more of the previously mentioned metabolic criteria are met, the more intrinsically useful the model be-comes.5
A chronic high-fat diet or sustained high fructose consumption diet have been used as models of the metabolic syndrome with histological features of a mild-moderate NAFLD/NASH.6 A problem with the high-fat diet, is that rodents may adapt to high-fat feeding and become resistant to obesity development, and/or other metabolic abnormalities.7 The combination of a high-fat diet and sustained high sucrose consumption may resemblance modern human diet.
There have been repots that NAFLD is associated with hepatic iron overload, indicating that iron-induced oxidative stress may be related to NAFLD pa-thology.8
The aims of the present work were to characterize and compare liver histology, hepatic and plasma lipid composition, iron liver content, fasting plasma glucose and insulin changes, leptin levels and liver gene expression of fatty acid synthase (FAS), Sterol regulatory element-binding protein-1 (SREBP-1) and peroxisome proliferator-activated receptor alpha (PPAR-α) in 4 different types of diets with emphasis on a combined high-fat plus a sustained high sucrose consumption.
Material and MethodsThe animal protocol was approved by the Animal Committee of the National Institute of Medical Sciences and Nutrition, according to the Guide for the Care and Use of Laboratory Animals.
AnimalsEight week-old male Wistar rats weighing an average of 220 g were obtained from the Experimental Research Department and Animal Care Facility at the Instituto Nacional de Ciencias Médicas y Nutrición, Mexico City. All animals were housed in small individual stainless-steel cages in a controlled temperature and humidity environment with a 12-h light/12-h dark cycle and had free access to water and food throughout the study. An important aspect is that the rats were essentially sedentary in small cages with little opportunity for physical activity, except to eat and drink.
After a 1-week acclimation period, the rats were randomly divided in four groups of five animals each group and fed for 90 days with one of the following diets:
- •
Control chow diet (C) (standard rodent chow pellets containing 13.4% fat, 28.5% protein, and 57.9% carbohydrate by calories; Purina, Richmond, IN).
- •
High-fat cholesterol diet (HFC) containing 45% fat (lard), 20.7% casein protein and 34.1% carbohydrate with dextrose (29%), sucrose, cellulose and inulin (1.72%) + 5% sucrose in drinking water.
- •
High-fat cornstarch diet (HFCO) made with a chow diet added with 20% of lard, containing 50% fat, 16.5% protein and 33.5% carbohydrate with starch (25.52%) + 5% sucrose in drinking water.
- •
Chow diet (13.4% fat, 28.5% protein, and 57.9% carbohydrate) + 20% sucrose in drinking water (HSD).9
High-fat diets were weekly prepared in our laboratory in pellets and stored at 4°C. Body weight and food intake were recorded every day.
At day 30 and 60, and after an overnight fast, a blood sample was collected from the tail vein for measurement of serum biochemical variables. At the end of the study (day 90), body weight was recorded and the rats were killed after an overnight fast. The rats were killed by decapitation after CO2 anaesthetization. Blood was collected in tubes with a gel and clot activator (BD) and centrifuged at 1,500 x g for 10 min; serum was separated and stored at -70° C until further analysis.
Liver lipid content and histological analysisDuring euthanasia the liver was removed, weighed and immediately frozen and stored at -80° C. Hepatic lipids were extracted with chloroformmethanol using the Folch method.10 From the extracts, hepatic cholesterol and TG concentrations were measured using commercially available enzymatic colorimetric kits (DiaSys Diagnostic Systems International, Holzheim, Germany). Before cryopreservation, liver tissue samples were taken and fixed in formalin for hematoxylin-and-eosin and Masson-trichrome staining. A pathologist blindly classified the grade of steatosis according to Kleiner and Brunt.11 Prussian blue stain was performed to identify iron in the liver.
Quantitative real-time PCRTotal RNA was extracted from hepatic tissue.12 After RNA extraction integrity was confirmed by gel electrophoresis, concentration and purity was measured by espectophotometry with Nanodrop ND-1000. cDNA synthesis was carried out with M-MLV reverse transcriptase and oligo(dT)12e18 primer (In-vitrogen, Carlsbad, CA). mRNAs expression was measured by real-time quantitative PCR using Taqman Universal Master Mix (Applied Biosystems/ Roche, Branchburg, NJ). RT-PCR assays for each gene were carried out in triplicate using 10 ng of reverse transcriptase product in 96-well optical plates with an ABI Prism 7000 Sequence Detection System (Applied Biosystems, Foster City, CA). The PCR scheme used was 50 °C for 2 min, 95 °C for 10 min, and then 40 cycles of 95 °C for 15 sec followed by 60 °C for 1 min. The 18S ribosomal RNA was used as an invariant control for liver samples (4319413E). TaqMan fluorogenic probes/oligonucleotide primers were obtained from Applied Biosystems for the following genes: fatty acid synthase (FAS; Rn00569117_m1), peroxisome proliferator-activated receptor-a (PPAR-a;Rn00566193_m1), sterol regulatory element binding protein-1 (SREBP-1;Rn01495769_m1). The relative amounts of mRNA were calculated by using the ΔΔCt method with an efficiency adjustment according to the Pfaffl equation.13
Serum measurementsSerum glucose was measured with the YSI select 2700 Biochemistry Analyzer (YSI Incorporated). Triglyceride (TG) and cholesterol concentrations were measured using an enzymatic-photometric assay kit (DiaSys Diagnostic Systems).
Serum insulin was analyzed by radioinmunoassay kit (Linco Research Immunoassay and Millipore) according to the manufacturer instructions. Serum leptin was analyzed using a RAT LEPTIN ELISA KIT 96-Well Plate, Millipore-USA (Cat. #EZRL83K). This assay is a Sandwich ELISA based, sequentially, on:
- •
Capture of leptin molecules from samples to the wells of a microtiter plate coated with a monoclonal anti-leptin antibody.
- •
Washing of unbound materials from samples.
- •
Binding of a second biotinylated monoclonal anti-leptin antibody to the captured molecules.
- •
Washing of unbound materials from samples.
- •
Binding of streptavidin-horseradish peroxidase conjugate to the immobilized biotinylated antibody.
- •
Washing of excess free enzyme conjugates, and
- •
Quantification of immobilized antibody-enzyme conjugates by monitoring horseradish peroxidase activities in the presence of the substrate 3,3’,5,5’-tetramethylbenzidine. The enzyme activity was measured spectrophotometrically to 450 nm absorbance (Epoch. Biotek-USA).
Results are presented as mean ± SEM. Data that were not normally distributed were logarithmically transformed prior to analysis. Differences among experimental groups were evaluated by one-way ANOVA followed by Bonferroni’s multiple comparison test, and differences were indicated with different letters in each figure (a>b>c>d). Differences were considered statistically significant at P < 0.05. All statistical analyses were conducted using GraphPad Prism 5.00 (San Diego, CA).
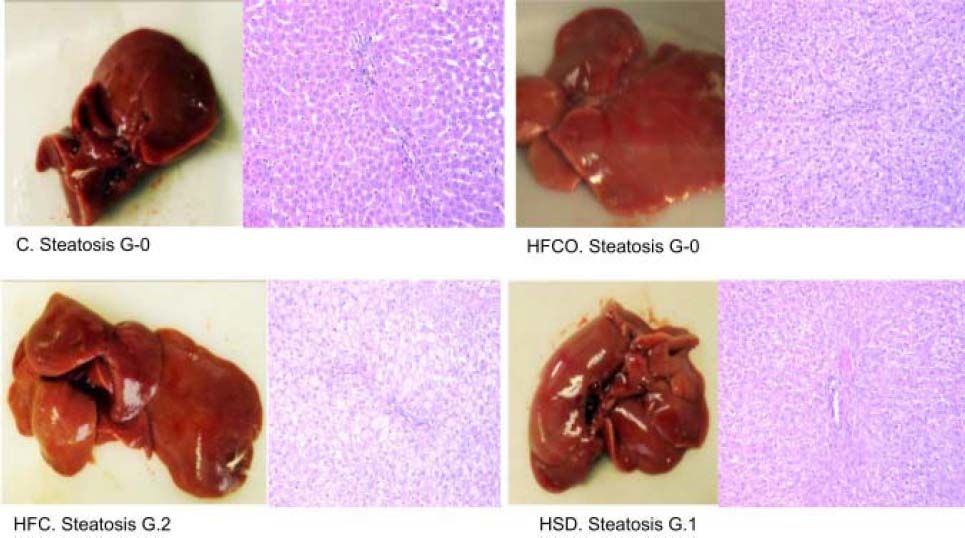
ResultsHistological analysis of the liverHistological analysis with hematoxylin-and-eosin staining showed:
- •
HFC diet had grade 2 (grade 2/3: 34-66% of hepatocytes) microvesicular and macrovesicular steatosis in zone in 3 in all rats. The higher-grade of steatosis in the HFC diet, correlates with higher liver weight, higher hepatic TG and cholesterol levels and also with high circulating leptin levels showed in this diet.
- •
HSD had grade 1 steatosis (grade 1/3: 5-33% of hepatocytes)11 in all animals (Figure 1). No steatosis developed in the HFCO or C diets.
 but also steatosis in the HSD (grade 1 of 3: 5-33% of hepatocytes).10 C: control chow diet. HFC: high-fat cholesterol. HFCO: high-fat cornstarch. HSD: high sucrose diet. G: grade.") Figure 1.
Figure 1.Grade of liver steatosis. Histologic analysis of livers with hematoxylin-and-eosin staining showed higher steatosis in the HFC (grade 2 of 3: 34-66% of hepatocytes) but also steatosis in the HSD (grade 1 of 3: 5-33% of hepatocytes).10 C: control chow diet. HFC: high-fat cholesterol. HFCO: high-fat cornstarch. HSD: high sucrose diet. G: grade.
(0.07MB).
 but also steatosis in the HSD (grade 1 of 3: 5-33% of hepatocytes).10 C: control chow diet. HFC: high-fat cholesterol. HFCO: high-fat cornstarch. HSD: high sucrose diet. G: grade.")
Prussian blue stain was negative in both hepatocytes and ducts. This shows that the examined tissue have no increased levels of iron in the liver.
Serum and hepatic lipid concentrationsRats fed with the HFC diet had a serum cholesterol concentration (70.78 ± 6.3 mg/dL) that was approximately 25% higher than the C diet (53.23 ± 11.16 mg/ dL) and higher than the other groups. The serum cholesterol level in the HSD was also 16% higher (63.58 ± 9.9 mg/dL) that the C diet. Interestingly, serum cholesterol level in the HFCO (42.43 ± 5.2 mg/dL) diet was approximately 21% lower than that of C diet (p = 0.004). Compared with all groups the HSD diet developed the highest plasma TG concentration (163.69 ± 32 mg/dL) and it was more than twice compared with C diet (74.69 ± 15.2 mg/dL, P = 0.002). TG serum concentrations of the HFC (124.83 ± 4.9 mg/dL) diet was 41% greater than C and HFCO was similar to the C diet (75.41 ± 16.4 mg/dL).
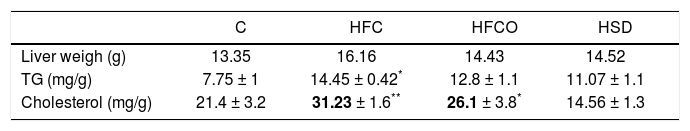
Liver weight, TG and cholesterol concentrations in liver were significantly higher in rats with the HFC diet compared with the other groups (Table 1).
TG, cholesterol and liver weight.
| C | HFC | HFCO | HSD | |
|---|---|---|---|---|
| Liver weigh (g) | 13.35 | 16.16 | 14.43 | 14.52 |
| TG (mg/g) | 7.75 ± 1 | 14.45 ± 0.42* | 12.8 ± 1.1 | 11.07 ± 1.1 |
| Cholesterol (mg/g) | 21.4 ± 3.2 | 31.23 ± 1.6** | 26.1 ± 3.8* | 14.56 ± 1.3 |
Liver weight TG and cholesterol concentrations were significantly higher in rats with the HFC diet compared with the other groups.
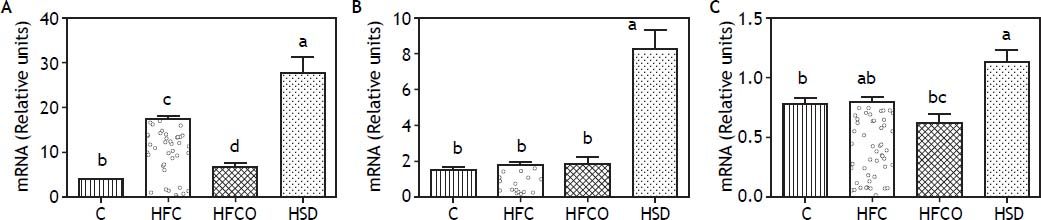
To study the effect of the different diets on the expression of lipogenic and fatty acid oxidation genes, we measured the mRNA of the transcription factor SREBP-1 and its target gene FAS in the liver (Figure 2A and 2B). Interestingly, the HSD group expressed significantly higher amounts of SREBP-1 than the other groups. FAS expression followed a similar trend with higher amounts in the HSD diet. In the other groups tested, just the HFC diet produced a significant increase in the expression of SREBP-1 compared with C.
, FAS (B) and PPAR-α (C) in liver comparing four different diets. Expressions were higher in the HSD group. C: control chow diet. HFC: high-fat cholesterol. HFCO: high-fat cornstarch. HSD: high sucrose diet.")
A. SREBP-1c expression. B. FAS expression. C. PPAR-α expression. Relative expression of SREBP-1 (A), FAS (B) and PPAR-α (C) in liver comparing four different diets. Expressions were higher in the HSD group. C: control chow diet. HFC: high-fat cholesterol. HFCO: high-fat cornstarch. HSD: high sucrose diet.
The expression of the transcription factor PPAR-α which is involved in fatty acid oxidation, is shown in figure 2C.
Weight gainAt the beginning of the study, rats from the four experimental groups were not significantly different. At the end of the study the weight gain in the groups were as follow:
- •
C: 492.66 ± 8.5 g.
- •
HFC: 639.68 ± 14.3 g.
- •
HFCO: 541.54 ± 10.7 g.
- •
HSD: 503.6 ± 12 g.
Rats in the HFC diet gained significantly more weight (P < 0.001) compared with the other groups.
Glucose and insulin levelsThe more of the metabolic abnormalities that the diet produces, the more intrinsically useful the model becomes. Glucose concentrations in all groups at day 0 were <100 mg/dL. By the end of the study all experimental groups (HFC, HSD and HFCO) showed fasting hyperglycemia. The HFC diet had the highest glucose level (158.5 ± 7 mg/dL) compared with the control group (116 ± 2 mg/dL) (P < 0.005).
The HSD (155.16 ± 11.9 mg/dL) (P < 0.005) and the HFCO diet (127.75 ± 3.5 mg/dL) developed also hyperglycemia compared with the C.
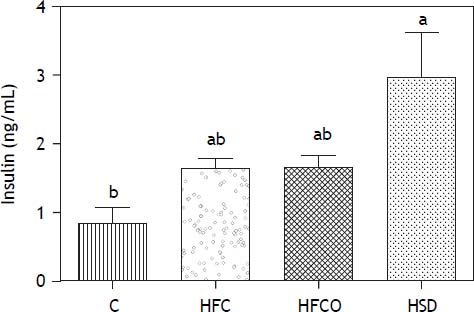
The HSD rats developed significantly higher fasting hyperinsulinemia compared with C on day 90 (Figure 3). HFC and HFCO diets showed higher fasting hyperinsulinemia but it was no significant difference compared to C.
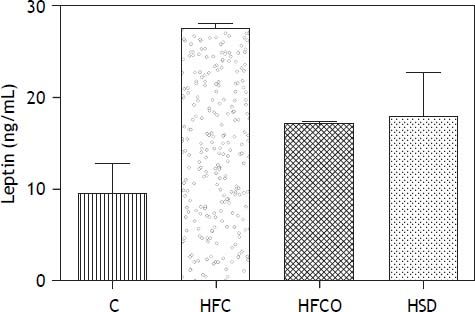
Serum leptin concentrations
Rats in the HFC, HFCO and HSD developed significant hyperleptinemia compared with C. Serum leptin levels were higher in the HFC diet compared with the other groups (p = 0.001) (Figure 4).
Discussion
Different studies have shown that murine biological processes are similar to those in human. When murine models of NAFLD/NASH with either spontaneous or induced genetic mutations are used, many differences are found with the condition encountered at the bedside.5 The development of dietary obesity models in rats mimicking human obesity may help understanding its pathology and evaluate new therapeutic strategies.
To approximate human disease we tested 3 different diets, two with the combination of high-fat and sustained high sucrose consumption and one with high sucrose only and compare them with a control group. This diets resemblance modern occidental diet or “cafeteria diet”. Different diets have induced obesity and fatty liver in rodents, suggesting that “over nutrition” with either carbohydrates, fats or both might play a role in the development of NAFLD.14 Between these 3 models, the HFC with high sucrose consumption demonstrated a higher degree of obesity and NAFLD.
It has been reported that the development of metabolic syndrome in mice is faster with high-fat diets, while rats are more susceptible to develop metabolic alterations with high carbohydrate diets. We chose Wistar rats because this specie does not show susceptibility to develop obesity and diabetes.9
Animals with the HSD diet developed insulin resistance; the implications of peripheral insulin resistance may be seen in the increased expression of lipogenic genes in the liver. The weight increase in HSD diet has been reported in the literature.15–17 Insulin resistance plays an important roll in the development of NAFLD because of the inhibitory effect of this hormone in hepatic TG synthesis.
The development of fatty liver is influenced by several factors such as the increase in de novo synthesis of FFA by the liver with an increased expression of SREBP-1c probably by insulin stimulation, and decrease in the antilipolytic effect of this hormone on adipose tissue and the consumption of fatty acids in diet.18 When there is an increase accumulation of hepatic TG, fatty acids oxidation is inefficient, and there is also an increase in the production and release of VLDL in the circulation, expressed by an increment in serum TG. In the HSD we found an increase in de novo lipid synthesis, fatty acid oxidation and elevated serum TG concentrations.
From the 100% of FFA reaching the liver 60% are produced by lipolytic activity in adipose tissue, 10% of dietary intake and 30% of de novo hepatic synthesis.19,20 The HFC diet rats developed the greatest weight gain, which also correlates with the greater lipid accumulation in the hepatic tissue.
In situations in which the lipogenic rate is increased, as consumption of high fat diets or carbohydrates, hyperglycemia and hyperinsulinemia are associated with changes in the cellular metabolism of lipids, decreasing oxidation and leading to an increase in fatty acid esterification increasing hepatic TG synthesis like the ones seen in HSD and HFC diets.
Rats in the HSD had greater levels of serum TG but less hepatic lipid concentrations than the HFC diet. This is because the increase in hepatic oxidation inhibits TG hepatic accumulation, increasing the systemic release. In the HFC diet oxidation was reduced and greater levels of hepatic steatosis were found.
The development of severe phenotype of fatty liver disease with necroinflammatory changes and a profibrogenic response has been reported with mice fed with trans fats and a high-fructose.21 The absence of necroinflammatory changes and a profibrogenic response in our study may be related to a shorter duration of the diet and the use of rats instead of mice.
Some studies have demonstrated that hepatic iron overload may have a pathogenic role in the onset of liver steatosis and insulin resistance in early stages, with a later decrease to a level similar to that in the control group.8 We did not find hepatic iron deposits possibly related with a longer evaluation period or a different evaluation method.
ConclusionThe HFC diet with combination of high fat and high sucrose is more effective in producing NAFLD compared with a high sucrose diet only. The HFC diet resembles the composition of “fast food” Western diet and administered for 90 days recapitulates features of the metabolic syndrome and NAFLD. This represents a novel small animal model of NAFLD with high similarities to the human condition with an increase in intrahepatic triglycerides associated with the reduction of insulin sensitivity. The results highlight the contribution of different dietary compositions in the development of fatty liver. With continuing improvement of animal models, scientists will be able to developed sufficient knowledge of disease pathogenesis, which will eventually guide to a full understanding of human NAFLD.
Abbreviations- •
C: control chow diet.
- •
FAS: fatty acid synthase.
- •
HFC: high-fat cholesterol.
- •
HFCO: high-fat cornstarch.
- •
HSD: high sucrose diet.
- •
NAFLD: non-alcoholic fatty liver disease.
- •
NASH: non-alcoholic steatohepatitis.
- •
PPAR-α: peroxisome proliferator-activated receptor alpha.
- •
SREBP1: sterol regulatory element-binding protein-1.
This research was supported by the Consejo Nacional de Ciencia y Tecnología (CONACYT). Grant number: 168525 to Gonzalo Torres-Villalobos.
AcknowledgementsThe authors acknowledge Dr. Vicente Sanchez Valle for support in determining leptin.


