


Hepatocellular carcinoma (HCC) represents one of the most common cancers worldwide. A considerable proportion of HCC is caused by cirrhosis related to metabolic dysfunction-associated steatohepatitis (MASH). Due to the increasing prevalence of metabolic syndrome, it is estimated that MASH-related HCC will become the most prevalent etiology of HCC. Currently, HCC screening is based on liver ultrasonography; however, the sensitivity of ultrasonography for early HCC stages in obese patients only reaches 23 %. To date, no studied biomarker shows sufficient efficacy for screening purposes. Nevertheless, the usage of spectroscopic methods offers a new perspective, as its potential use would provide cheap, fast analysis of samples such as blood plasma.
Material and MethodsWe employed a combination of conventional and chiroptical spectroscopic methods to study differences between the blood plasma of obese cirrhotic patients with and without HCC. We included 20 subjects with HCC and 17 without evidence of liver cancer, all of them with body mass index ≥ 30.
ResultsSensitivities and specificities reached values as follows: 0.780 and 0.905 for infrared spectroscopy, 0.700 and 0.767 for Raman spectroscopy, 0.840 and 0.743 for electronic circular dichroism, and 0.805 and 0.923 for Raman optical activity. The final combined classification model based on all spectroscopic methods reached a sensitivity of 0.810 and a specificity of 0.857, with the highest area under the receiver operating characteristic curve among all models (0.961).
ConclusionsWe suggest that this approach can be used effectively as a diagnostic tool in patients who are not examinable by liver ultrasonography.
Clinical trial registrationNCT04221347
Hepatocellular carcinoma (HCC) is the most common primary liver cancer. In 2020, liver cancer was responsible for more than 830,000 deaths and was the third leading cause of cancer-related mortality [1]. Besides liver cirrhosis, chronic hepatitis B infection (HBV) and metabolic dysfunction-associated steatohepatitis (MASH) are frequent risk factors for developing HCC. As the patients at risk of developing HCC are known, their efficient surveillance is important. Despite the advances in diagnostics, liver ultrasonography (USG), which is used as the recommended screening method, possesses significant limitations. First, USG is an expert-dependent method with real-time interpretation; thus, it lacks the possibility of a second read. Secondly, USG sensitivity for early-stage HCC is only around 60 % [2], and, in addition, it has significantly limited sensitivity in obese patients. The sensitivity of USG for identifying liver lesions drops to 23 % in patients with a body mass index (BMI) of more than 30 [3]. Thus, with the increase in the prevalence of metabolic syndrome, a serious need for another screening method for HCC arises. Alpha-fetoprotein (AFP) is considered a specific biomarker for HCC; however, it fails in early diagnostics and surveillance of high-risk groups [4-6].
The concept of liquid biopsy is the goal of the effort to find easily accessible and operator-independent biomarkers of malignancies. Many pathological changes caused by diseases are connected with disruption in the concentration and even in the conformation of biomolecules in blood [7-11]. The authors would like to present a novel approach to HCC diagnostics and possibly to HCC screening using the spectroscopic analysis of blood plasma. These methods have been intensively studied by many authors, but these were conducted often in liver tissue, using only Raman or infrared (IR) spectroscopy, and in many cases without clearly defined parameters of the studied groups [8,11-13]. Our approach comprises highly specialized, structure-sensitive methods of chiroptical spectroscopy (electronic circular dichroism – ECD, Raman optical activity – ROA) combined with conventional infrared and Raman spectroscopy. These methods offer the possibility of rapid analysis of small-volume samples without the need for extensive sample preparation, making them suitable for use in a routine clinical setting. The collected spectra may contain information about all the molecules present within the sample, e.g., their structure and relative concentrations, and these characteristics might be modified by hepatocarcinogenesis. Lastly, the methods of chiroptical spectroscopy are highly sensitive to the spatial structure of molecules, which is essential for their biological function. While ECD detects the absorption difference between left- and right-circularly polarized excitation radiation, the ROA setup typically operates with small intensity differences between the circularly polarized components in the scattered light using linearly polarized incident radiation. Both methods exhibit inherent sensitivity to the 3D structure and conformation of chiral biomolecules, such as peptides, proteins, saccharides, nucleic acids, and others [14-18]. While ECD sensitively reflects the overall conformation of chiral molecules via chromophores, ROA focuses on particular bond types; it thus reflects rather the structural details. In addition to the peptide-backbone bands from regular secondary structure elements, specifically α-helices and β-sheets, the ROA spectra contain distinct bands from loops and turns and, as such, provide information on the tertiary structure. Therefore, the simultaneous use of ECD, ROA, and non-polarized vibrational spectroscopic methods might enhance the reliability of the particular findings. Our team has already published the results of this approach on a cohort of patients with HCC [19]; nevertheless, we did not focus on obese patients, who are highly affected by the reduced sensitivity of USG screening. Therefore, in this study, we present the potential of combining conventional spectroscopies and structure-sensitive chiroptical methods to identify spectral differences between obese cirrhotic patients with HCC and those without HCC. We believe this population is the most threatened by the absence of sensitive and cost-effective methods of HCC screening, and the rapid identification of plasma-based markers is one of the most pressing needs in current hepatology.
2Materials and MethodsPatient recruitment was performed at the Department of Medicine of the First Faculty of Medicine of Charles University and the Military University Hospital in Prague. We enrolled seventeen patients with liver cirrhosis without HCC or dysplastic nodules at the time of examination and within the next twelve months of follow-up, and twenty patients with proven liver cirrhosis with the HCC diagnosis confirmed according to standard diagnostic criteria published by The European Association for the Study of the Liver (EASL) [5]. All patients had a BMI ≥ 30. Basic demographic characteristics of the cohort, along with the exclusion and inclusion criteria, are summarized in Tables 1 and 2, respectively.
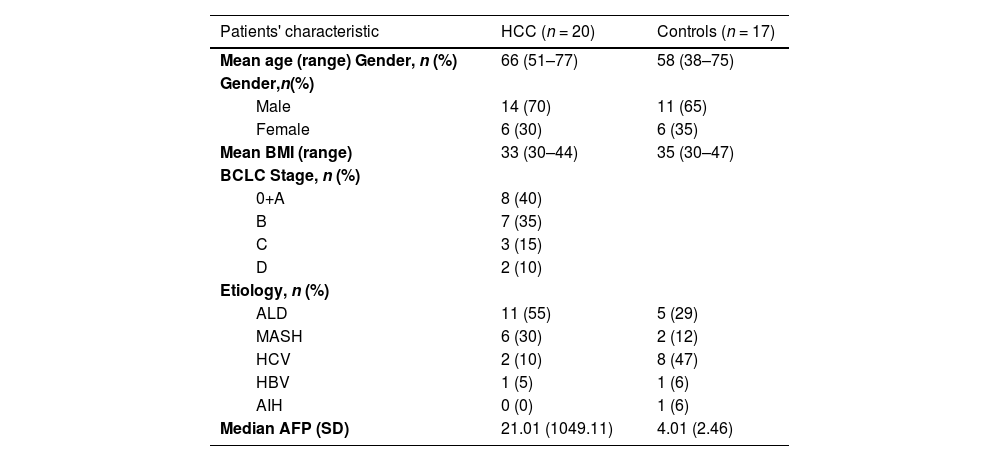
Cohort characteristics.
HCC – hepatocellular carcinoma, BMI – Body Mass Index, BCLC – Barcelona Clinic Liver Cancer classification, ALD – alcoholic liver disease, MASH – metabolic dysfunction-associated steatohepatitis, HCV – chronic hepatitis C infection, HBV – chronic infection with the virus of hepatitis B, AIH – autoimmune hepatitis
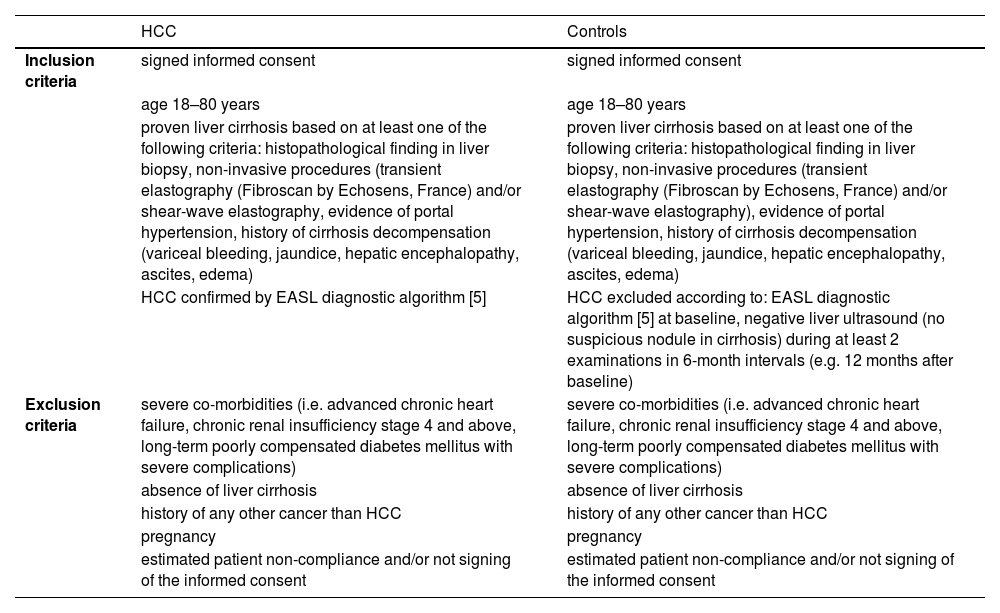
Inclusion and exclusion criteria.
| HCC | Controls | |
|---|---|---|
| Inclusion criteria | signed informed consent | signed informed consent |
| age 18–80 years | age 18–80 years | |
| proven liver cirrhosis based on at least one of the following criteria: histopathological finding in liver biopsy, non-invasive procedures (transient elastography (Fibroscan by Echosens, France) and/or shear-wave elastography, evidence of portal hypertension, history of cirrhosis decompensation (variceal bleeding, jaundice, hepatic encephalopathy, ascites, edema) | proven liver cirrhosis based on at least one of the following criteria: histopathological finding in liver biopsy, non-invasive procedures (transient elastography (Fibroscan by Echosens, France) and/or shear-wave elastography), evidence of portal hypertension, history of cirrhosis decompensation (variceal bleeding, jaundice, hepatic encephalopathy, ascites, edema) | |
| HCC confirmed by EASL diagnostic algorithm [5] | HCC excluded according to: EASL diagnostic algorithm [5] at baseline, negative liver ultrasound (no suspicious nodule in cirrhosis) during at least 2 examinations in 6-month intervals (e.g. 12 months after baseline) | |
| Exclusion criteria | severe co-morbidities (i.e. advanced chronic heart failure, chronic renal insufficiency stage 4 and above, long-term poorly compensated diabetes mellitus with severe complications) | severe co-morbidities (i.e. advanced chronic heart failure, chronic renal insufficiency stage 4 and above, long-term poorly compensated diabetes mellitus with severe complications) |
| absence of liver cirrhosis | absence of liver cirrhosis | |
| history of any other cancer than HCC | history of any other cancer than HCC | |
| pregnancy | pregnancy | |
| estimated patient non-compliance and/or not signing of the informed consent | estimated patient non-compliance and/or not signing of the informed consent |
HCC – hepatocellular carcinoma, EASL – The European Association for the Study of the Liver
We included twenty subjects with diagnosed HCC (70 % males) and seventeen controls (65 % males). All patients met our inclusion criteria and had cirrhosis and BMI ≥ 30. The mean BMI for HCC patients and controls was 33 and 35, respectively. The mean age in the cohort was 64 years (median 67.5 years), with the mean age in HCC patients and controls being 66 and 58 years, respectively (Table 1). The distribution of Barcelona Clinic Liver Cancer (BCLC) stages among the patients was A 40 %, B 35 %, C 15 %, and D 10 %. The etiology of their HCC was 55 % alcohol, 30 % MASH, 10 % chronic hepatitis C infection (HCV), and 5 % HBV. Etiologies in controls were 47 % HCV, 29 % alcohol, 12 % MASH, 6 % HBV, and 6 % autoimmune hepatitis (AIH), as illustrated in Table 1.
2.2Sample preparationThe whole blood was collected into K3EDTA tubes and centrifuged at 1500 × g for 10 min at 25°C. The prepared plasma samples were immediately frozen, transported, and stored at −80°C. Before the analysis, samples were thawed at room temperature and filtered using polyvinylidene difluoride membrane filters (pore sizes of 0.45 µm) to remove any possible interfering particles. Additional method-specific sample preparation is described in the following paragraphs.
2.3Spectroscopic analysisInfrared spectra of blood plasma were collected with the Nicolet 6700 FT-IR spectrometer (Thermo Fisher Scientific, USA) using the technique of attenuated total reflection (ZnSe crystal). For each sample, 512 accumulations were acquired with a resolution of 4 cm−1. Subsequently, the spectra of water and water vapor collected under the same conditions were subtracted from those of blood plasma. The resulting spectra were further pre-processed using the Savitzky-Golay algorithm for smoothing and extended multiplicative scatter correction.
The Raman and ROA spectra were acquired using the ChiralRAMAN-2X spectrometer (BioTools, Inc., USA) equipped with an Opus 2W/MPC6000 laser system (Laser Quantum, UK) with a visible excitation at 532 nm. The sample was placed into a cell with an optical path length of 4 mm. The spectra were collected with a resolution of about 7 cm−1 and a 24-hour acquisition period with the laser power set to 150 mW (in the sample compartment). To reduce the undesired fluorescent background naturally present in the collected blood plasma spectra, we employed an approach previously developed in our laboratory [20,21]. The amount of 10 mg of sodium iodide, acting as a fluorescence quencher, was added to 100 µl of filtered plasma, which was then photobleached at a laser power of 280 mW for 12 h prior to the analysis. In Raman spectra, the remaining distortion of the baseline was corrected using the open-source BubbleFill algorithm [22]. In the case of ROA, the correction was done by subtraction of the estimated background generated by over-smoothing the original spectra using fast Fourier-transform filtering. Subsequently, the spectra were smoothed with the same type of filter. Further, both types of spectra were corrected using the standard normal variate method.
The ECD spectra were collected using the J-815 CD spectrometer (Jasco, Japan). Blood plasma samples were diluted in a 1:3 volume ratio with sterile phosphate-buffered saline (pH 7.4) and analyzed in a cell with an optical path length of 0.01 mm in a spectral range of 185–280 nm, collecting six accumulations with a scanning speed of 50 nm⋅min−1, a response time of 2 s, a data pitch of 0.1 nm and a sensitivity of 100 mdeg. No data pre-processing other than averaging the individual accumulations was performed for the ECD spectra.
2.4Statistical analysisAn open-source software R (Rstudio, caret package) was used for statistical purposes [23]. The partial least squares discriminant analysis (PLS-DA) with a repeated k-fold (5-fold, ten repetitions) cross-validation scheme was selected as a classification algorithm. The models were created with an emphasis on the highest AUROC values, and the final number of components used for the models was optimized using the "oneSE" selection function to minimize the chance of possible overfitting. The selections of the spectral variables included in the final classification models were based on the importance of the variable for the sample classification given by the initial PLS-DA models using whole spectra. The data were mean-centered before the analysis, and when using only the selected variables, they were also auto-scaled. A permutation test was conducted with a thousand repetitions to check for potential overfitting in the classification models. The results of the classification models are presented with corresponding values of sensitivity, specificity, accuracy, and AUROC.
2.5Ethical statementsWritten informed consent was obtained from each patient included in the study, and the study protocol conforms to the ethical guidelines of the 1975 Declaration of Helsinki as reflected in a priori approval by the Ethics Committee of the Military University Hospital in Prague (Statement Number 108/11-68/2017).
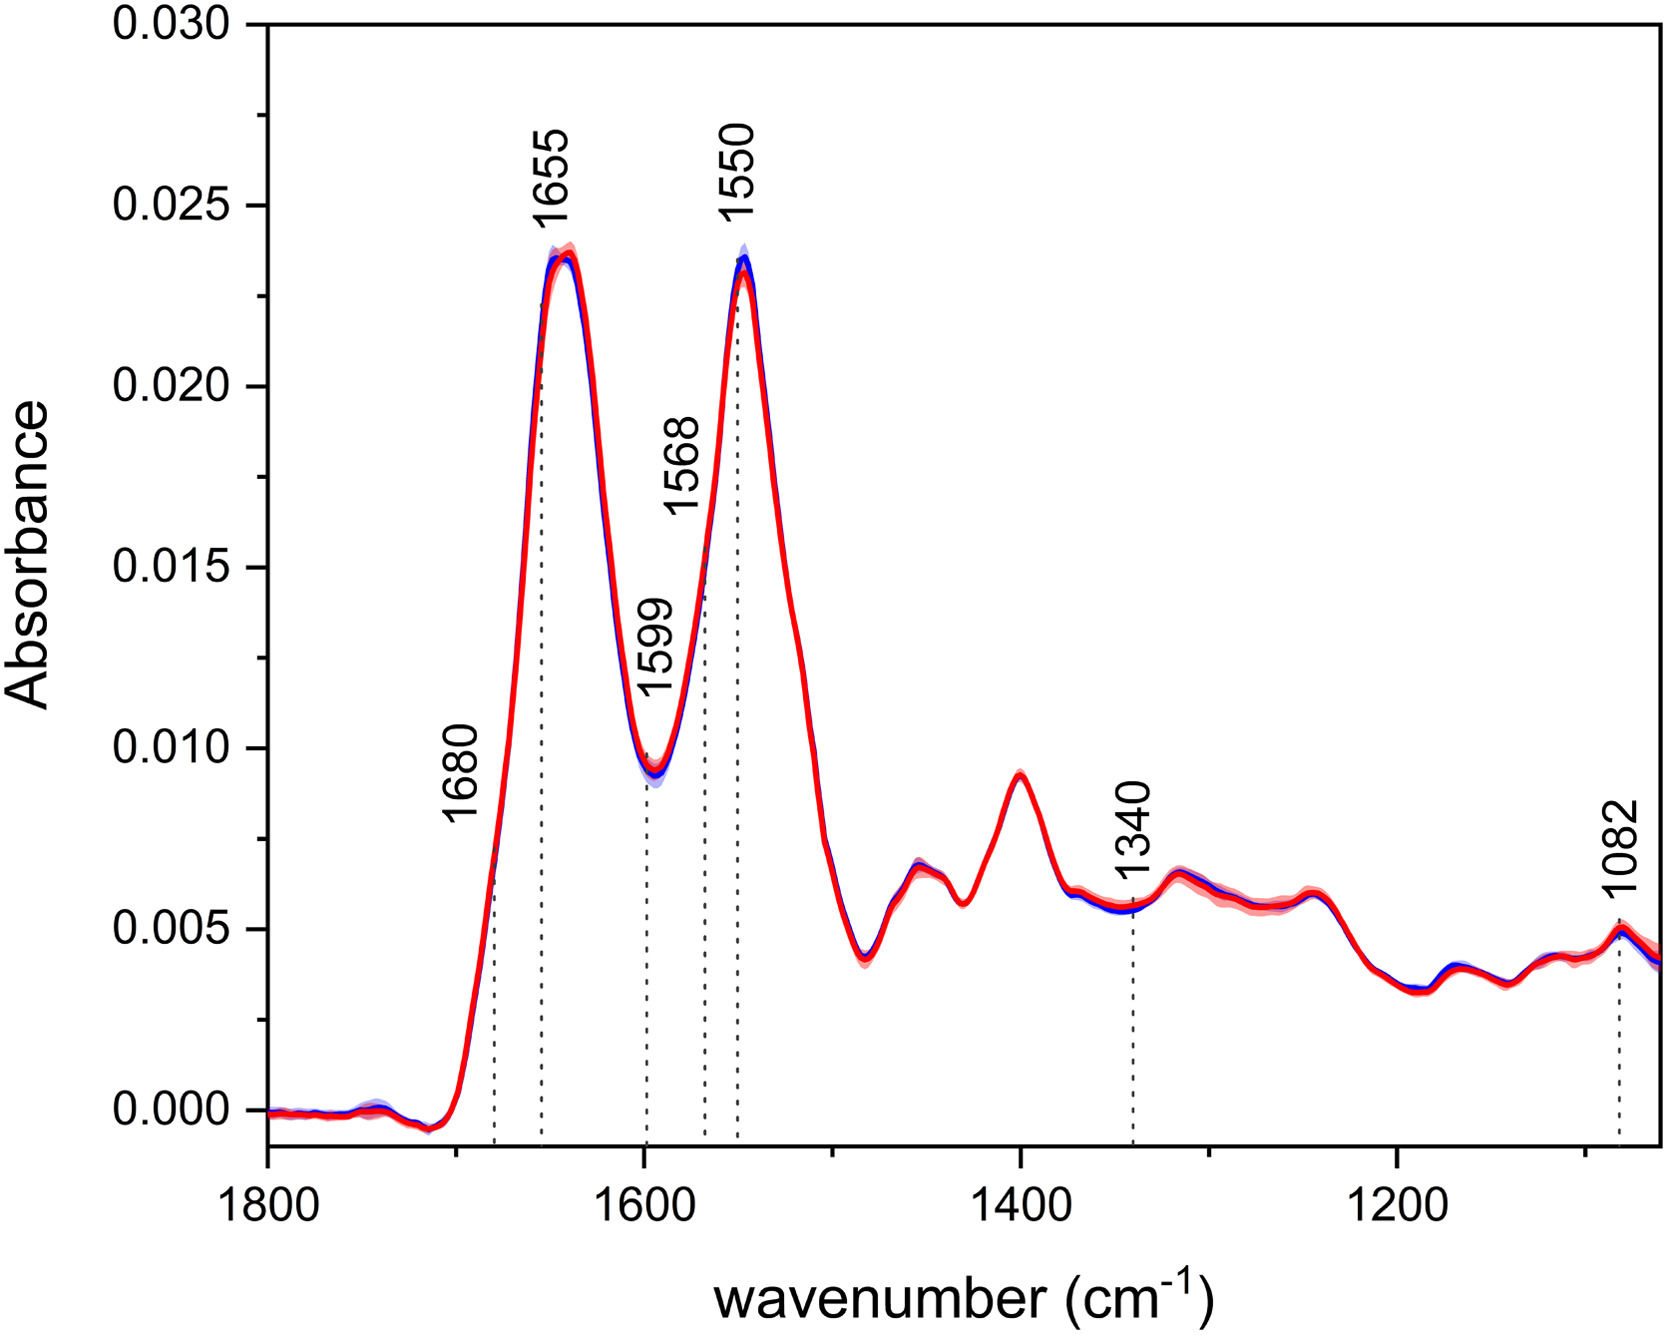
3Results3.1Infrared spectroscopyThe average IR spectra of blood plasma (Fig. 1) depict two intensive bands – the so-called amide I and II, with their maxima at ∼1643 cm−1 and 1547 cm−1, respectively. Those bands are associated with the vibrations of the peptide bonds in proteins, specifically mainly with the CO stretching in the case of amide I and N–H bending and C–N stretching for amide II. Like in our previous studies, there is a visible shift in the amide I region, with the spectra of HCC having the band maxima at lower wavenumbers (1639 cm−1), as opposed to the controls (1647 cm−1) [10,19]. This observation suggests possible changes in the relative proportion of secondary structure motifs of proteins during disease progression, with a greater abundance of β-sheet and less ordered structures in patients. The less intense bands in the IR spectra can be assigned, for example, to the vibrations of phospholipids (∼1740, 1454 cm−1) or nucleic acids (1244, 1082 cm−1).
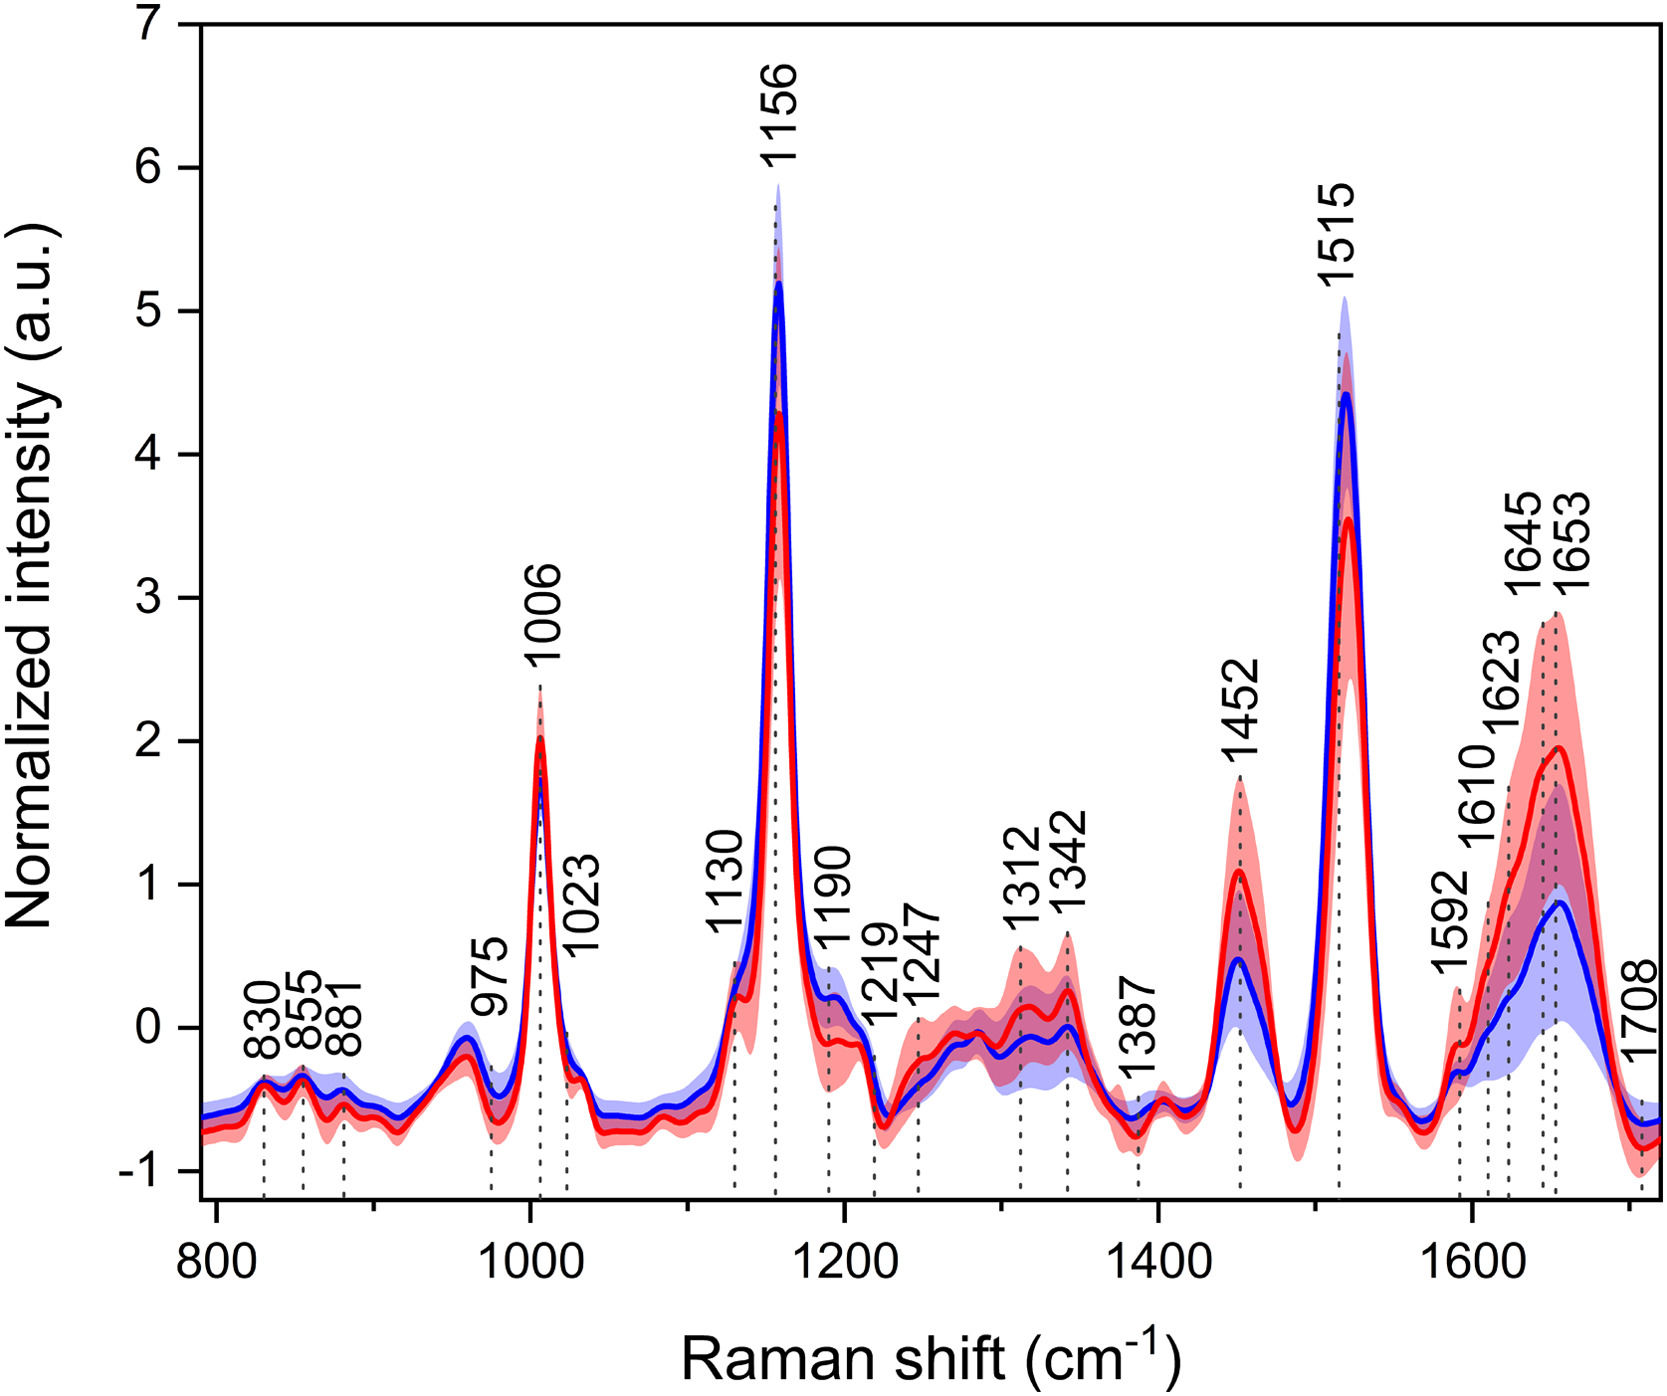
3.2Raman spectroscopy and controls (blue). The shaded areas represent the standard deviation of intensity, and the marked spectral variables were used to build the optimized model.")
The three most intensive bands at ∼1006, 1158, and 1520 cm−1 in the average Raman spectra (Fig. 2) are associated with the vibrations of the carotenoid molecules. Carotenoids exhibit antioxidant properties, and despite being studied for their possible cancer-protective actions, they are not specific markers of any cancer, as they rather point out the general health status of the individual. Although carotenoid levels are diet-dependent, in this particular cohort, it is unlikely that one group of subjects consumed vegetables to a much greater extent than the other. Thus, the intensity changes might suggest a fight against oxidative stress in cancer patients. Another region of particular interest is the extended amide III at 1230–1350 cm−1, which is not greatly observable in infrared spectroscopy. This region comprises C–N stretching, N–H, and C–H bending vibrations of proteins, and similarly to the amide I region in IR spectroscopy, it is sensitive to the secondary structure of proteins. Intensity and band ratio changes might, again, indicate disruptions in protein structures. More differences were observed in bands of, e.g., amino acids (830, 854, 880, 1403 cm−1).
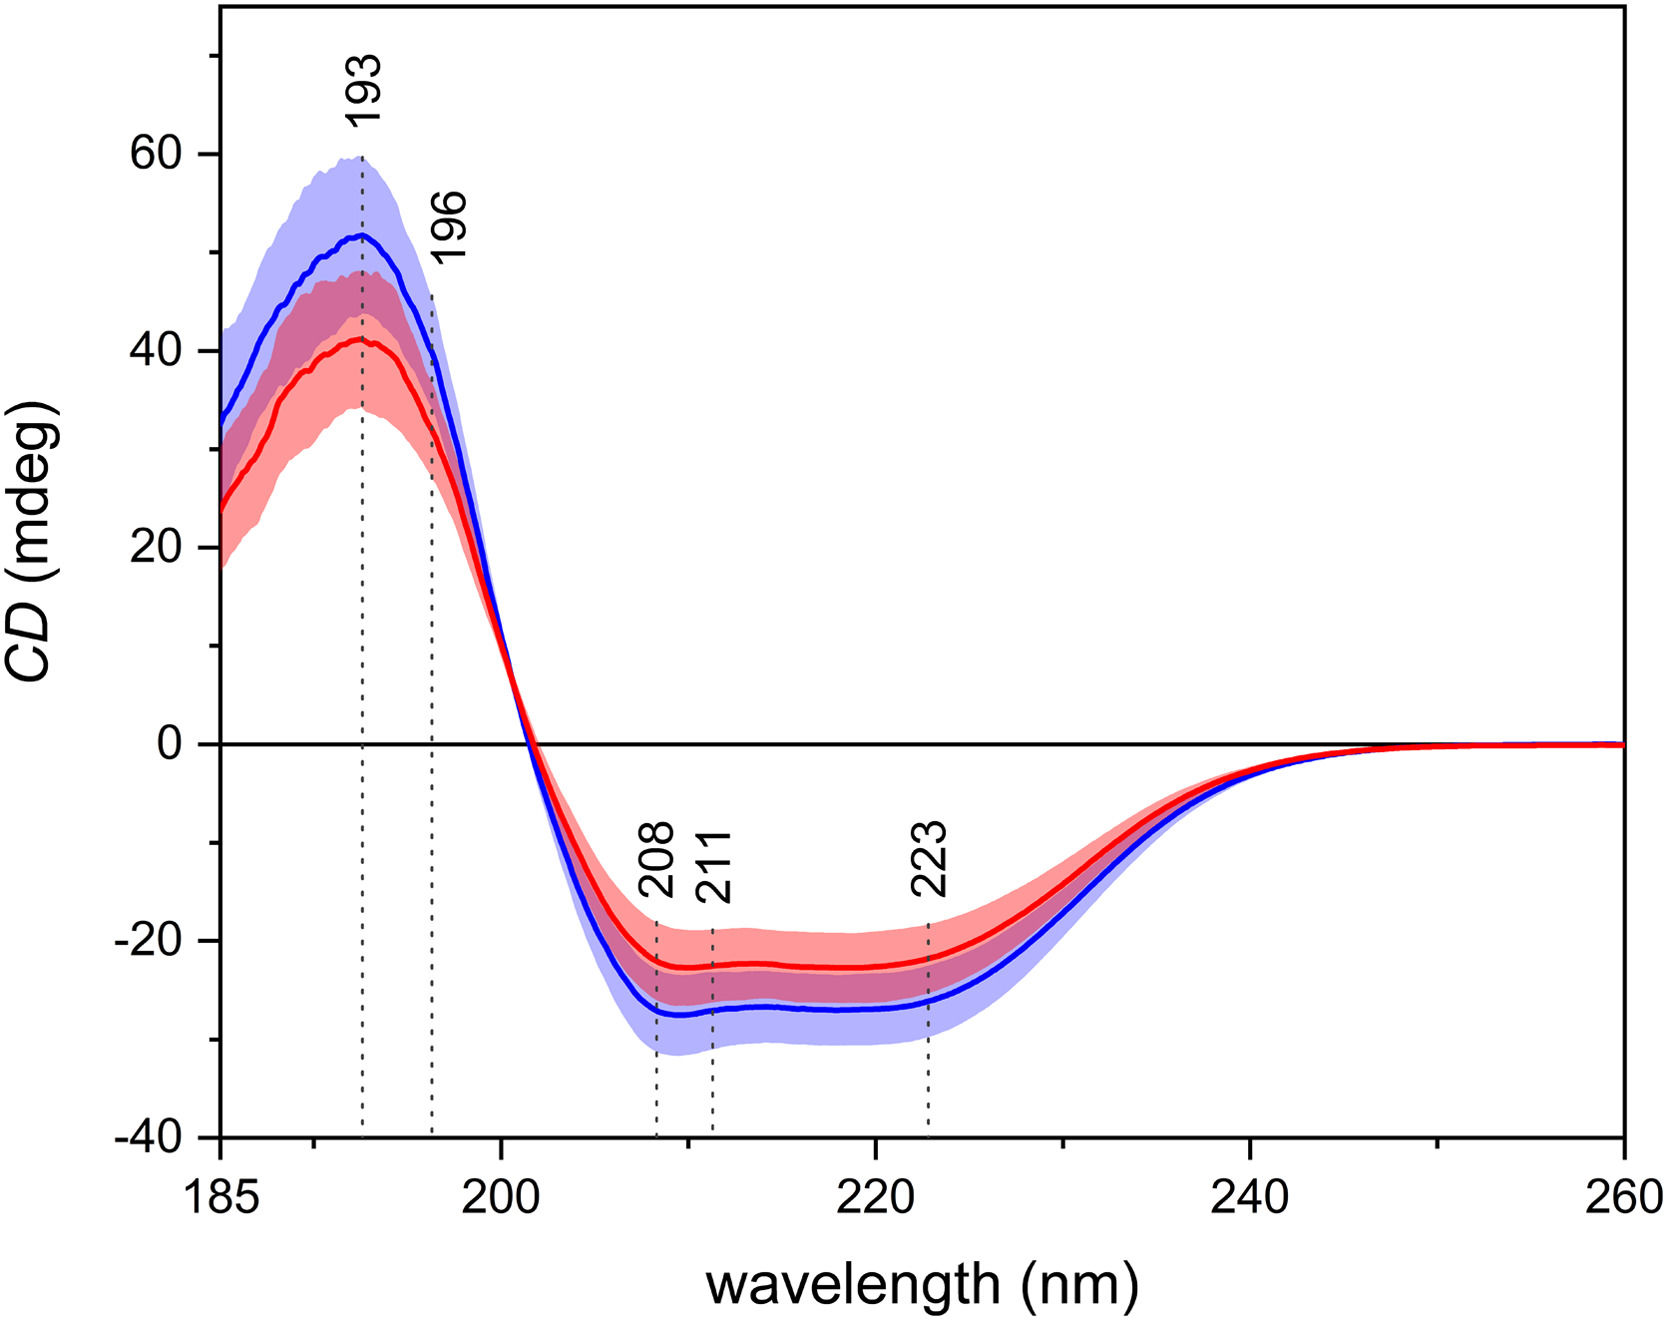
3.3Electronic circular dichroism and controls (blue). The shaded areas represent the standard deviation of intensity, and the marked spectral variables were used to build the optimized model.")
In the average ECD spectra (Fig. 3), one positive and two negative, partially overlapping bands may be observed. Those bands arise from the π–π* and the n–π* electronic transitions of the peptide bond in proteins. ECD is particularly sensitive to the secondary structure of proteins, and the shape of the spectra in Fig. 3 suggests the prevalence of the α-helices, which is in line with the fact that the most abundant protein in blood plasma is human serum albumin, which has a high content of α-helical structure. It is possible to observe an overall decrease in intensity in the spectra of patients with carcinoma.
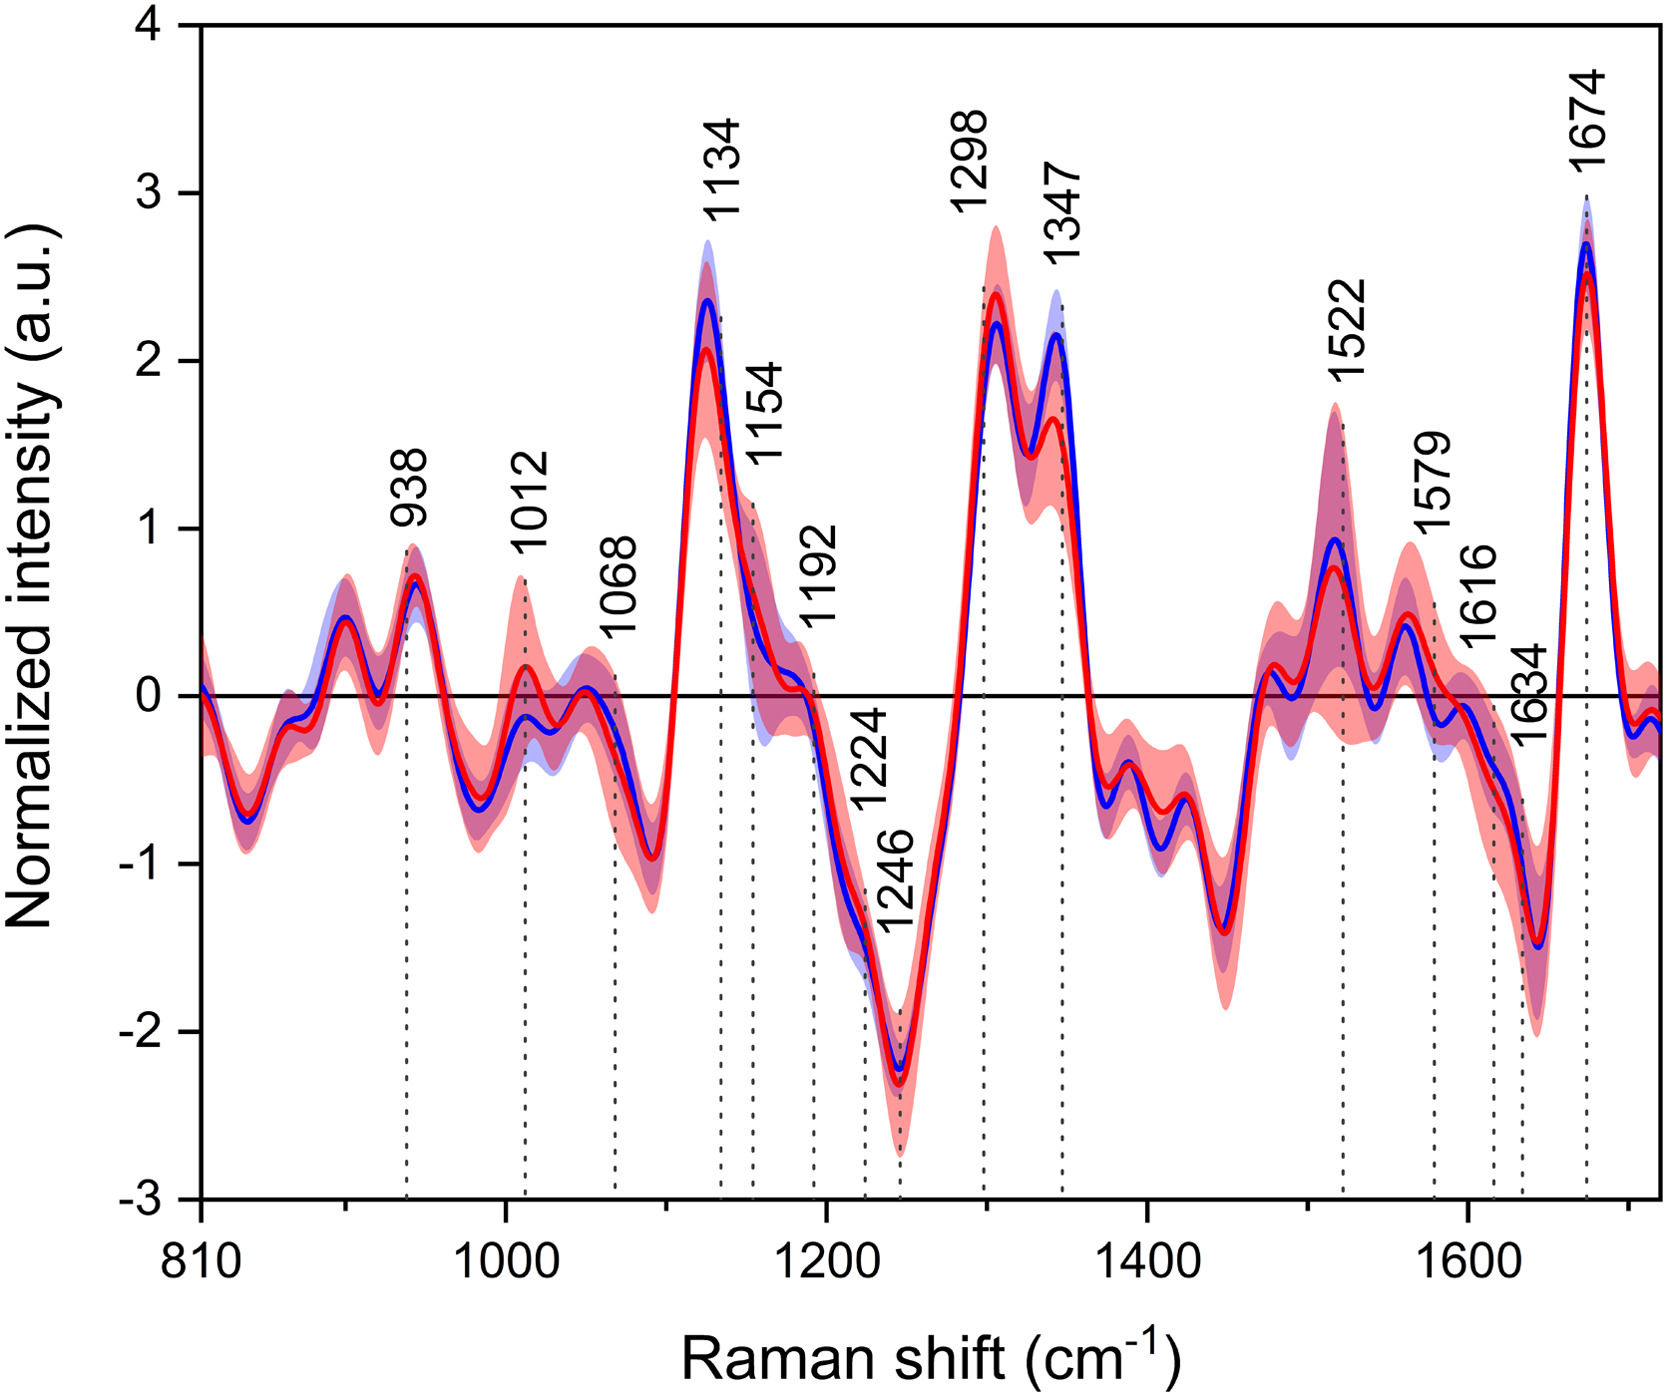
3.4Raman optical activity and controls (blue). The shaded areas represent the standard deviation of intensity, and the marked spectral variables were used to build the optimized model.")
Lastly, in the average ROA spectra (Fig. 4), most of the positive and negative bands can be assigned to the vibrations of proteins. Similarly to the Raman spectra, the region of extended amide III is again of particular interest, as the spectra show different band ratios between the studied groups. Other bands arise as a result of the vibrations of, e.g., amino acids (839, 1185, 1215, 1562 cm−1) or lipids (∼1450 cm−1).
3.5Statistical analysis and controls (blue). The shaded areas represent the standard deviation of intensity, and the marked spectral variables were used to build the optimized model.")
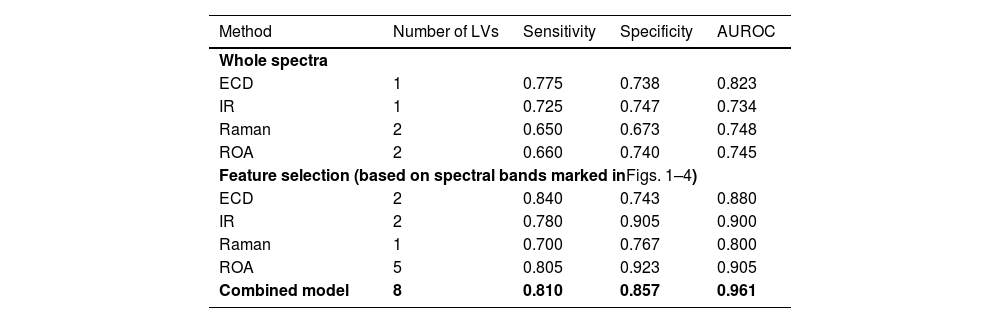
First, we performed statistical analysis of whole spectra from each spectroscopic method to distinguish the HCC and non-HCC sample groups. The classification model based on IR reached a sensitivity and specificity for HCC diagnosis of 0.725 and 0.747, respectively (Table 3), with AUROC of 0.734. In comparison, the Raman model was lacking in specificity (0.673) and sensitivity (0.650) but achieved higher AUROC (0.748). The ECD based model achieved the highest sensitivity among the individual methods (0.775) with a persistent promising specificity of 0.738 and the highest AUROC of 0.823. While using the entire spectra, ROA reached a sensitivity of 0.660 and a specificity of 0.740 with AUROC of 0.745. To sum up, even when using the straightforward approach without any spectral feature selection, every method reached acceptable levels of sensitivity and specificity for the diagnosis of HCC. For plots of the latent variables used in the classification models, please see Supplementary materials.
Spectroscopy performance characteristics.
| Method | Number of LVs | Sensitivity | Specificity | AUROC |
|---|---|---|---|---|
| Whole spectra | ||||
| ECD | 1 | 0.775 | 0.738 | 0.823 |
| IR | 1 | 0.725 | 0.747 | 0.734 |
| Raman | 2 | 0.650 | 0.673 | 0.748 |
| ROA | 2 | 0.660 | 0.740 | 0.745 |
| Feature selection (based on spectral bands marked inFigs. 1–4) | ||||
| ECD | 2 | 0.840 | 0.743 | 0.880 |
| IR | 2 | 0.780 | 0.905 | 0.900 |
| Raman | 1 | 0.700 | 0.767 | 0.800 |
| ROA | 5 | 0.805 | 0.923 | 0.905 |
| Combined model | 8 | 0.810 | 0.857 | 0.961 |
ECD, electronic circular dichroism; IR, infrared spectroscopy; ROA, Raman optical activity; LV, latent variable.
Further, by selecting the most distinctive variables that differed in patients with or without HCC in the initial classification models (marked in Figs. 1–4), we made more targeted models (Table 3). The resulting sensitivities and specificities were superior compared to the previous models in every case and reached values as follows: 0.780 and 0.905 for IR, 0.700 and 0.767 for Raman, 0.840 and 0.743 for ECD, and 0.805 and 0.923 for ROA. The AUROC of the targeted models ranged from 0.800 for Raman to 0.905 for ROA. The increased performance characteristics of the individual models demonstrated the superior performance of the targeted approach. Lastly, we created a combined model of all the above-mentioned methods with the use of only the selected specific variables. This final model (Table 3) reached a sensitivity of 0.810 and a specificity of 0.857, which are not the highest values reached; however, the final model achieved an AUROC of 0.961. This value confirms the superior ability of the combined model. For permutation test plots of the classification models, please see Supplementary materials.
4DiscussionWe are aware of the study limitations, including small sample sizes and heterogeneous study groups. Nevertheless, the results represent a promising proof-of-concept study, which needs to be verified on a larger cohort. The gender distribution of the cohort was with male predominance, as expected. Globally, the HCC incidence is 2-fold to 4-fold higher in males than in females [24]. HCC is also closely related to age in Western countries. Our cohort's mean age at the time of diagnosis was aligned with the currently published results from the USA, which reassures us that our cohort represents a sample of typical HCC patients [25]. Also, the distribution of BCLC stages in our study group was comparable with our long-term observation at our facility. The distribution of the stages in the years 2011–2021 was as follows: A 36 %, B 31 %, C 22 %, and D 11 % [26]. So, we can suggest that, at least in our region, obese patients do not differ in the matter of initial BCLC stages. However, the evidence about initial BCLC staging, particularly in the obese, is lacking, and we can only speculate that it does not differ significantly from the general population. Surprisingly, the most common etiology of HCC in our cohort was alcoholic liver disease (present in more than half of the cases), followed by MASH and HCV. Authors explain this phenomenon by the synergistic effect of obesity and other concurrent chronic liver disease. Nowadays, with the rising prevalence of obesity, the combination of etiologies will often be an accelerating factor of liver fibrogenesis and the risk of HCC [27,28]. Conversely, MASH as an etiological factor of HCC is strongly connected with obesity and will be the leading etiology of HCC [29]. The blood-based tests for early HCC diagnostics in obese subjects are one of the most challenging efforts in current hepatology [30]. We do believe our approach can be a useful tool as it fulfills the parameters of optimal screening tests in this subgroup of patients by providing diagnostics that are fast, low-cost, need no specific reagents, are reproducible, and have minimal risks for patients. On the other hand, spectroscopic methods are not readily available clinically. However, the last limitation is only a minor problem as every single spectroscopic method reached far better sensitivity (80–85 %) in obese patients compared to 23 % of ultrasonography [3,31]. Another option is CT, which reaches a sensitivity of 98 % in obese people with negative ultrasonography; however, the inherited nature of ionized radiation disqualifies it as a surveillance test [3]. Also, the cost of CT is high for a regular surveillance method. In the presented cohort, controls were exclusively monitored at our facility, undergoing regular USG examinations at 6-month intervals. Limited examinations were repeatedly reported in 59 % of cases. In the absence of clear guidelines, we routinely perform MRI in specific scenarios, such as instances of unexpected cirrhosis decompensation, AFP progression even within the normal range, and at times, based on clinician discretion without apparent clinical indications. We acknowledge that this approach is empirical, but the lack of evidence necessitates the exploration of cost-effective strategies for managing this patient subgroup.
Most patients diagnosed with HCC were referred to our center from external hospitals. Intriguingly, 38 % of HCC cases were identified at an early stage (BCLC stage 0+A) through CT or MRI despite previous negative USG results. This underscores the existing inconsistency in clinical decisions, particularly regarding screening protocols for obese, challenging-to-image patients with cirrhosis.
5ConclusionsThe presented data suggest that spectroscopic methods may represent a valuable diagnostic tool for HCC, and their accuracy might reach more than acceptable efficacy for the screening of high-risk obese patients. The high values of sensitivity and specificity obtained in this study are particularly significant as the included patients were confined to those with high BMI, for whom the sensitivity of the currently used USG examination is significantly reduced. Nevertheless, the results need to be verified on a larger dataset.
FundingThis work was supported by the Ministry of Health of the Czech Republic, Grant No. NV19-08-00525. All rights reserved.
CRediT authorship contribution statementPetr Hříbek: Conceptualization, Project administration, Visualization, Writing – original draft, Writing – review & editing. Ondřej Vrtělka: Conceptualization, Data curation, Formal analysis, Investigation, Methodology, Project administration, Software, Validation, Visualization, Writing – original draft, Writing – review & editing. Kateřina Králová: Conceptualization, Data curation, Formal analysis, Investigation, Methodology, Project administration, Software, Validation, Visualization, Writing – original draft, Writing – review & editing. Johana Klasová: Conceptualization, Visualization, Writing – original draft, Writing – review & editing. Markéta Fousková: Conceptualization, Visualization, Writing – original draft, Writing – review & editing. Lucie Habartová: Conceptualization, Writing – original draft, Writing – review & editing. Kristýna Kubíčková: Conceptualization, Project administration, Visualization, Writing – original draft, Writing – review & editing. Tomáš Kupsa: Conceptualization, Project administration, Visualization, Writing – original draft, Writing – review & editing. Tomáš Tůma: Conceptualization, Project administration, Visualization, Writing – original draft, Writing – review & editing. Vladimír Setnička: Conceptualization, Data curation, Formal analysis, Methodology, Project administration, Supervision, Validation, Visualization, Writing – original draft. Petr Urbánek: Conceptualization, Data curation, Formal analysis, Investigation, Methodology, Project administration, Supervision, Validation, Visualization, Writing – original draft.


