


Background. Existing evidence suggests the visceral fat is more metabolically active than subcutaneous fat. We aimed to investigate the value of subcutaneous (SAT) and visceral adipose tissue thickness (VAT) for prediction of gallstone disease (GSD) in general population by focus on gender differences and comparison with body mass index (BMI), waist-to-hip ratio (WHR) and waist-to-height ratio (WHtR).
Material and methods. In this cross-sectional survey, 1,494 subjects (51.4 % men), aged above 50, randomly selected from Golestan Cohort Study residing in Gonbad City, Iran, underwent anthropometric measurements and abdominal ultrasonography.
Results. Prevalence of GSD was 17.8% (95% CI 15.9-19.8). Following adjustment for age and then other potential risk factors, all obesity indices, except for SAT, were associated with GSD in women with the highest odds ratio observed in WHtR (OR 1.52, 95% CI 1.22-1.89). In contrast, WHR was the only associated index in men (OR 1.49, 95% CI 1.08-2.06). The trend of increasing obesity measures across the quartiles with the risk of GSD was significant in subgroups of WHtR and BMI in women and WHR in men. No significant association was found between SAT and GSD in men or women.
Conclusions. The best anthropometric indicators of the risk of GSD may differ by gender. In men, WHR might be the only preferred index to estimate risk of GSD. WHtR, WHR, VAT and BMI are associated with GSD risk in women, although WHtR might better explain this risk. SAT is the poor indicator for identifying subjects with GSD in both genders.
Gallstone disease (GSD) is reported to be a leading cause of inpatient admissions for gastrointestinal disorders, representing a common health problem. It is the most common cause of biliary tract disease in adult age group in the US with an estimated 20-25 million afflicted subjects.1 Several etiologic factors are identified for GSD categorized as modifiable and unmodifiable causes. Some risk factors such as age, being female and gene/ethnicity are unalterable, while other factors like obesity, diet, rapid weight loss and drugs can be modified.2
Obesity as an increasing hazard is a well-established major risk factor for gallstone formation. Increased risk of GSD in obesity has been partly explained by increased cholesterol turnover related to the total body fat. There is a linear relation between cholesterol production and body fat. Increased cholesterol is excreted in the bile which increases the likelihood of precipitation of cholesterol gallstone due to higher concentration of cholesterol relative to the bile acids and phospholipids.3,4
Distribution of body fat is an important determinant for a number of health risks. A series of anthropometric indices were used as obesity measures in different studies to investigate cardiovascular or metabolic risks. Body mass index (BMI) has been most frequently applied in a large number of epidemiological studies as a measure of body fatness.5,6 It has been described by several studies as an indicator of overall obesity with relatively poor correlation with central or abdominal adiposity.7 There are published data indicating the role of central obesity, which is a powerful contributor to development of metabolic syndrome, in gallstone formation without consideration of abdominal fat distribution.8 There are differences between adipose tissue present in the abdominal cavity (visceral fat) and in the subcutaneous areas. Visceral fat is more metabolically active than subcutaneous fat and greatly relates to obesity associated mortality.9,10 The available studies on association of GSD and obesity are limited by either lack of differentiation between visceral and subcutaneous fat, or by determining only symptomatic gallstones as the endpoint. There are limited data in the literature on the anthropometric index that best reflects GSD risk.
In order to assess the association between GSD and different indicators of obesity and investigate the role of abdominal fat distribution, we applied the data from a population-based study and chose five different anthropometric indices as obesity measures including: Visceral adipose tissue thickness (VAT), subcutaneous adipose tissue thickness (SAT), BMI, waist-to-hip ratio (WHR) and waist-to-height ratio (WHtR). We also aimed to determine which index is the strongest indicator for predicting the risk of GSD and whether it is affected by gender differences.
Material and MethodsStudy design and subjectsIn this cross sectional study, subjects from the general population were recruited from a populationbased randomized clinical trial of PolyIran-L (ClinicalTrials.gov identifier: NCT01245608), nested in the Golestan Cohort Study (GCS), evaluating the possible benefits of a fixed-dose combination pill on liver-related variables especially in subjects with presumed NASH among more than 1500 individuals aged +50 who lived in Gonbad City, north eastern Iran.11 All subjects enrolled in PolyIran-L study were invited by telephone. We explained that free physical examination, laboratory tests and abdominal ultrasonography would be performed. Subjects were asked to fast overnight for at least 8 h. A total of 1,533 subjects showed up for enrollment. Data were collected by direct interview and filling a questionnaire for each person. The questionnaire covered demographic details and medical history. The interviewers measured standing height, body weight, waist and hip circumferences. BMI was calculated as weight (in kilogram) divided by square of height (in meter). Waist and hip circumferences were measured by a non-stretchable standard tape at the level of the umbilicus and at the largest posterior extension of the buttocks, respectively. Waist-to-hip ratio (WHR) was defined as waist circumference (in centimeters) divided by hip circumference (in centimeters). Waist-to-height ratio (WHtR) was also determined as waist circumference (in centimeter) divided by height (in centimeter). To estimate the socioeconomic status of participants, wealth score was investigated. This study was carried out between September 2011 and April 2013. Written informed consent was obtained from all participants. The study was approved by the ethics committee of the Digestive Disease Research Institute, Tehran University of Medical Sciences, based on the ethical principles of human research and experimentation.
UltrasonographyUltrasound assessments were performed using an Accuvix XQ ultrasound unit (Medison, Seoul, Korea) equipped with a 3-7 MHz curved-array and a 5-12 MHz linear-array transducers for evaluation of gallbladder, liver and abdominal fat. GSD was determined according to the following criteria: movable echoes in a visible gallbladder lumen with or without acoustic shadow; impeded echoes with acoustic shadow in a visible gallbladder lumen; or invisible gallbladder in a subject with an appropriate scar of cholecystectomy who has reliable history of stone in the removed gall-bladder.12 Presence of fatty liver was inspected according to the ultrasonographic scoring system described by Hamaguchi, et al., which provides high sensitivity (91.7%) and specificity (100%) for the histological diagnosis of fatty liver.13
The technique for measuring abdominal (subcutaneous and visceral) fat thickness has been previously described.14,15 Visceral adipose tissue thickness (VAT; in millimeters) was defined as the distance between the anterior wall of the aorta and the internal face of the rectus abdominis muscle perpendicular to the aorta. Subcutaneous adipose tissue thickness (SAT; in millimeters) was determined as the thickness of the fat tissue between the skin-fat interface and the linea alba, perpendicular to the skin. VAT and SAT measurements were obtained 1 cm above the umbilicus in the supine position without transducer compression.
A single experienced radiologist [AR], who was blinded to demographic and clinical data of subjects performed ultrasound examinations. The coefficient of variation for intra-observer variability of ultra-sound measurements was not significant when 150 subjects were assessed twice with at least one week interval. Of 1,535 enrolled subjects who underwent ultrasound examination, 64 participants were asked for a second ultrasound evaluation in the next few days due to contracted gallbladder or unsatisfactory examination related to bowel gas shadows. The second attempt was successful in 25 subjects and the remaining 39 were excluded. Therefore, a total of 1,494 individuals were available for analysis.
Statistical analysisContinuous and categorical data are presented as mean (SD) and frequency (%), respectively. The difference in variables between subjects with and without GSD was tested using student’s i-test or Pearson’s chi square test, as appropriate. Multivariable logistic regression analysis was performed to compare the association of various indices of obesity with GSD. Since anthropometric indices (continuous) are highly correlated with each other, they were tested separately in multivariable logistic regression models. Results for two multivariate models were presented for each obesity measure as a continuous variable. The first multivariate model was adjusted for age. The second model was further adjusted for other potential variables with a p-value < 0.15 in univariate analysis. Then adjusted OR (95% CI) for each index was calculated. The potential interactions between obesity indices were investigated one by one and then together. We also categorized each index into quartiles and considered the first quartiles as reference to calculate p for trend across the categories. Data were analyzed using STATA software (Version 12, StataCorp., College Station, TX, USA). Two tailed p-value less than 0.05 was considered statistically significant.
ResultsOf 1,494 eligible participants (768 male and 726 female), aged 50-77 years (mean 58.8 ± 6.7 years), 266 (17.8%) had GSD including 177 (11.8%) subjects with ultrasonographic findings of gallstone and 89 (6%) individuals with confirmed history of cholecystectomy. Participants in GSD group were significantly older than subjects without GSD (mean age ± SD, 60.57 ± 7.01 vs. 58.42 ± 6.63 years respectively, p < 0.001). Higher mean (± SD) values of BMI were detected in individuals with GSD in comparison with non-GSD group (29.82 ± 5.32 kg/m2vs. 28.03 ± 4.89 kg/m2, p < 0.001). Subjects with GSD had significantly higher mean (SD) WHR and WHtR values compared to the other group (1.00 ± 0.07 vs. 0.98 ± 0.08, p < 0.001 and 0.65 ± 0.08 vs. 0.61 ± 0.08, p < 0.001, respectively). Mean (SD) values of VAT were significantly higher in individuals with GSD (62.56 ± 23.00 mm vs. 57.27 ± 22.61 mm, p = 0.001), while subjects either with or without GSD did not exhibit significant difference in terms of mean (SD) SAT values (p = 0.07).
Univariate analysisTable 1 shows the relation between GSD and demographics, risk factors of metabolic syndrome and serum liver enzymes levels. On univariate analysis, as shown, mean values of BMI, WHR, WHtR and VAT were significantly higher in women with GSD compared to non-GSD females. In men, significant association was found between higher WHR and WHtR values with GSD, while other obesity indices were not demonstrated to be statistically associated with GSD. GSD was more frequent in elderly subjects in both genders. LDL was associated with significantly higher risk of GSD in women. Meanwhile, none of the markers of metabolic syndrome including serum levels of HDL, triglyceride, FBS and HbA1C affect the prevalence of GSD in men or women. The presence of fatty liver was not associated with occurrence of GSD.
Univariate analysis for association of demographics, obesity indices and other potential risk factors in participants with and without GSD in both genders.
| Women | Men | |||||
|---|---|---|---|---|---|---|
| Risk factors | With GSD (n = 178) | Without GSD (n = 548) | p-value | With GSD (n = 88) | Without GSD (n = 680) | p-value |
| Age (year), mean (SD) | 59.76 (6.7) | 57.71 (6.2) | < 0.001* | 62.19 (7.4) | 58.98 (6.9) | <0.001* |
| Wealth score, mean (SD) | 0.151 (0.20) | 0.162 (0.21) | 0.52 | 0.218 (0.20) | 0.219 (0.19) | 0.96 |
| BMI (kg/m2), mean (SD) | 31.06 (5.3) | 29.57 (5.1) | < 0.001* | 27.31 (4.5) | 26.79 (4.3) | 0.287 |
| WHR, mean (SD) | 1.01 (0.07) | 0.98 (0.09) | 0.003* | 0.99 (0.07) | 0.97 (0.07) | 0.005* |
| WHtR, mean (SD) | 0.68 (0.07) | 0.65 (0.08) | < 0.001* | 0.60 (0.07) | 0.58 (0.07) | 0.038* |
| VAT (mm), mean (SD) | 63.49 (23.1) | 58.08 (22.8) | 0.006* | 60.67 (22.9) | 56.61 (22.4) | 0.114 |
| SAT (mm), mean (SD) | 24.35 (8.6) | 24.62 (8.6) | 0.716 | 19.57 (7.4) | 19.45 (7.7) | 0.892 |
| LDL (mg/dL), mean (SD) | 119.95 (42.1) | 127.04 (38.7) | 0.038* | 112.83 (31.4) | 120.68 (36.1) | 0.052 |
| HDL (mg/dL), mean (SD) | 61.80 (15.7) | 63.72 (15.2) | 0.147 | 54.79 (13.7) | 55.29 (13.0) | 0.740 |
| Triglyceride (mg/dL), mean (SD) | 167.26 (194.8) | 148.48 (79.5) | 0.067 | 136.94 (66.8) | 145.10 (83.5) | 0.379 |
| FBS (mg/dL), mean (SD) | 115.79 (50.0) | 112.77 (47.9) | 0.470 | 112.42 (40.2) | 106.43 (39.1) | 0.178 |
| HbA1C (%), mean (SD) | 2.16 (3.5) | 1.97 (3.4) | 0.504 | 1.88 (3.3) | 1.37 (2.9) | 0.127 |
| ALT (IU/L), mean (SD) | 23.47 (15.11) | 22.05 (14.3) | 0.255 | 21.67 (15.2) | 26.16 (19.9) | 0.042* |
| AST (IU/L), mean (SD) | 22.08 (17.8) | 21.11 (10.2) | 0.346 | 19.70 (6.7) | 22.38 (11.9) | 0.038* |
| ALP (IU/L), mean (SD) | 282.38 (89.0) | 264.96 (89.0) | 0.024* | 243.01 (70.1) | 242.57 (98.8) | 0.967 |
| GGT (IU/L), mean (SD) | 38.26 (44.9) | 28.88 (21.9) | < 0.001* | 36.53 (66.3) | 34.99 (45.7) | 0.778 |
| Fatty liver, N (%) | ||||||
| Yes | 93 (52.3) | 308 (56.2) | 0.356 | 56 (63.6) | 457 (67.2) | 0.503 |
| No | 85 (47.7) | 240 (43.8) | 32 (36.4) | 223 (32.8) | ||
GSD: gallstone disease. BMI: body mass index. WHR: waist to hip ratio. WHtR: waist to height ratio. VAT: visceral adipose tissue thickness. SAT: subcutaneous adipose tissue thickness. LDL: low density lipoprotein. HDL: high density lipoprotein. FBS: fasting blood sugar. HbA1C: glycated hemoglobin. ALT: alanine aminotransferase. AST: aspartate aminotransferase. ALP: alkaline phosphatase. GGT: gamma-glutamyl transaminase.
To determine the independent effect of BMI, WHR, WHtR, VAT and SAT, we performed multi-variate analyses, following demonstration of associations in univariate analysis by including each obesity index in separate models (Table 2). In the final models, following adjustment for age and then other potential risk factors in women, significant associations were found between WHtR, WHR, VAT and BMI and the presence of GSD in order of decreasing odds ratio. SAT did not show statistically significant association with GSD. In men, WHR was the only indicator of obesity that shows significant association with GSD in final model. There were no significant interactions between any of the obesity measures with the occurrence of GSD when they were entered either one-by-one or together into each model.
Association of each continuous index of obesity with GSD in separate multivariable logistic regression in men and women.
| Crude | Adjusted* | Adjusted** | ||||
|---|---|---|---|---|---|---|
| OR | 95% CI | OR | 95% CI | OR | 95% CI | |
| Women | ||||||
| BMI (per 1 kg/m2) | 1.056 | 1.022-1.091 | 1.066 | 1.031-1.102 | 1.068 | 1.032-1.104 |
| WHR (per 0.1) | 1.347 | 1.102-1.648 | 1.291 | 1.051-1.585 | 1.290 | 1.050-1.585 |
| WHtR (per 0.1) | 1.522 | 1.227-1.888 | 1.520 | 1.221-1.891 | 1.525 | 1.225-1.898 |
| VAT (per 1 cm) | 1.107 | 1.029-1.191 | 1.112 | 1.033-1.198 | 1.113 | 1.033-1.199 |
| SAT (per 1 cm) | 0.964 | 0.790-1.176 | 1.018 | 0.831-1.246 | 1.033 | 0.842-1.268 |
| Men | ||||||
| BMI (per 1 kg/m2) | 1.027 | 0.978-1.079 | 1.035 | 0.985-1.087 | 1.027 | 0.975-1.081 |
| WHR (per 0.1) | 1.592 | 1.150-2.202 | 1.496 | 1.083-2.067 | 1.496 | 1.083-2.067 |
| WHtR (per 0.1) | 1.388 | 1.017-1.894 | 1.339 | 0.981-1.827 | 1.330 | 0.971-1.821 |
| VAT (per 1 cm) | 1.083 | 0.982-1.196 | 1.086 | 0.984-1.199 | 1.080 | 0.978-1.194 |
| SAT (per 1 cm) | 1.020 | 0.768-1.355 | 1.038 | 0.781-1.381 | 1.055 | 0.789-1.410 |
GSD: gallstone disease. CI: confidence interval. BMI: body mass index. WHR: waist to hip ratio. WHtR: waist to height ratio. VAT: visceral adipose tissue thickness. SAT: subcutaneous adipose tissue thickness.
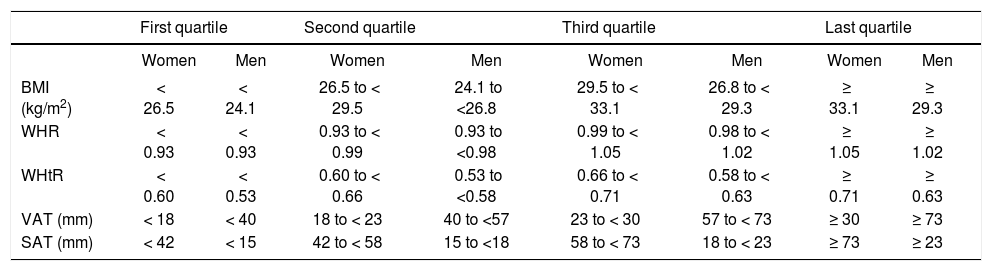
We categorized the five main variables into quartiles (Table 3) in order to increase the ability to compare the associations in another model. As shown in table 4, the only associated categorized index in men was WHR with a significant linear trend (p = 0.019), which revealed an OR of 2.34 (1.19-4.62) in the last quartile. Meanwhile, the trend of increasing obesity measures across the quartiles with the risk of GSD in women was significant in WHtR and BMI subgroups. The strongest OR in female subjects was found in the last subgroup of WHtR; OR = 2.73 (1.57-4.73). None of the sub groups of SAT had significant association with GSD in either male or female. VAT was not associated with GSD in males, while ORs were significant in second and fourth quartiles of VAT in women.
Values of quartiles for categorization of obesity measures in men and women.
| First quartile | Second quartile | Third quartile | Last quartile | |||||
|---|---|---|---|---|---|---|---|---|
| Women | Men | Women | Men | Women | Men | Women | Men | |
| BMI (kg/m2) | < 26.5 | < 24.1 | 26.5 to < 29.5 | 24.1 to <26.8 | 29.5 to < 33.1 | 26.8 to < 29.3 | ≥ 33.1 | ≥ 29.3 |
| WHR | < 0.93 | < 0.93 | 0.93 to < 0.99 | 0.93 to <0.98 | 0.99 to < 1.05 | 0.98 to < 1.02 | ≥ 1.05 | ≥ 1.02 |
| WHtR | < 0.60 | < 0.53 | 0.60 to < 0.66 | 0.53 to <0.58 | 0.66 to < 0.71 | 0.58 to < 0.63 | ≥ 0.71 | ≥ 0.63 |
| VAT (mm) | < 18 | < 40 | 18 to < 23 | 40 to <57 | 23 to < 30 | 57 to < 73 | ≥ 30 | ≥ 73 |
| SAT (mm) | < 42 | < 15 | 42 to < 58 | 15 to <18 | 58 to < 73 | 18 to < 23 | ≥ 73 | ≥ 23 |
BMI: body mass index. WHR: waist to hip ratio. WHtR: waist to height ratio. VAT: visceral adipose tissue thickness. SAT: subcutaneous adipose tissue thickness.
Association of each categorized index of obesity with GSD in separate multivariable logistic regression models in men and women.
| First quartile | Second quartile | Third quartile | Last quartile | ||||||
|---|---|---|---|---|---|---|---|---|---|
| OR | 95% CI | OR | 95% CI | OR | 95% CI | OR | 95% CI | p for trend | |
| Women | |||||||||
| BMI | 1.00 | - | 0.951 | 0.556-1.625 | 1.705 | 1.030-2.823 | 2.250 | 1.370-3.694 | 0.001* |
| WHR | 1.00 | - | 1.538 | 0.902-2.623 | 1.802 | 1.061-3.061 | 1.749 | 1.021-2.994 | 0.137 |
| WHtR | 1.00 | - | 1.865 | 1.040-3.342 | 2.281 | 1.301-3.999 | 2.729 | 1.574-4.730 | 0.004* |
| VAT | 1.00 | - | 1.871 | 1.112-3.149 | 1.505 | 0.891-2.541 | 1.785 | 1.065-2.994 | 0.086 |
| SAT | 1.00 | - | 0.957 | 0.586-1.564 | 1.082 | 0.676-1.731 | 1.174 | 0.716-1.924 | 0.867 |
| Men | |||||||||
| BMI | 1.00 | - | 0.956 | 0.490-1.866 | 1.411 | 0.752-2.649 | 1.120 | 0.584-2.148 | 0.619 |
| WHR | 1.00 | - | 1.841 | 0.913-3.714 | 0.989 | 0.460-2.129 | 2.343 | 1.187-4.623 | 0.019* |
| WHtR | 1.00 | - | 0.997 | 0.466-2.133 | 1.394 | 0.689-2.823 | 1.595 | 0.780-3.261 | 0.400 |
| VAT | 1.00 | - | 1.991 | 0.991-3.999 | 1.369 | 0.659-2.843 | 2.086 | 1.043-4.172 | 0.125 |
| SAT | 1.00 | - | 0.709 | 0.344-1.465 | 0.882 | 0479-1.626 | 1.087 | 0.578-2.046 | 0.664 |
BMI: body mass index. WHR: waist to hip ratio. WHtR: waist to height ratio. VAT: visceral adipose tissue thickness. SAT: subcutaneous adipose tissue thickness.
This study evaluated the association of various obesity indices with occurrence of GSD in both genders. Our data demonstrated that several obesity measures including WHR, WHtR, BMI and VAT are associated with GSD in women, while only WHR was powerful enough for reflecting the presence of GSD in men. Meanwhile, increased subcutaneous fat was not associated with GSD in both genders.
GSD remains a common health concern with a prevalence of 3-10% in Asia which is lower than North America and Europe.16 The estimated higher prevalence of 17.8% in this study might be affected by selection bias of participants’ age (+50 years) in contrast to similar population based surveys, however, it could be partially explained by recent shift toward western dietary habits and lifestyle. Women were affected with GSD almost twofold more frequently than men, which was in agreement with previously published reports.17
Obesity is a well-known risk factor for development of gallstone, which is attributed to the increased hepatic secretion of cholesterol.2 The association between central obesity indices and clinical manifestations of metabolic syndrome has been a subject of growing interest.18 Gallstone formation has also been closely correlated with abdominal (central) obesity, insulin resistance and diabetes mellitus.2 BMI is the most common method for assessment of adiposity, however it is an indicator of lean body mass and does not concern about anatomical distribution of fat. Therefore BMI cannot discriminate between visceral and subcutaneous fat. Individuals with high visceral fat may have normal or high BMI. Waist circumference, waist-to-hip ratio and waist-to-height ratio are more accurately associated with central adiposity. Several studies have investigated the association between these indices of central adiposity and GSD with controversial results. A study by Ruhl, et al.19 on 13,982 adults showed significant correlation between WHR and GSD in both sexes. Furthermore, they found that BMI was associated with GSD in women and not in men and serum leptin concentration was not a better predictor of GSD than anthropometric measures. Although, they investigated different obesity indices including skinfold thickness, waist circumference was considered the only measure representing visceral fat without specific measurement of this value in abdomen. Therefore, lack of significant association between leptin concentration and GSD in their study could be partly explained by lack of separate measurements of visceral and subcutaneous fat considering this fact that leptin concentration is more strongly associated with subcutaneous fat than visceral fat.20 A study on Chinese women showed that both BMI and WHR are associated with GSD. They only evaluated BMI and WHR as indicators of overall and central adiposity excess, respectively, on 8,485 women with self-reported, physician-diagnosed GSD which could be subject to misclassification.21 Tsai, et al.22,23 used waist circumference and waist-to-hip ratio for quantification of central adiposity and they found significant correlation between these anthropometric measures and GSD in either men or women in two separate studies. Their outcomes were restricted to subjects with cholecystectomy or diagnostically confirmed but unremoved symptomatic gallstones, while asymptomatic gallstones, which are obviously more frequent, were not included in both studies.
Our study was consistent with those of Tsai, et al. by demonstrating strong correlation between WHR and GSD in both men and women. The association between BMI and GSD was observed in women and not in men. Fat distribution differs between men and women and men have more lean body mass than women; therefore BMI might not be an accurate measure of adiposity in men. Furthermore, we utilized WHtR which has been suggested as a reliable marker of visceral adiposity.24 To the best of our knowledge, no study has evaluated the association between WHtR and GSD. WHtR was the strongest adiposity index to reflect GSD in women, however no such association was demonstrated in men. Published data have shown that shorter people, even after adjustment for age, may still face higher metabolic risks than taller people with similar waist circumferences.25 Elderly subjects in our study were more prone to have GSD, meanwhile height was negatively correlated with age. Since elderly women had shorter stature than elderly men, we found higher risk of GSD in women with increasing values of WHtR. Consequently, a combination of risk factors for gallstone including being female as a well-known predisposing factor and higher waist circumference and shorter stature as potential risk factors of metabolic syndrome resulted in the highest OR of WHtR for predicting GDS in women in this study.
Ultrasound has been used as an alternative method for direct estimation of visceral adiposity.15,26,27 A study by Stolk, et al.28 showed that measuring visceral fat by ultrasound has stronger correlation with cardiovascular risk factors in comparison with anthropometric measurements. The data of this study did not find strong evidence for the possible association between VAT and the risk of GSD in men. In contrast, VAT was associated with GSD in women, although it showed weaker odds ratio compared to WHtR and WHR.
Several studies have assessed clinical difference between subcutaneous and visceral adiposity.15,29–31 Higher visceral fat is an independent and strong indicator of cardiovascular disease and metabolic syndrome.15 Subcutaneous and visceral fat are different in physiologic functions. Several theories have been proposed for association between visceral adiposity and GSD. Visceral fat has direct hepatic access through portal venous system, thus delivers unesterified fatty acids to liver. Moreover, visceral fat releases several vasoactive substances directly into portal venous system.18 Visceral adipocytes initiate a pro-inflammatory response through macrophage activation and subsequent release of inflammatory cytokines such as TNF-α and Il-6.32 These cytokines have an inhibitory effect on expression of Adiponectin.33 Adiponectin which is released from adipocytes increases insulin sensitivity and fatty acid oxidation, hence having an anti-diabetic and anti-athrogenic effect. Consequently, this process results in insulin resistance and manifestations of metabolic syndrome. Hyperinsulinemia has been linked with GSD through excessive cholesterol release from liver and an inhibitory effect on gallbladder motility.34,35
We noted strengths of this study as followed; first, we used various anthropometric measures to assess risk of GSD. Second, ultrasound was applied as a simple, safe and inexpensive technique for estimation of visceral and subcutaneous fat. Third, study design was based on individuals from general population to reduce selection bias. Fourth, all subjects with either sonographically confirmed gallstone or history of cholecystectomy were enrolled in this study giving a more accurate representation of GSD prevalence. Finally, we evaluated the effect of gender on various obesity measures in predicting GSD.
Findings of the present study should be interpreted with some limitations; first, this study consisted of individuals older than 50-year-old who probably have higher amount of visceral fat in contrast to younger individuals. Second, since this was a cross-sectional study, cause-effect relation cannot be derived from these data. Third, two- or three-dimensional measurement of visceral or subcutaneous fat by cross-sectional imaging can be more representative than ultrasound, although cost-effectiveness of such modalities in a population-based setting is challenging. Fourth, physical activity and dietary habits of participants as putative risk factors of GSD were not investigated in this study.
In conclusion, this study demonstrated that the best anthropometric indicators of the risk of GSD may differ by gender. WHR has a strong correlation with the risk of GSD in both sexes that might be considered the only preferred index to estimate risk of GSD in men. While several adiposity measures including WHtR, WHR, VAT and BMI could predict the risk of GSD in women, WHtR might better explain this risk. SAT did not have any significant relation with presence of GSD. Further studies are helpful for validation of these results.
Conflict of InterestThere is no actual or potential conflict of interest in relation to this manuscript.
Financial SupportThere is no financial support for this study.


