


Liver fibrosis remains a complication derived from a chronic Hepatitis C Virus (HCV) infection even when it is resolved, and no liver antifibrotic drug has been approved. Molecular mechanisms on hepatocytes and activation of hepatic stellate cells (HSCs) play a central role in liver fibrogenesis. To elucidate molecular mechanisms, it is important to analyze pathway regulation during HSC activation and HCV infection.
Materials and MethodsWe evaluate the fibrosis-associated molecular mechanisms during a co-culture of human HSCs (LX2), with human hepatocytes (Huh7) that express HCV NS5A or Core protein. We evaluated LX2 activation induced by HCV NS5A or Core expression in Huh7 cells during co-culture. We determined a fibrosis-associated gene expression profile in Huh7 that expresses NS5A or Core proteins during the co-culture with LX2.
ResultsWe observed that NS5A induced 8.3-, 6.7- and 4-fold changes and that Core induced 6.5-, 1.8-, and 6.2-fold changes in the collagen1, TGFβ1, and timp1 gene expression, respectively, in LX2 co-cultured with transfected Huh7. In addition, NS5A induced the expression of 30 genes while Core induced 41 genes and reduced the expression of 30 genes related to fibrosis in Huh7 cells during the co-culture with LX2, compared to control. The molecular pathways enriched from the gene expression profile were involved in TGFB signaling and the organization of extracellular matrix.
ConclusionsWe demonstrated that HCV NS5A and Core protein expression regulate LX2 activation. NS5A and Core-induced LX2 activation, in turn, regulates diverse fibrosis-related gene expression at different levels in Huh7, which can be further analyzed as potential antifibrotic targets during HCV infection.
Hepatocellular carcinoma (HCC) is considered the main form of liver cancer and the second cause of cancer-related death worldwide, with approximately 140,000 cases attributable to chronic hepatitis C virus (HCV) infection [1]. HCV is a hepatotropic positive-sense RNA virus that encodes a polyprotein that generates different structural and non-structural proteins [2]. Chronic liver damage causes unregulated tissue regeneration, leading to progressive fibrosis. If it is not reverted, this can lead to HCC development [3]. Unfortunately, there are no approved drugs for the treatment of liver fibrosis yet. Liver fibrosis has been characterized by excessive production of the extracellular matrix (ECM) components, including Collagen 1, and/or regulatory molecules of ECM composition, such as some metalloproteinases (MPPs) and tissue inhibitors of metalloproteinase (TIMPs) [4]. Diverse cellular processes during liver damage, including hepatic stellate cells (HSC) activation, can induce liver fibrosis.
On the other hand, HSCs are considered the most important hepatic cells in fibrosis development. HSCs can respond to liver damage through transdifferentiation and activation processes to regenerate damaged tissue through ECM components production. When the damage is chronic, HSCs continue in an activated state in conjunction with the deregulated ECM production [5]. In addition, TGF-β1 has been shown to be one of the major HSCs activation factors, but some HCV proteins such as NS3/4A and Core have been reported to activate HSCs through different pathways [6–8].
It is important to consider how intercellular communication between HSCs and hepatocytes during viral proteins expression could regulate the molecular mechanisms associated with fibrosis development to have a better approximation of the molecular pathogenesis in HCV infection. This can help us to find control points as potential therapeutic targets. In this study, we evaluate the fibrosis-associated molecular mechanisms regulation during a co-culture of human hepatic stellate cells (LX2), with human hepatocytes (Huh7) that express HCV NS5A protein.
2Materials and methods2.1Cell cultureThe human hepatoma cell line Huh-7 (donated by Dr. Koromilas; McGill University, Montreal, Canada) was cultured in Advanced Dulbecco's Modified Eagle Medium supplemented with 2 % fetal bovine serum, 2 mM l-glutamine, 100 U/mL penicillin, 100 µg/mL streptomycin and 1 % nonessential amino acids (All reagent from Gibco, USA). Human hepatic stellate cell line LX-2 (donated by Dr. María Luz Martínez Chantar; Metabolomics laboratory, CIC bioGUNE, Spain) were cultured in Dulbecco's Modified Eagle Medium, supplemented with 2 % fetal bovine serum and 100 U/mL penicillin, and 100 μg/mL streptomycin (All reagent from Gibco, USA). Both cell lines were maintained at 37 °C and 5 % CO2.
2.2Plasmids transfectionThe pNluc-NS5A/HCV was constructed in Mammalian Gene Expression Vector with Nluc as a reporter (Vector Builder, VB200914-1750qfm). The pCore/HCV was constructed in the pcDNA 3.1 (+) (GenScript, USA) expression vector with the sequence of the Core protein of HCV (GenBank: AJ238799.1) (Project ID: U6951CJ230-2). For plasmids transfection, 2 × 10⁵ Huh7 cells were cultured in transwell inserts of 6‑well plates. After 24 h, the transfection was performed using Lipofectamine 3000 (Invitrogen; Thermo Fisher Scientific, USA). For each well, we used 3.75 μL of lipofectamine, 1 μg of each plasmid, and 250 μL of Opti-MEM (Gibco, USA). Since the expression of pCore/HCV is regulated by the T7 promoter, infection of Huh7 cells with Vaccinia virus (VR-2153, strain vTF7-3 [Wr], ATCC, USA) that encodes the T7 RNA polymerase is necessary one hour before the transfection with lipofectamine 3000 as mentioned above.
2.3Transwell co-culture of transfected Huh7 cells with LX-2 cellsHuh7 cells (2 × 10⁵) were plated into the 6-well format cell culture insert with 3 μm pore size (Thermo Fisher Scientific, USA). After 24 h Huh7 were transfected with 1 μg of each plasmid as mentioned above. LX-2 cells (2 × 10⁴) were seeded in 6-well plates in DMEM without FBS 24 h before co-culture with transfected Huh7 cells. Control Huh7 or Huh7 transfected cells were co-cultured with LX-2 for 48 h and 72 h, after which LX-2 and Huh7 cells were harvested for analysis.
2.4RT-qPCRCells were harvested and RNA was isolated with TRIzol reagent (Invitrogen, Thermo Fisher Scientific, USA). We lysed the cells with 400 μL of TRIzol and separated phases with 80 μL of chloroform. RNA was precipitated with 500 μL of isopropanol, washed with ethanol, and resuspended on RNase-free water. Reverse transcription (RT) was performed using 2 μg of total RNA, 250 ng of random primers, 500 μM of dNTP's, Dithiothreitol (DTT) at 10 mM, 40 Units of RNase OUT and the specific buffer of the M-MLV reverse transcriptase (Thermo Fisher Scientific, USA). Followed by this, qPCR was carried out in a StepOnePlus™ (96-well) PCR System (Applied Biosystems, USA) to quantify mRNA relative levels for tgfb1, acta2, col1, timp1, and gapdh, 18 s, and actb as endogenous controls. SYBR-Green PCR Master Mix 2× (Applied Biosystems, USA) was used for qPCR reactions, 200–400 nm of each primer and 50 ng of cDNA. Thermal cycling conditions were 95 °C for 10 min, followed by 40 cycles of 95 °C for 15 s and 60 °C for 60 s.
2.5Western blot analysisLX-2 cells were harvested and lysed in PKR buffer (0.01 M Tris–HCl pH 7.5, 0.02 mM [DTT], 0.2 M MgCl2, 0.05 M KCl, 1 % Triton X-100, and 0.1742 μg Phenylmethanesulfonyl fluoride [PMSF] and a protease inhibitor cocktail) for 20 min at 4 °C (Roche, Germany). The supernatant fractions were transferred to a fresh tube after centrifugation at 13,000 rpm for one minute at 4 °C. Protein concentrations were measured using Protein Assay Dye (Bio-Rad Laboratories, USA). An equal amount of protein from each sample was boiled in standard protein sample buffer and separated via sodium dodecyl sulfate-polyacrylamide gel electrophoresis (SDS-PAGE) and transferred to polyvinylidene difluoride (PVDF) membrane, incubated with different primary antibodies (Col1, TGF-β1, α-SMA or GAPDH) for 16 h at 4 °C. After being washed with TBST buffer (20 mmol/L Tris–HCl pH 7.5, 150 mmol/L NaCl, 0.1 % Tween-20), they were incubated with a secondary antibody (Anti-mouse or Anti-rabbit) for 2 h at room temperature. Membranes were subsequently washed with TBST. Chemiluminescence on the membrane was detected using the SuperSignal West Pico PLUS Chemiluminescent Substrate Kit (Thermo Fisher Scientific, USA) and ChemiDoc XRS system (Bio-Rad Laboratories, USA). Densitometric analyses of protein band intensities were quantified using ImageJ software (version 1.53a; National Institutes of Health, USA).
2.6Nanoluciferase reporter assayTotal protein insolation was used to evaluate the transfection efficiency by nanoluciferase activity as a reporter for NS5A/HCV expression. The nano luciferase activity in each lysate was measured using a NanoLuc assay system (Promega, USA) according to the manufacturer's instructions, an equal amount of protein samples and the mixture of buffer with the substrate (50:1) were placed into a white flat bottom 96-well plate. Relative light units were normalized and reported as RLUs per μg of total protein.
2.7Gene expression by profiler qPCR arrayHuh7 cells co-cultured with LX2 cells were harvested and RNA was isolated with RNeasy Mini Kit according to the manufacturer’s specifications (QIAGEN, Germany). Total RNA (1 μg) was reverse transcribed using the RT2 First Strand Kit (Qiagen, Germany), and qPCR was performed using the human fibrosis PCR array (RT2 Profiler PCR Array PAHS-120Z, Qiagen) according to the manufacturer's instructions. Five housekeeping genes to normalize array data (ACTB, B2M, GAPDH, HPRT1, and RPLP0), and RT and qPCR controls were included in each run. qPCR array data were analyzed using the web-based software RT2 Profiler PCR Array Data Analysis, available at the manufacturer's website. The differentially expressed genes (DEGs) were analyzed by the Enrichr database online tool to obtain Gene Ontology (GO) and Signalling Pathway Enrichment analysis [9].
2.8Statistical analysisThe statistical analysis was executed with Prism software (v9.01, Prism GraphPad, USA). Unpaired Student's T test and one-way ANOVA were applied for comparison between groups. All data in this study were obtained from three individual experiments and presented as mean with SEM and p < 0.05 was considered to indicate a statistically significant difference.
2.9Ethical statementThis was a non-interventional study where ethical approval was not required. We performed in vitro analysis using the hepatocarcinoma cell line (Huh7) and human hepatic stellate cells cell line (LX2). Universidad Autónoma de Nuevo León ethics committee did not require ethical approval for cell lines and non-interventional studies.
3Results3.1HCV NS5A protein expression in Huh7 during co-culture regulates LX2 activationThe NS5A-Huh7 cells' effect on the activation of LX2 was evaluated. Huh7 cells were transfected with pNluc-NS5A/HCV for 24 h and then co-cultured with SFB-free LX2 cells for 48 and 72 h. We determined the transfection efficiency by the increase in NS5A mRNA copy number by qPCR and nanoluciferase activity of pNluc-NS5A/HCV in co-cultured Huh7 cells at different times (Fig. 1A and B). Therefore, we evaluated the relative expression of HSC activation biomarkers in LX2 co-cultured cells. We detected an increase in col1, acta2, and tgfb1 mRNA relative expression in LX2 at 48 and 72 h, whereas timp1 was increased at 48 h compared to the control (Fig. 1C). Furthermore, we observed an increase of collagen1 and TGFβ1 protein level at 48 and 72 h respectively in LX2 co-cultured with NS5A-Huh7 cells (Fig. 1D). Therefore, we analyzed whether the co-culture time of Huh7 with LX2 influenced the expression of activation biomarkers in LX2 cells. Relative mRNA expression revealed that acta2 only increases in control cells upon 72 h of co-culture. On the other hand, col1a1 increases and timp1 decreases at 72 h of co-culture, in LX2 co-cultured with in NS5A-Huh7 cells (Fig. S1A). Similarly, the protein level of collagen1 increases while α-SMA decreases at 72 h of co-culture, in LX2 co-cultured with NS5A-Huh7 cells (Fig. S1B).
 Transfection efficiency by quantitation of Copy number of pNluc-NS5A/HCV mRNA transcript by RT-qPCR in co-cultured Huh7 cells and (B) Protein level of pNluc-NS5A/HCV determined by the nanoluc activity in co-cultured Huh7 cells. (C) mRNA relative expression of col1a1, acta2, tgfb1 and timp1 normalized to gapdh and actb evaluated by RT-qPCR in co-cultured LX2 cells. (D) Protein levels of Collagen1, α-SMA, TGFβ1 and GAPDH by Western blot and densitometry analysis in co-cultured LX2 cells. Graphical results are presented as mean ± SEM of three independent experiments. T-test, ****p < 0.0001, ***p < 0.001, **p < 0.01, *p < 0.05.")
NS5A effect on the regulation of HSC activation biomarkers in LX2 cells. Huh7 cells were transfected with pNluc-NS5A/HCV for 24 h and were co-cultured with LX2 for 48 and 72 h, then HSC activation biomarkers expression was evaluated in LX2 cells. (A) Transfection efficiency by quantitation of Copy number of pNluc-NS5A/HCV mRNA transcript by RT-qPCR in co-cultured Huh7 cells and (B) Protein level of pNluc-NS5A/HCV determined by the nanoluc activity in co-cultured Huh7 cells. (C) mRNA relative expression of col1a1, acta2, tgfb1 and timp1 normalized to gapdh and actb evaluated by RT-qPCR in co-cultured LX2 cells. (D) Protein levels of Collagen1, α-SMA, TGFβ1 and GAPDH by Western blot and densitometry analysis in co-cultured LX2 cells. Graphical results are presented as mean ± SEM of three independent experiments. T-test, ****p < 0.0001, ***p < 0.001, **p < 0.01, *p < 0.05.
Likewise, Huh7 cells were transfected with pCore/HCV for 24 h and co-cultured with SFB-free LX2 cells for 48 and 72 h. We determined the transfection efficiency by measuring HCV-Core mRNA copy number by qPCR and protein expression in co-cultured Core-Huh7 cells at different times (Fig. 2A and B). Therefore, when we evaluated activation biomarkers in LX2 co-cultured cells, we detected an increase in col1, tgfb1 and timp1 mRNA relative expression at 48 h of co-culture with Core-Huh7 cells compared to control (Fig. 2C). However, we did not observe difference of collagen1 and α-SMA protein, while TGFβ-1 was downregulated at 72 h in co-cultured LX2 (Fig. 2D). We analyzed how the co-culture time influenced the expression of activation biomarkers in LX2 cells. Relative mRNA expression revealed that acta2 only increases in control cells at 72 h of co-culture. On the other hand, col1a1, tgfb1, and timp1 increase at 72 h of co-culture, in both, control and Core-Huh7 groups. (Fig. S2A). In addition, protein levels of collagen1, α-SMA, and TGFβ1 have no difference at 72 h of co-culture (Fig. S2B).
 Transfection efficiency by quantitation of Copy number of pCore/HCV mRNA transcript by RT-qPCR and (B) protein level of pCore/HCV determined by Western Blot in co-cultured Huh7 cells. (C) mRNA relative expression of col1a1, acta2, tgfb1 and timp1 normalized to gapdh and actb evaluated by RT-qPCR in co-cultured LX2 cells. (D) Protein levels of Collagen1, α-SMA, TGFβ1 and GAPDH by Western blot and densitometry analysis in co-cultured LX2 cells. Graphical results are presented as mean ± SEM of three independent experiments. T-test, ****p < 0.0001, ***p < 0.001, **p < 0.01, *p < 0.05.")
Core effect on the regulation of HSC activation biomarkers in LX2 cells. Huh7 cells were transfected with pCore/HCV for 24 h and were co-cultured with LX2 for 48 and 72 h, then HSC activation biomarkers expression was evaluated in LX2 cells. (A) Transfection efficiency by quantitation of Copy number of pCore/HCV mRNA transcript by RT-qPCR and (B) protein level of pCore/HCV determined by Western Blot in co-cultured Huh7 cells. (C) mRNA relative expression of col1a1, acta2, tgfb1 and timp1 normalized to gapdh and actb evaluated by RT-qPCR in co-cultured LX2 cells. (D) Protein levels of Collagen1, α-SMA, TGFβ1 and GAPDH by Western blot and densitometry analysis in co-cultured LX2 cells. Graphical results are presented as mean ± SEM of three independent experiments. T-test, ****p < 0.0001, ***p < 0.001, **p < 0.01, *p < 0.05.
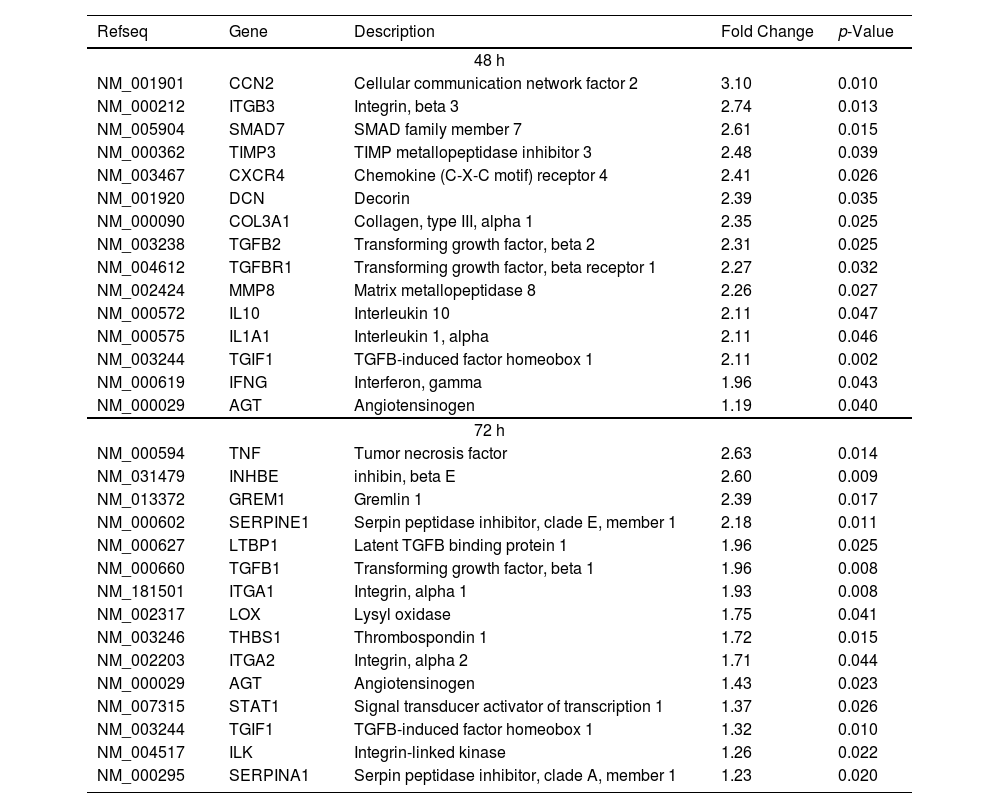
The intercellular communication between hepatocytes and HSCs during NS5A expression may impact or regulate diverse signaling pathways. Therefore, we analyzed the mRNA profiling of 84 fibrosis-related genes in NS5A-Huh7 cells after 48 and 72 h of co-culture with LX2 cells (Fig. 3A). We found overexpression in 15 genes at 48 h of co-culture, including some signal transduction TGFβ superfamily members (DCN, SMAD7, TGFB2, TGFBR1, and TGIF1) and some ECM and cell adhesion molecules (COL3A1, ITGB3, MMP8, and TIMP3) (Fig. 3A). Also, we found 15 overexpressed genes at 72 h of co-culture including ECM and cell adhesion molecules (ITGA1, ITGA2, LOX, SERPINA1 and SERPINE1), and signal transduction TGFβ superfamily members (GREM1, INHBE, LTBP1, TGFB1, TGIF1 and THBS1) (Fig. 3B, Table 1).
![Fibrosis-related genes expression regulation in Huh7 [pNluc-NS5A/HCV] during co-cultured with LX2 cells. Huh7 cells were transfected with pNluc-NS5A/HCV for 24 h and were co-cultured with LX2 for 48 and 72 h, then 84 fibrosis-related genes expression were evaluated in Huh7 cells. (A) Heat map of the relative expression of fibrosis-related genes evaluated by the RT2 Profiler human fibrosis PCR Array. (B) mRNA relative expression of differentially expressed fibrosis-related genes. The dotted line represents the relative mRNA expression of control group. Graphical results are presented as mean ± SEM of three independent experiments. Student T-test, **p < 0.01, *p < 0.05.](https://static.elsevier.es/multimedia/16652681/0000002900000005/v1_202408300521/S1665268124003119/v1_202408300521/en/main.assets/gr3.jpeg?xkr=ue/ImdikoIMrsJoerZ+w997EogCnBdOOD93cPFbanNeKOJqKH5+Za6P+RA5Vq9DlYByYg1V9qqY5v8XuzTOGziiodjj66v0jlpEwEJN+eCTjoT02rGNxKttszavvnGnEtdH8Ffi/Rc8olxcqqwTbK3XttWbeEsuO+scGgBap/qjrLNUty9aRTXpRK/KaVC+64Er2AgrZ8aniI/4J6ntNlLDTlfbQbQcUsWMcNeu00Ak3EvdlGCQ/5qoXYxqnt2keH7+QorlTH2Y6yVqxOrM25w== "Fibrosis-related genes expression regulation in Huh7 [pNluc-NS5A/HCV] during co-cultured with LX2 cells. Huh7 cells were transfected with pNluc-NS5A/HCV for 24 h and were co-cultured with LX2 for 48 and 72 h, then 84 fibrosis-related genes expression were evaluated in Huh7 cells. (A) Heat map of the relative expression of fibrosis-related genes evaluated by the RT2 Profiler human fibrosis PCR Array. (B) mRNA relative expression of differentially expressed fibrosis-related genes. The dotted line represents the relative mRNA expression of control group. Graphical results are presented as mean ± SEM of three independent experiments. Student T-test, **p < 0.01, *p < 0.05.")
Fibrosis-related genes expression regulation in Huh7 [pNluc-NS5A/HCV] during co-cultured with LX2 cells. Huh7 cells were transfected with pNluc-NS5A/HCV for 24 h and were co-cultured with LX2 for 48 and 72 h, then 84 fibrosis-related genes expression were evaluated in Huh7 cells. (A) Heat map of the relative expression of fibrosis-related genes evaluated by the RT2 Profiler human fibrosis PCR Array. (B) mRNA relative expression of differentially expressed fibrosis-related genes. The dotted line represents the relative mRNA expression of control group. Graphical results are presented as mean ± SEM of three independent experiments. Student T-test, **p < 0.01, *p < 0.05.
Differentially expressed fibrosis-related genes in NS5A-Huh7 cells co-cultured with LX2.
| Refseq | Gene | Description | Fold Change | p-Value |
|---|---|---|---|---|
| 48 h | ||||
| NM_001901 | CCN2 | Cellular communication network factor 2 | 3.10 | 0.010 |
| NM_000212 | ITGB3 | Integrin, beta 3 | 2.74 | 0.013 |
| NM_005904 | SMAD7 | SMAD family member 7 | 2.61 | 0.015 |
| NM_000362 | TIMP3 | TIMP metallopeptidase inhibitor 3 | 2.48 | 0.039 |
| NM_003467 | CXCR4 | Chemokine (C-X-C motif) receptor 4 | 2.41 | 0.026 |
| NM_001920 | DCN | Decorin | 2.39 | 0.035 |
| NM_000090 | COL3A1 | Collagen, type III, alpha 1 | 2.35 | 0.025 |
| NM_003238 | TGFB2 | Transforming growth factor, beta 2 | 2.31 | 0.025 |
| NM_004612 | TGFBR1 | Transforming growth factor, beta receptor 1 | 2.27 | 0.032 |
| NM_002424 | MMP8 | Matrix metallopeptidase 8 | 2.26 | 0.027 |
| NM_000572 | IL10 | Interleukin 10 | 2.11 | 0.047 |
| NM_000575 | IL1A1 | Interleukin 1, alpha | 2.11 | 0.046 |
| NM_003244 | TGIF1 | TGFB-induced factor homeobox 1 | 2.11 | 0.002 |
| NM_000619 | IFNG | Interferon, gamma | 1.96 | 0.043 |
| NM_000029 | AGT | Angiotensinogen | 1.19 | 0.040 |
| 72 h | ||||
| NM_000594 | TNF | Tumor necrosis factor | 2.63 | 0.014 |
| NM_031479 | INHBE | inhibin, beta E | 2.60 | 0.009 |
| NM_013372 | GREM1 | Gremlin 1 | 2.39 | 0.017 |
| NM_000602 | SERPINE1 | Serpin peptidase inhibitor, clade E, member 1 | 2.18 | 0.011 |
| NM_000627 | LTBP1 | Latent TGFB binding protein 1 | 1.96 | 0.025 |
| NM_000660 | TGFB1 | Transforming growth factor, beta 1 | 1.96 | 0.008 |
| NM_181501 | ITGA1 | Integrin, alpha 1 | 1.93 | 0.008 |
| NM_002317 | LOX | Lysyl oxidase | 1.75 | 0.041 |
| NM_003246 | THBS1 | Thrombospondin 1 | 1.72 | 0.015 |
| NM_002203 | ITGA2 | Integrin, alpha 2 | 1.71 | 0.044 |
| NM_000029 | AGT | Angiotensinogen | 1.43 | 0.023 |
| NM_007315 | STAT1 | Signal transducer activator of transcription 1 | 1.37 | 0.026 |
| NM_003244 | TGIF1 | TGFB-induced factor homeobox 1 | 1.32 | 0.010 |
| NM_004517 | ILK | Integrin-linked kinase | 1.26 | 0.022 |
| NM_000295 | SERPINA1 | Serpin peptidase inhibitor, clade A, member 1 | 1.23 | 0.020 |
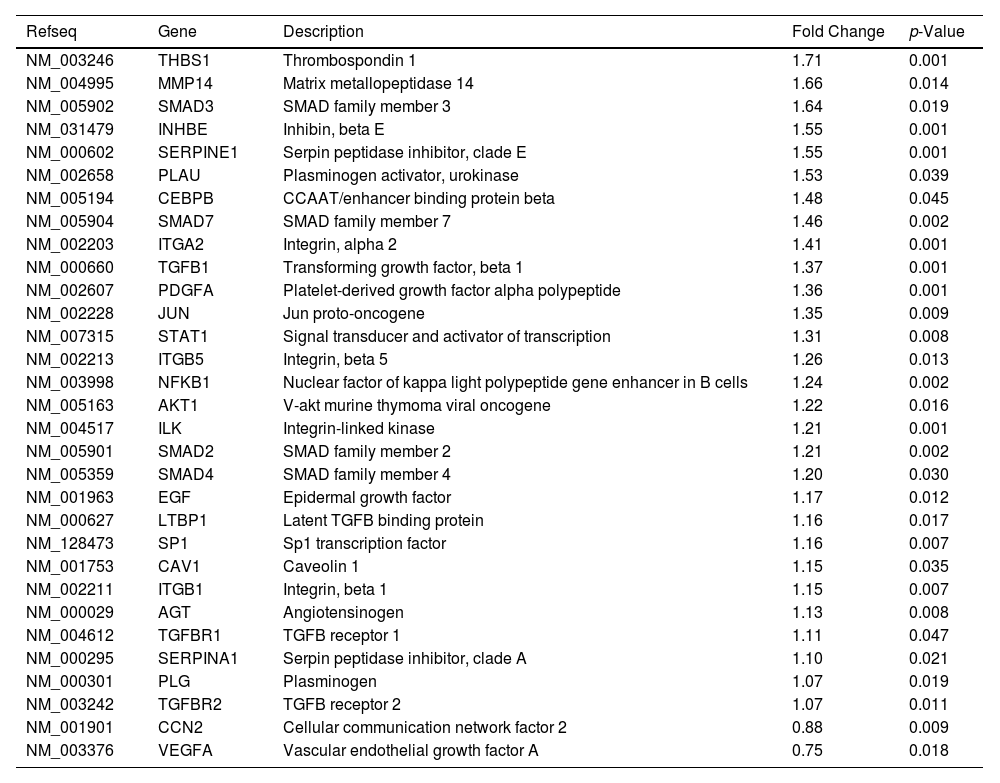
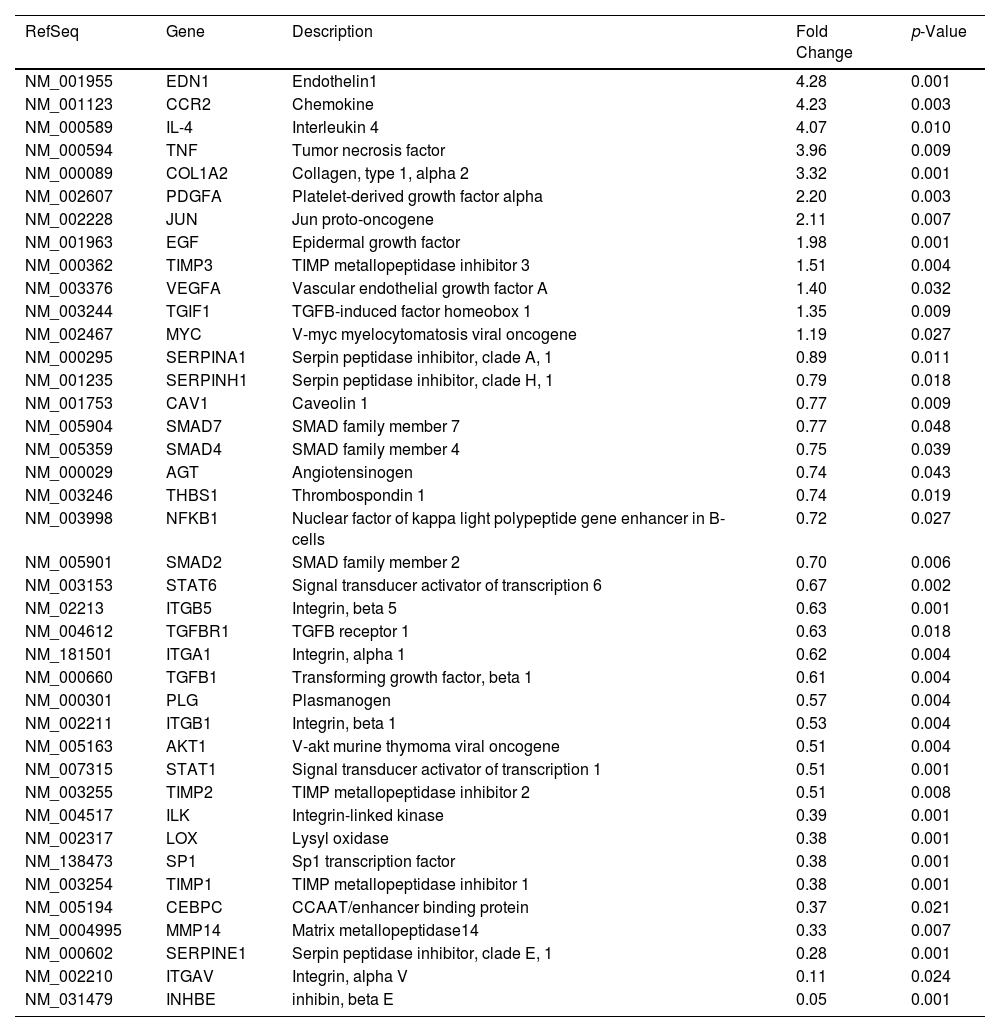
Likewise, we analyzed the mRNA profiling of 84 fibrosis-related genes in Core-Huh7 cells after 48 and 72 h of co-culture with LX2 cells (Fig. 4A). We found the overexpression of 29 genes at 48 h of co-culture, including some signal transduction TGFβ superfamily members (CAV1, SMAD2, TGFB1, TGFBR1 and TGFBR2), some epithelial-mesenchymal transition molecules (AKT, ILK, SERPINE1, ITGB1) and two genes subexpressed (CCN2 and VEGFA) at the same time of co-cultured (Fig 4B, Table 2). Also, we found 11 overexpressed genes like MYC, JUN, IL4, and CCR2, among others at 72 h of co-culture. In addition, we detected 29 subexpressed genes at 72 h of co-culture including diverse ECM and cell adhesion molecules (LOX, MMP14, PLG, SERPINE1, TIMP1, TIMP3, among others), and signal transduction TGFβ superfamily members (CAV1, INHBE, SMAD2, TGFB1, TGFBR1, among others) (Fig 4B, Table 3).
![Fibrosis-related genes expression regulation in Huh7 [pCore/HCV] during co-cultured with LX2 cells. Huh7 cells were transfected with pCore/HCV for 24 h and were co-cultured with LX2 for 48 and 72 h, then 84 fibrosis-related genes expression were evaluated in Huh7 cells. (A) Heat map of the relative expression of fibrosis-related genes evaluated by the RT2 Profiler human fibrosis PCR Array. (B) mRNA relative expression of differentially expressed fibrosis-related genes. The dotted line represents the relative mRNA expression of control group. Graphical results are presented as mean ± SEM of three independent experiments. Student T-test, ##p < 0.0001, #p < 0.001, **p < 0.01, *p < 0.05.](https://static.elsevier.es/multimedia/16652681/0000002900000005/v1_202408300521/S1665268124003119/v1_202408300521/en/main.assets/gr4.jpeg?xkr=ue/ImdikoIMrsJoerZ+w997EogCnBdOOD93cPFbanNeKOJqKH5+Za6P+RA5Vq9DlYByYg1V9qqY5v8XuzTOGziiodjj66v0jlpEwEJN+eCTjoT02rGNxKttszavvnGnEtdH8Ffi/Rc8olxcqqwTbK3XttWbeEsuO+scGgBap/qjrLNUty9aRTXpRK/KaVC+64Er2AgrZ8aniI/4J6ntNlLDTlfbQbQcUsWMcNeu00Ak3EvdlGCQ/5qoXYxqnt2keH7+QorlTH2Y6yVqxOrM25w== "Fibrosis-related genes expression regulation in Huh7 [pCore/HCV] during co-cultured with LX2 cells. Huh7 cells were transfected with pCore/HCV for 24 h and were co-cultured with LX2 for 48 and 72 h, then 84 fibrosis-related genes expression were evaluated in Huh7 cells. (A) Heat map of the relative expression of fibrosis-related genes evaluated by the RT2 Profiler human fibrosis PCR Array. (B) mRNA relative expression of differentially expressed fibrosis-related genes. The dotted line represents the relative mRNA expression of control group. Graphical results are presented as mean ± SEM of three independent experiments. Student T-test, ##p < 0.0001, #p < 0.001, **p < 0.01, *p < 0.05.")
Fibrosis-related genes expression regulation in Huh7 [pCore/HCV] during co-cultured with LX2 cells. Huh7 cells were transfected with pCore/HCV for 24 h and were co-cultured with LX2 for 48 and 72 h, then 84 fibrosis-related genes expression were evaluated in Huh7 cells. (A) Heat map of the relative expression of fibrosis-related genes evaluated by the RT2 Profiler human fibrosis PCR Array. (B) mRNA relative expression of differentially expressed fibrosis-related genes. The dotted line represents the relative mRNA expression of control group. Graphical results are presented as mean ± SEM of three independent experiments. Student T-test, ##p < 0.0001, #p < 0.001, **p < 0.01, *p < 0.05.
Differentially expressed fibrosis-related genes in Core-Huh7 cells co-cultured 48 h with LX2.
| Refseq | Gene | Description | Fold Change | p-Value |
|---|---|---|---|---|
| NM_003246 | THBS1 | Thrombospondin 1 | 1.71 | 0.001 |
| NM_004995 | MMP14 | Matrix metallopeptidase 14 | 1.66 | 0.014 |
| NM_005902 | SMAD3 | SMAD family member 3 | 1.64 | 0.019 |
| NM_031479 | INHBE | Inhibin, beta E | 1.55 | 0.001 |
| NM_000602 | SERPINE1 | Serpin peptidase inhibitor, clade E | 1.55 | 0.001 |
| NM_002658 | PLAU | Plasminogen activator, urokinase | 1.53 | 0.039 |
| NM_005194 | CEBPB | CCAAT/enhancer binding protein beta | 1.48 | 0.045 |
| NM_005904 | SMAD7 | SMAD family member 7 | 1.46 | 0.002 |
| NM_002203 | ITGA2 | Integrin, alpha 2 | 1.41 | 0.001 |
| NM_000660 | TGFB1 | Transforming growth factor, beta 1 | 1.37 | 0.001 |
| NM_002607 | PDGFA | Platelet-derived growth factor alpha polypeptide | 1.36 | 0.001 |
| NM_002228 | JUN | Jun proto-oncogene | 1.35 | 0.009 |
| NM_007315 | STAT1 | Signal transducer and activator of transcription | 1.31 | 0.008 |
| NM_002213 | ITGB5 | Integrin, beta 5 | 1.26 | 0.013 |
| NM_003998 | NFKB1 | Nuclear factor of kappa light polypeptide gene enhancer in B cells | 1.24 | 0.002 |
| NM_005163 | AKT1 | V-akt murine thymoma viral oncogene | 1.22 | 0.016 |
| NM_004517 | ILK | Integrin-linked kinase | 1.21 | 0.001 |
| NM_005901 | SMAD2 | SMAD family member 2 | 1.21 | 0.002 |
| NM_005359 | SMAD4 | SMAD family member 4 | 1.20 | 0.030 |
| NM_001963 | EGF | Epidermal growth factor | 1.17 | 0.012 |
| NM_000627 | LTBP1 | Latent TGFB binding protein | 1.16 | 0.017 |
| NM_128473 | SP1 | Sp1 transcription factor | 1.16 | 0.007 |
| NM_001753 | CAV1 | Caveolin 1 | 1.15 | 0.035 |
| NM_002211 | ITGB1 | Integrin, beta 1 | 1.15 | 0.007 |
| NM_000029 | AGT | Angiotensinogen | 1.13 | 0.008 |
| NM_004612 | TGFBR1 | TGFB receptor 1 | 1.11 | 0.047 |
| NM_000295 | SERPINA1 | Serpin peptidase inhibitor, clade A | 1.10 | 0.021 |
| NM_000301 | PLG | Plasminogen | 1.07 | 0.019 |
| NM_003242 | TGFBR2 | TGFB receptor 2 | 1.07 | 0.011 |
| NM_001901 | CCN2 | Cellular communication network factor 2 | 0.88 | 0.009 |
| NM_003376 | VEGFA | Vascular endothelial growth factor A | 0.75 | 0.018 |
Differentially expressed fibrosis-related genes in Core-Huh7 cells co-cultured 72 h with LX2.
| RefSeq | Gene | Description | Fold Change | p-Value |
|---|---|---|---|---|
| NM_001955 | EDN1 | Endothelin1 | 4.28 | 0.001 |
| NM_001123 | CCR2 | Chemokine | 4.23 | 0.003 |
| NM_000589 | IL-4 | Interleukin 4 | 4.07 | 0.010 |
| NM_000594 | TNF | Tumor necrosis factor | 3.96 | 0.009 |
| NM_000089 | COL1A2 | Collagen, type 1, alpha 2 | 3.32 | 0.001 |
| NM_002607 | PDGFA | Platelet-derived growth factor alpha | 2.20 | 0.003 |
| NM_002228 | JUN | Jun proto-oncogene | 2.11 | 0.007 |
| NM_001963 | EGF | Epidermal growth factor | 1.98 | 0.001 |
| NM_000362 | TIMP3 | TIMP metallopeptidase inhibitor 3 | 1.51 | 0.004 |
| NM_003376 | VEGFA | Vascular endothelial growth factor A | 1.40 | 0.032 |
| NM_003244 | TGIF1 | TGFB-induced factor homeobox 1 | 1.35 | 0.009 |
| NM_002467 | MYC | V-myc myelocytomatosis viral oncogene | 1.19 | 0.027 |
| NM_000295 | SERPINA1 | Serpin peptidase inhibitor, clade A, 1 | 0.89 | 0.011 |
| NM_001235 | SERPINH1 | Serpin peptidase inhibitor, clade H, 1 | 0.79 | 0.018 |
| NM_001753 | CAV1 | Caveolin 1 | 0.77 | 0.009 |
| NM_005904 | SMAD7 | SMAD family member 7 | 0.77 | 0.048 |
| NM_005359 | SMAD4 | SMAD family member 4 | 0.75 | 0.039 |
| NM_000029 | AGT | Angiotensinogen | 0.74 | 0.043 |
| NM_003246 | THBS1 | Thrombospondin 1 | 0.74 | 0.019 |
| NM_003998 | NFKB1 | Nuclear factor of kappa light polypeptide gene enhancer in B-cells | 0.72 | 0.027 |
| NM_005901 | SMAD2 | SMAD family member 2 | 0.70 | 0.006 |
| NM_003153 | STAT6 | Signal transducer activator of transcription 6 | 0.67 | 0.002 |
| NM_02213 | ITGB5 | Integrin, beta 5 | 0.63 | 0.001 |
| NM_004612 | TGFBR1 | TGFB receptor 1 | 0.63 | 0.018 |
| NM_181501 | ITGA1 | Integrin, alpha 1 | 0.62 | 0.004 |
| NM_000660 | TGFB1 | Transforming growth factor, beta 1 | 0.61 | 0.004 |
| NM_000301 | PLG | Plasmanogen | 0.57 | 0.004 |
| NM_002211 | ITGB1 | Integrin, beta 1 | 0.53 | 0.004 |
| NM_005163 | AKT1 | V-akt murine thymoma viral oncogene | 0.51 | 0.004 |
| NM_007315 | STAT1 | Signal transducer activator of transcription 1 | 0.51 | 0.001 |
| NM_003255 | TIMP2 | TIMP metallopeptidase inhibitor 2 | 0.51 | 0.008 |
| NM_004517 | ILK | Integrin-linked kinase | 0.39 | 0.001 |
| NM_002317 | LOX | Lysyl oxidase | 0.38 | 0.001 |
| NM_138473 | SP1 | Sp1 transcription factor | 0.38 | 0.001 |
| NM_003254 | TIMP1 | TIMP metallopeptidase inhibitor 1 | 0.38 | 0.001 |
| NM_005194 | CEBPC | CCAAT/enhancer binding protein | 0.37 | 0.021 |
| NM_0004995 | MMP14 | Matrix metallopeptidase14 | 0.33 | 0.007 |
| NM_000602 | SERPINE1 | Serpin peptidase inhibitor, clade E, 1 | 0.28 | 0.001 |
| NM_002210 | ITGAV | Integrin, alpha V | 0.11 | 0.024 |
| NM_031479 | INHBE | inhibin, beta E | 0.05 | 0.001 |
The DEGs obtained in the qPCR Array were analyzed by Enrichr (maayanlab.cloud/Enrichr/). Significantly enriched signaling pathways analysis reveals that NS5A-Huh7 cells are most associated with TGFβ receptor complex and ECM organization pathways at 48 and 72 h of co-culture with LX2, respectively. Furthermore, GO analysis revealed TGFβ receptor binding and receptor ligand activity as a molecular function enrichment at 48 and 72 h of co-culture, respectively. The Collagen-containing ECM and ECM organization were the cellular component and biological process respectively more associated in both, 48 and 72 h of co-culture (Fig. 5A, C). Additionally, we uploaded our DEGs into the STRING database (string-db.org) to identify relationships and protein-protein interaction networks among our DEGs. Different clusters were obtained depending on the molecular pathway in which each protein participates and its respective interaction and cross-linking with other signaling pathways, like the TGFβ signaling pathway, ECM organization, and serine‑type endopeptidase inhibitor among others (Fig. 5B, D)
 Signaling pathway enrichment and Gene Ontology analysis of the DEGs genes at 48 h. (B) Interaction networks of proteins from DEGs at 48 h of co-culture associated with different cellular functions from STRING analysis. (C) Signaling pathway enrichment and Gene Ontology analysis of the DEGs genes at 72 h. (D) Interaction networks of proteins from DEGs at 72 h of co-culture associated with different cellular functions from STRING analysis.")
Functional Enrichment and protein-protein interaction networks analysis of DEGs induced by HCV NS5A expression in Huh7 co-cultured with LX2 cells. The fibrosis-related genes evaluated by the RT2 Profiler human fibrosis PCR Array were analyzed with Enrichr and STRING bioinformatic platforms. (A) Signaling pathway enrichment and Gene Ontology analysis of the DEGs genes at 48 h. (B) Interaction networks of proteins from DEGs at 48 h of co-culture associated with different cellular functions from STRING analysis. (C) Signaling pathway enrichment and Gene Ontology analysis of the DEGs genes at 72 h. (D) Interaction networks of proteins from DEGs at 72 h of co-culture associated with different cellular functions from STRING analysis.
Enriched signaling pathways analysis reveals that Core-Huh7 cells are most associated with signaling by TGFβ receptor and signaling by interleukins pathways at 48 and 72 h of co-culture with LX2 respectively. Furthermore, GO analysis reveals that binding to TGFβ receptor and cytokine activity as a molecular function enrichment at 48 and 72 h of co-culture respectively. The granule lumen was the cellular component more associated in both, 48 and 72 h of co-culture. The TGFβ receptor pathway and negative regulation of transcription were the biological process enriched at 48 h and 72 h of co-culture respectively (Fig. 6A, C). Additionally, the STRING database showed the protein interaction in molecular pathway associated with over and subexpressed genes, at 48 h of co-culture the TGFβ receptor signaling was induced, while at 72 h, this molecular pathway was associated with subexpressed genes, and the signaling by interleukins was induced by overexpressed genes (Fig. 6B, D).
 Signaling pathway enrichment and Gene Ontology analysis of the DEGs genes at 48 h. (B) Interaction networks of proteins from DEGs at 48 h of co-culture associated with different cellular functions from STRING analysis. (C) Signaling pathway enrichment and Gene Ontology analysis of the DEGs genes at 72 h. (D) Interaction networks of proteins from DEGs at 72 h of co-culture associated with different cellular functions from STRING analysis.")
Functional Enrichment and protein-protein interaction networks analysis of DEGs induced by HCV Core expression in Huh7 co-cultured with LX2 cells. The fibrosis-related genes evaluated by the RT2 Profiler human fibrosis PCR Array were analyzed with Enrichr and STRING bioinformatic platforms. (A) Signaling pathway enrichment and Gene Ontology analysis of the DEGs genes at 48 h. (B) Interaction networks of proteins from DEGs at 48 h of co-culture associated with different cellular functions from STRING analysis. (C) Signaling pathway enrichment and Gene Ontology analysis of the DEGs genes at 72 h. (D) Interaction networks of proteins from DEGs at 72 h of co-culture associated with different cellular functions from STRING analysis.
Chronic Hepatitis C virus infection induces liver damage that causes fibrosis which can be reversible when the disease etiology is resolved. However, despite direct-acting antiviral implementation to resolve HCV infection, in certain cases, fibrosis development continues to occur and unfortunately, no drug has been approved for liver fibrosis treatment yet [10]. Therefore, understanding the molecular mechanisms triggered by HCV infection that induce fibrosis can help to identify therapeutic targets for the development of antifibrotic drugs. Being co-culture of hepatocytes and HSCs one of the processes that promote fibrosis development, this study determined the HCV NS5A and Core protein role in the LX2 cells activation during the co-cultured with transfected Huh7 cells and the effect on the transcriptional regulation of diverse genes related to fibrotic processes.
We determined that pNluc-NS5A/HCV and pCore/HCV induce the activation of LX-2 due to the Collagen1, α-SMA, TGFβ1, and TIMP1 expression. These results agree with studies where the expression of different viral proteins induces the activation of HSCs [6–8,11,12]. It is important to note that transfection efficiency differ for each plasmid and by different co-culture times, resulting in higher expression of NS5A at 48 h, whereas the expression of Core was higher at 72 h of co-culture. This variation may influence the differential expression of the various markers evaluated during the study. However, we also determined whether co-culture hours influence activation by comparing the expression of the markers at 48 h with 72 h of co-culture in each group. The decrease in timp1 expression in NS5A-Huh7 cells at 72 h compared to 48 h and no difference over hours in the control, resulted in no differences when compared NS5A-Huh7 to the control only at 72 h of co-culture. On other hand, in core transfection control, timp1 expression showed an increase after 72 h of co-culture compared to 48 h. Maybe that's why we couldn't detect any difference at 72 h of co-culture when comparing the control with the Core-Huh7 cells. On the other hand, no changes were observed in collagen1 protein level with pCore/HCV or pNluc-NS5A/HCV after 72 h of co-culture compared to the control group, we suggest that there is a post-transcriptional regulation and/or that some metalloproteinases (MMPs) could be activated and hence degrading collagen since it has been determined that HSC can regulate the levels of some MMPs under specific stimuli [13–15]. We observed that pNluc-NS5A/HCV and pCore/HCV seem to counteract α-SMA mRNA overexpression, since an increase in expression is seen at 48 h compared with 72 h of co-culture only in the control group. According to previous research, the expression of acta2 increases during hours of Huh7 co-cultured with LX2 [16]. Finally, we observe that the HSC activation markers increase after 48 h of co-culture with Core-Huh7 cells, on the other hand, transfection with pNluc-NS5A/HCV induces an increase in the activation markers after 72 h of co-culture. Therefore, our results suggest that Core/HCV expression could induce activation of LX2 earlier than pNluc-NS5A/HCV.
Likewise, the fibrotic-related genes regulation was evaluated with the qPCR Array and the expression fold changes of different genes was determined at 48 and 72 h of co-culture. According to the bioinformatic analyses, with pNluc-NS5A/HCV transfection, we found that both at 48 and 72 h of co-culture, pathways such as TGFβ1 and ECM organization were enriched. However, not all overexpressed genes were the same at different times. It should be noted that overexpressed antifibrotic genes such as IFNG and IL10 were obtained only at 48 h of co-culture [17,18]. On the other hand, transfection of pCore/HCV generates subexpression of diverse fibrosis-related genes at 72 h of co-culture. This could be related to the activation state of the LX2 during the co-culture, since at 72 h the activation markers were not increased. It would be necessary to determine the production of non-coding RNAs also to establish their participation in the regulation of the different molecular mechanisms triggered by intercellular communication during co-culture.
In general, we found that SERPINE1, SMAD7, TGFB2, INHBE, LTBP1 and THBS1 genes were overexpressed during co-cultures and this is consistent with gene expression induced by in vitro HCV infection in Huh7.5 cells [19]. Therefore, we can infer that these genes are regulated by the HCV proteins expression. On the other hand, CCN2, COL3A1, TIMP3, LOX, CXCR4, DCN, TGFB2, THBS1 and STAT1 genes that were found overexpressed during co-culture agree with genes overexpressed in cirrhotic liver tissue derived from HCV infection compared to healthy liver tissue [20,21]. Based on this, we suggest that the microenvironment responsible for regulating these genes is generated by the intercellular interaction during the HCV proteins expression. It is important to emphasize the limitation of this work, in our co-culture system we could not consider the role of soluble factors larger than 3 μm, due to the pore size of the transwell membrane. Likewise, it is important to further evaluate the role of exosomes derived from both cell lines that may be present in the conditioned medium of the co-culture, to develop a more comprehensive understanding of the potential molecular mechanisms involved.
5ConclusionsOur results demonstrated that HCV NS5A and Core proteins expression on Huh7 cells, regulates the activation of LX2 cells. Likewise, both cells under the same microenvironment, regulate diverse processes that can induce fibrosis. We highlight the importance of including studies that demonstrate the intercellular communication effect in molecular mechanisms regulation associated with HCV infection. In addition, we identified genetic signatures related to fibrotic pathways derived from the expression of HCV NS5A and Core proteins in Huh7 cells co-cultured with LX2. Although, additional studies are necessary to verify the molecular function of these genes in liver fibrosis in order to be considered as potential antifibrotic targets.
FundingThe study was funded by the Department of Biochemistry and Molecular Medicine and CIIViM, School of Medicine, from Universidad Autónoma de Nuevo León (UANL), Monterrey, Nuevo León 64460, Mexico.
CRediT authorship contribution statementTania G. Heredia-Torres: Funding acquisition, Writing – original draft, Formal analysis. Veronica Alvarado-Martínez: Writing – original draft, Formal analysis. Ana R. Rincón-Sánchez: Writing – review & editing, Funding acquisition, Project administration. Sonia A. Lozano-Sepúlveda: Formal analysis, Writing – original draft, Supervision, Project administration. Kame A. Galán-Huerta: Writing – review & editing, Formal analysis, Project administration. Daniel Arellanos-Soto: Supervision, Writing – review & editing, Project administration. Ana M. Rivas-Estilla: Conceptualization, Methodology, Funding acquisition, Supervision, Project administration.


