


Background and rationale for the study. Limited studies have aimed to define the cut-offs of XL probe (XL cut-offs) for different stages of liver fibrosis, whereas those of M probe (M cut-offs) may not be applicable to XL probe. We aimed to derive appropriate XL cut-offs in overweight patients. Patients with liver stiffness measurement (LSM) by both probes were recruited. XL cut-offs probe for corresponding M cut-offs were derived from an exploratory cohort, and subsequently validated in a subgroup patients also underwent liver biopsy. The diagnostic accuracy of XL cut-offs to diagnose advanced fibrosis was evaluated.
Results. Total 517 patients (63% male, mean age 58) who had reliable LSM by both probes were included in the exploratory cohort. There was a strong correlation between the LSM by M probe (LSM-M) and LSM by XL probe (LSM-XL) (r2 = 0.89, p < 0.001). A decision tree using LSM-XL was learnt to predict the 3 categories of LSM-M (< 6.0kPa, 6.0–11.9kPa and ≥ 12.0kPa), and XL cut-offs at 4.8kPa and 10.7kPa were identified. These cut-offs were subsequently validated in a cohort of 147 patients who underwent liver biopsy. The overall accuracy was 89% among 62 patients whose LSM-XL < 4.8kPa or ≥ 10.7kPa. These cut-offs would have avoided under-staging of fibrosis among patients with body mass index (BMI) > 25–30 kg/m2 but not > 30 kg/m2.
Conclusions. XL cut-offs at 4.8kPa and 10.7kPa were the best estimates of 6.0kPa and 12.0kPa of M probe for patients with BMI > 25–30 kg/m2. Patients with BMI > 30 kg/m2 might use M probe cut-offs for XL probe.
Liver stiffness measurement (LSM) with transient elastography (Fibroscan®; Echosens, Paris, France) has been a widely validated non-invasive assessment of liver fibrosis.1 The prototype of
Fibroscan comes with the regular sized probe, the M probe. At present, the use of LSM by the M probe has been validated with liver histology in at least 40 studies including over 7700 patients all over the world.2 Overall, LSM is an accurate and reproducible method to predict advanced liver fibrosis and cirrhosis in various chronic liver diseases.3–5 However, LSM failure occurs in around 3% of all examinations, and the failure is independently associated body mass index (BMI) > 30 kg/m2 in both Caucasians and Chinese.6,7 Furthermore, unreliable LSM, defined as an interquartile range (IQR)/LSM ratio above 0.30, a success rate below 60% or a number of successful acquisitions less than 10, was reported to be 11.6 to 18.4%.6,7 This limits the use of transient elastography in obese patients, who are more commonly encountered worldwide in the last few decades.8
In order to reduce the unreliable and failed LSM, a new XL probe of transient elastography was developed specifically to cater the special need of the obese patients. This new probe contains a lower frequency and a more sensitive ultrasonic transducer, a deeper focal length, larger vibration amplitude and a higher depth of measurements below the skin surface.9 With this new probe, LSM could be successfully performed in more obese patients compared to M probe. Nonetheless, data concerning the diagnostic accuracy validated with histology, as well as the LSM cut-offs for different stages of liver fibrosis of this new probe were scanty.10–13 In recent histologic series, the median LSM by the XL probe was found to be lower than that by M probe at the same stage of liver fibrosis. In other words, it will be impossible to directly apply the cut-offs of the M probe to predict different stages of liver fibrosis with the XL probe.
The ideal way to derive the LSM cut-offs of the XL probe for various liver diseases is to repeat what has been done for the M probe in the last 5 years. However, it will be very expensive and time consuming to repeat all the liver biopsy series with the XL probe. While the published, well-validated cut-offs of M probe can be applied to normal weight persons of BMI ≤ 25.0 kg/m2.3–5 cut-offs of XL probe for overweight persons are yet to be defined. We hypothesized that there was a relationship between readings of the M and XL probe. In this study, we aimed to derive the appropriate cut-offs of XL probe for corresponding cut-offs of M probe from a large prospective, multicenter cohort of overweight and obese patients who underwent LSM by both probes. This exercise provided guidance to use the well-validated LSM cut-offs of M probe when XL probe is used.
Material and MethodsPatientsPatients with BMI > 25.0 kg/m2 undergoing LSM by transient elastography at the Prince of Wales Hospital, Hong Kong and the University Hospital of Pessac, France were prospectively recruited. We included subjects aged 18 years or above who underwent LSM for the assessment of liver fibrosis. Viral hepatitis B and C infections were diagnosed by positive serology tests for serum hepatitis B surface antigen (HBsAg) and hepatitis C virus antibodies (anti-HCV), respectively. NAFLD was diagnosed by ultrasonography and histology after exclusion of other possible etiologies of fatty liver.14 Autoimmune liver disease and primary biliary cirrhosis were diagnosed with standard serological and histological criteria.15,16 The study protocol was approved by the clinical research ethics committees of the corresponding institute and all patients gave written informed consent before enrolled into the study.
Clinical assessmentComprehensive clinical assessment was performed at the time of transient elastography. Co-morbid illness was recorded with a standard questionnaire. Anthropometric tests included body weight, body height, and waist circumference measurements. BMI was calculated as weight (kg) divided by height (m) squared. Waist circumference was measured at a level midway between the lower rib margin and iliac crest with the tape all around the body in the horizontal position. A venous blood sample was taken for albumin, bilirubin, and alanine aminotransferase (ALT).
Liver stiffness measurement with transient elastographyAll patients underwent LSM by both M and XL probes using transient elastography (FibroScan®) according to the instructions and training provided by the manufacturer. It was performed within one week from (usually one day prior) liver biopsy in the validation cohort. Measurements were performed on the right lobe of the liver through intercostal spaces with the patient lying in dorsal decubitus with the right arm in maximal abduction, and the details of operation has been previously described in details.17 Officially trained operators who had performed at least 50 measurements with both M probe and XL probe prior this study were responsible to perform the LSM. Ten successful acquisitions were performed on each patient, first by M probe, then by XL probe. Both measurements were performed on the same area. The median value represented the liver elastic modulus. The liver stiffness was expressed in kiloPascal (kPa). Only cases with 10 successful acquisitions, an IQR/LSM ≤ 0.30 and a success rate over 60% were included in the final analysis.
Histologic assessmentIn this study, a subgroup of patients underwent liver biopsy served as the validation cohort using liver histology as the gold standard for evaluating the diagnostic accuracy of the cut-offs of XL probe. Percutaneous liver biopsy was performed using the 16G Temno or Menghini needle. Liver biopsy specimens were fixed in formalin and embedded in paraffin. Liver histology was assessed by experienced histopathologists (B.L.B., P.C.C.) who were blinded to the clinical data. The length of each liver biopsy specimen (in millimeters) and the number of portal tract was recorded. Liver specimens shorter than 15 mm in length and those with less than 6 portal tracts were excluded. For patients with viral hepatitis, liver fibrosis was evaluated semi-quantitatively according to the METAVIR scoring system: F0, no fibrosis; F1, portal fibrosis without septa; F2, portal fibrosis and few septa; F3, numerous septa without cirrhosis; and F4, cirrhosis.18 The histologic grading and staging of NAFLD fibrosis was staged from 0 to 4 (stage 0, absence of fibrosis; stage 1, pericellular or portal; stage 2, pericellular and portal/ periportal; stage 3, septal or bridging fibrosis; and stage 4, cirrhosis) following the Brunt’s criteria.19
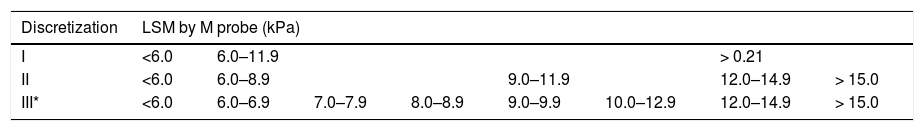
Development of cut-offs of XL probe and statistical analysisStatistical tests were performed using the Statistical Package for Social Sciences version 19.0. Continuous variables were expressed as mean ± standard deviation or median (range or IQR) as appropriate. Quantitative variables between groups were compared by unpaired t test or Mann-Whitney U test. Categorical variables were compared by chi-squared test or Fisher’s exact test. Correlations between different variables were calculated by determination coefficient (r2). Linear regression analysis was used to derive a formula demonstrating the relationship between the LSM by M probe (LSM-M) and that by XL probe (LSM-XL). We subsequently discretized LSM-M, and use LSM-XL to predict the discretized M probe ranges by using the classification and regression tree (decision tree) algorithm, by building of classification and regression trees for predicting continuous dependent variables (regression) and categorical predictor variables (classification).20 Three discretizations with different granularity have been tested (Table 1). The basic discretization was based on LSM-M of 6.0 kPa and 12.0 kPa, which corresponded to approximate round-off values to exclude and confirm advanced liver fibrosis in different liver diseases, respectively.2,4,5 For each discretization, a decision tree using LSM-XL was learnt to perform the prediction.20 In order to avoid over-fitting, a 10-fold cross-validation was used in learning each of the decision trees.21 The prediction performances were presented in the form of confusion matrices and the accuracy was evaluated as the proportion of correct predictions.22 All statistical tests were two-sided. Significance was taken as P < 0.05.
Three discretizations of the liver stiffness measurement by M probe value into ranges with different granularity.
| Discretization | LSM by M probe (kPa) | |||||||
|---|---|---|---|---|---|---|---|---|
| I | <6.0 | 6.0–11.9 | > 0.21 | |||||
| II | <6.0 | 6.0–8.9 | 9.0–11.9 | 12.0–14.9 | > 15.0 | |||
| III* | <6.0 | 6.0–6.9 | 7.0–7.9 | 8.0–8.9 | 9.0–9.9 | 10.0–12.9 | 12.0–14.9 | > 15.0 |
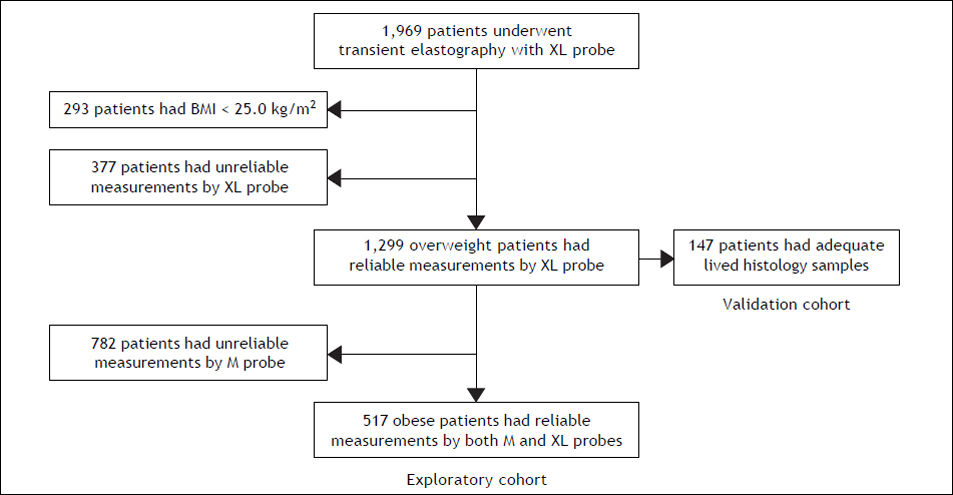
From September 2009 to March 2011, 1969 (1882 French and 87 Chinese) patients with chronic liver disease underwent LSM using M and XL probes. We excluded 293 patients of BMI < 25.0 kg/m2, and 377 patients who had unreliable measurements by XL probe (successful acquisitions were less than 10 and/ or IQR/LSM was above 0.3). Among the 1,299 patients with reliable measurements by XL probe, 782 patients were further excluded as they had unreliable measurements by M probe. Among the excluded patients, 37% suffered from NAFLD and 2% were Chinese, and the mean (± standard deviation) BMI was 31.8 ± 6.4 kg/m2 and the waist circumference was 105 ± 14 cm. Overall, 517 patients (262 of BMI > 25–30 kg/m2; 255 of BMI > 30 kg/m2) were included in the final analysis of the exploratory cohort. A subgroup of 147 (106 French and 41 Chinese) patients who had reliable measurements by XL probe and adequate liver histology samples served as the validation cohort (Figure 1).

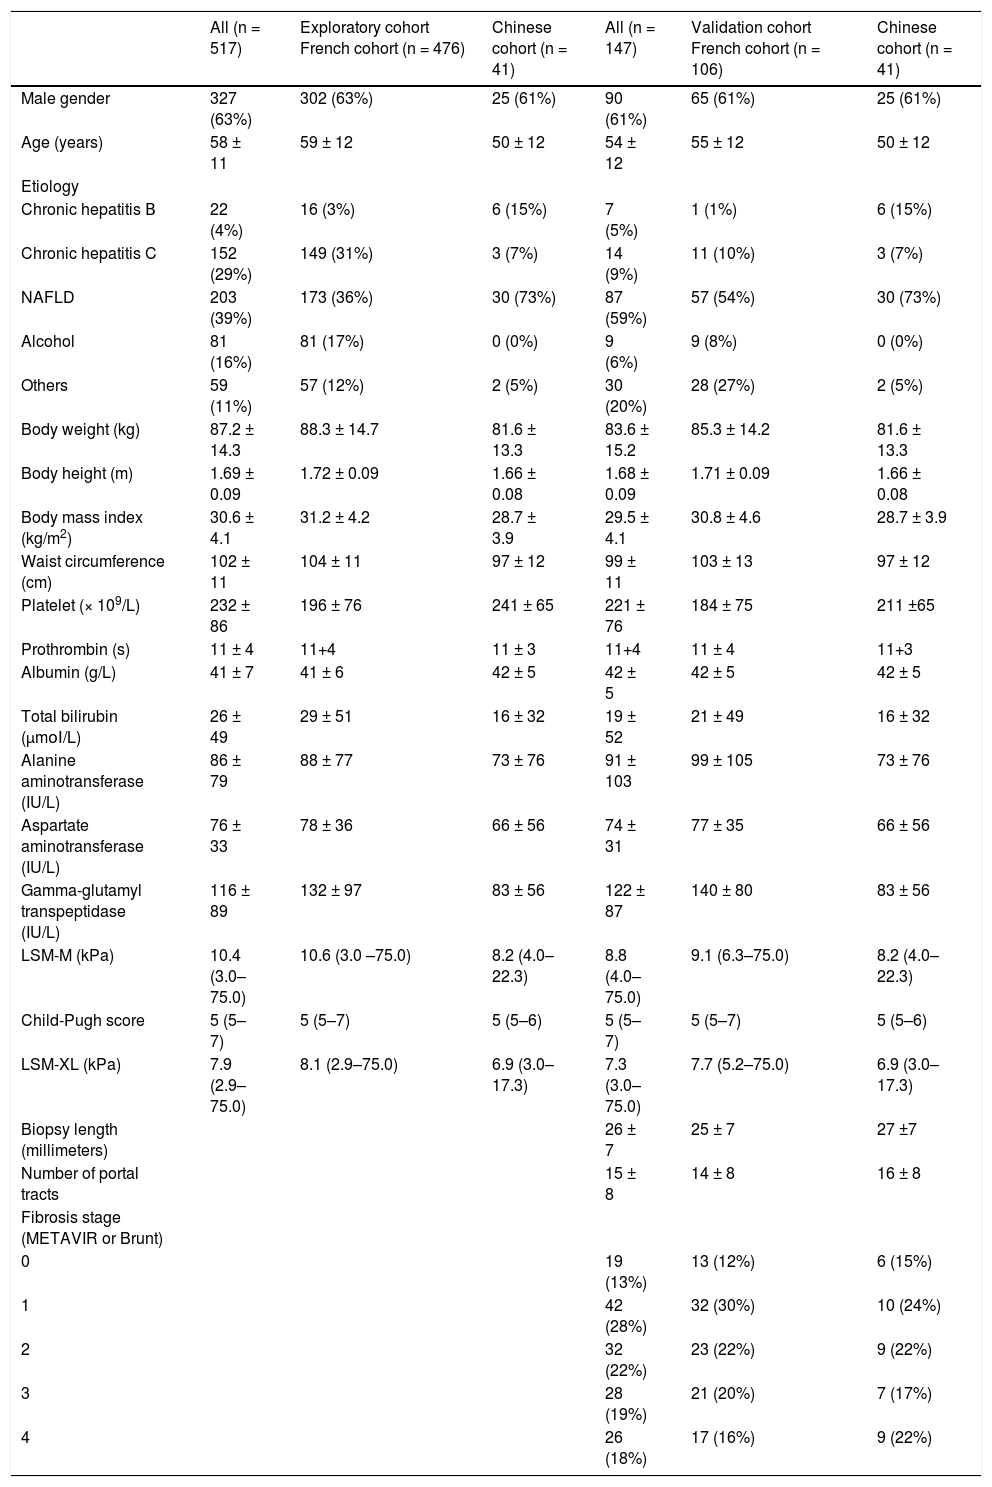
The clinical characteristics and laboratory parameters of the patients in the exploratory cohort and the validation cohort were presented in table 2. Most patients suffered from chronic hepatitis C or NAFLD. In the validation cohort, the length of liver biopsy specimen was 26 ± 7 mm, and the number of portal tract was 15 ± 8; 93 patients (63%) had fibrosis (METAVIR or Brunt) stage 0–2, whereas 54 patients (37%) had advanced fibrosis stage 3 to 4 (Table 2).
Baseline clinical characteristics in the exploratory and validation cohorts.
| All (n = 517) | Exploratory cohort French cohort (n = 476) | Chinese cohort (n = 41) | All (n = 147) | Validation cohort French cohort (n = 106) | Chinese cohort (n = 41) | |
|---|---|---|---|---|---|---|
| Male gender | 327 (63%) | 302 (63%) | 25 (61%) | 90 (61%) | 65 (61%) | 25 (61%) |
| Age (years) | 58 ± 11 | 59 ± 12 | 50 ± 12 | 54 ± 12 | 55 ± 12 | 50 ± 12 |
| Etiology | ||||||
| Chronic hepatitis Β | 22 (4%) | 16 (3%) | 6 (15%) | 7 (5%) | 1 (1%) | 6 (15%) |
| Chronic hepatitis C | 152 (29%) | 149 (31%) | 3 (7%) | 14 (9%) | 11 (10%) | 3 (7%) |
| NAFLD | 203 (39%) | 173 (36%) | 30 (73%) | 87 (59%) | 57 (54%) | 30 (73%) |
| Alcohol | 81 (16%) | 81 (17%) | 0 (0%) | 9 (6%) | 9 (8%) | 0 (0%) |
| Others | 59 (11%) | 57 (12%) | 2 (5%) | 30 (20%) | 28 (27%) | 2 (5%) |
| Body weight (kg) | 87.2 ± 14.3 | 88.3 ± 14.7 | 81.6 ± 13.3 | 83.6 ± 15.2 | 85.3 ± 14.2 | 81.6 ± 13.3 |
| Body height (m) | 1.69 ± 0.09 | 1.72 ± 0.09 | 1.66 ± 0.08 | 1.68 ± 0.09 | 1.71 ± 0.09 | 1.66 ± 0.08 |
| Body mass index (kg/m2) | 30.6 ± 4.1 | 31.2 ± 4.2 | 28.7 ± 3.9 | 29.5 ± 4.1 | 30.8 ± 4.6 | 28.7 ± 3.9 |
| Waist circumference (cm) | 102 ± 11 | 104 ± 11 | 97 ± 12 | 99 ± 11 | 103 ± 13 | 97 ± 12 |
| Platelet (× 109/L) | 232 ± 86 | 196 ± 76 | 241 ± 65 | 221 ± 76 | 184 ± 75 | 211 ±65 |
| Prothrombin (s) | 11 ± 4 | 11+4 | 11 ± 3 | 11+4 | 11 ± 4 | 11+3 |
| Albumin (g/L) | 41 ± 7 | 41 ± 6 | 42 ± 5 | 42 ± 5 | 42 ± 5 | 42 ± 5 |
| Total bilirubin (μmοΙ/L) | 26 ± 49 | 29 ± 51 | 16 ± 32 | 19 ± 52 | 21 ± 49 | 16 ± 32 |
| Alanine aminotransferase (IU/L) | 86 ± 79 | 88 ± 77 | 73 ± 76 | 91 ± 103 | 99 ± 105 | 73 ± 76 |
| Aspartate aminotransferase (IU/L) | 76 ± 33 | 78 ± 36 | 66 ± 56 | 74 ± 31 | 77 ± 35 | 66 ± 56 |
| Gamma-glutamyl transpeptidase (IU/L) | 116 ± 89 | 132 ± 97 | 83 ± 56 | 122 ± 87 | 140 ± 80 | 83 ± 56 |
| LSM-M (kPa) | 10.4 (3.0–75.0) | 10.6 (3.0 –75.0) | 8.2 (4.0–22.3) | 8.8 (4.0–75.0) | 9.1 (6.3–75.0) | 8.2 (4.0–22.3) |
| Child-Pugh score | 5 (5–7) | 5 (5–7) | 5 (5–6) | 5 (5–7) | 5 (5–7) | 5 (5–6) |
| LSM-XL (kPa) | 7.9 (2.9–75.0) | 8.1 (2.9–75.0) | 6.9 (3.0–17.3) | 7.3 (3.0–75.0) | 7.7 (5.2–75.0) | 6.9 (3.0–17.3) |
| Biopsy length (millimeters) | 26 ± 7 | 25 ± 7 | 27 ±7 | |||
| Number of portal tracts | 15 ± 8 | 14 ± 8 | 16 ± 8 | |||
| Fibrosis stage (METAVIR or Brunt) | ||||||
| 0 | 19 (13%) | 13 (12%) | 6 (15%) | |||
| 1 | 42 (28%) | 32 (30%) | 10 (24%) | |||
| 2 | 32 (22%) | 23 (22%) | 9 (22%) | |||
| 3 | 28 (19%) | 21 (20%) | 7 (17%) | |||
| 4 | 26 (18%) | 17 (16%) | 9 (22%) |
Continuous variables were expressed as mean ± standard deviation; whereas LSM was expressed as median (range). LSM-M: liver stiffness measurement by Μ probe. LSM-XL: liver stiffness measurement by XL probe. NAFLD: nonalcoholic fatty liver disease.
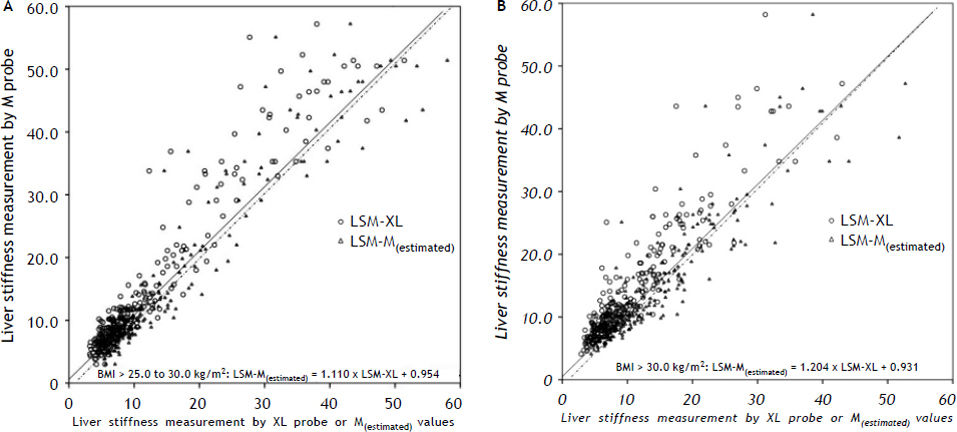
In the exploratory cohort, a strong correlation was found between the LSM-M and LSM-XL (r2 = 0.89, P < 0.001). The correlation was also good among the 293 patients with BMI < 25 kg/m2 (r2 = 0.86, P < 0.001). A formula derived with linear regression analysis demonstrate the relationship of the estimated LSM by M probe [LSM-M(estimated)] from LSM-XL:
For patients with BMI > 25.0 to 30.0 kg/m2:
LSM-M(estimated) = 1.110 × LSM-XL + 0.954.
For patients with BMI > 30.0 kg/m2:
LSM-M(estimated) = 1.204 × LSM-XL + 0.931.
Figure 2 shows the scatter-plot of LSM-M vs. LSM-XL or LSM-M(estimated) for patients with BMI > 25–30 kg/m2 and BMI > 30 kg/m2 respectively. There would be a right shift of LSM values from LSM-M(estimated) compared to raw LSM-M. The median (IQR) difference between LSM-M and LSM-M(estimated) was −0.6 (−2.1 to 1.0) kPa, which was significantly lower than that between LSM-M and LSM-XL (2.6 kPa, IQR 1.2 to 4.6 kPa, p < 0.001). Nonetheless, overall 48 patients would have LSM-M(estimated) further pushed away from the LSM-M after the conversion with this formula as their LSM-XL values were higher than LSM-M values. Therefore instead of using this simple formula to predict the estimated LSM, it would be more appropriate to derive cut-offs of XL probe for corresponding cutoffs of M probe.
 or the estimated M probe values (dashed line) results derived from a simple formulas among patients. A. Scatter plot of patients with BMI > 25.0 to 30.0 kg/m2. B. Scatter plot of patients with BMI > 30.0 kg/m2. LSM-M: liver stiffness measurement by M probe. LSM-XL: liver stiffness measurement by XL probe. LSM-M(estimated): estimated liver stiffness measurement by M probe. BMI: body mass index.")
Scatter plot of liver stiffness measurement by M probe vs. XL probe (solid line) or the estimated M probe values (dashed line) results derived from a simple formulas among patients. A. Scatter plot of patients with BMI > 25.0 to 30.0 kg/m2. B. Scatter plot of patients with BMI > 30.0 kg/m2. LSM-M: liver stiffness measurement by M probe. LSM-XL: liver stiffness measurement by XL probe. LSM-M(estimated): estimated liver stiffness measurement by M probe. BMI: body mass index.
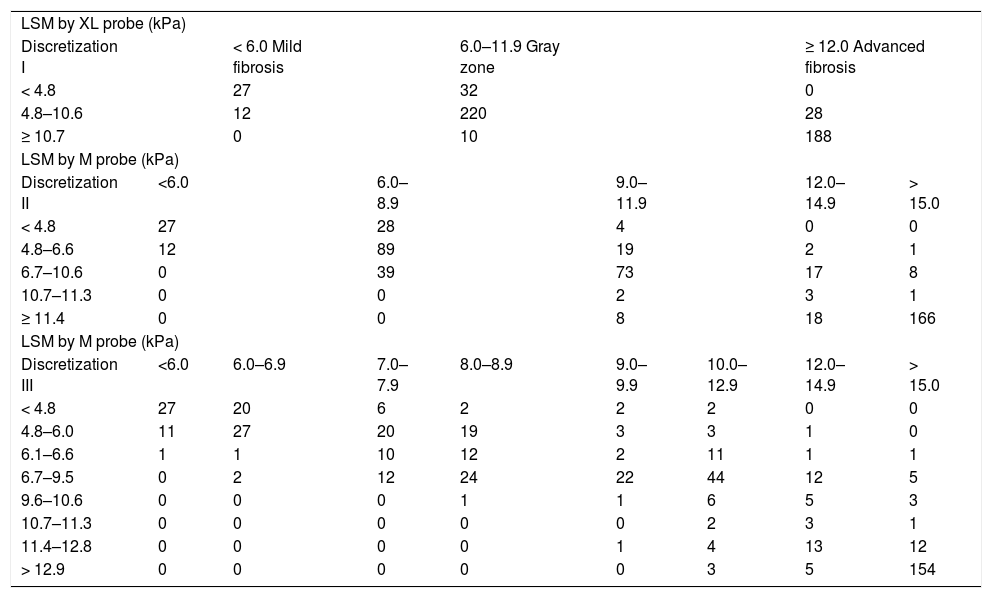
As shown in the scatter-plot of LSM-M against LSM-XL, if the whole range of values were considered, the LSM-M and LSM-XL were reasonably well correlated. However, if only larger values (e.g. LSM-M > 15.0 kPa) were taken into account, the values were much more scattered. Therefore, instead of predicting the exact LSM-M value, the LSM-M values were discretized into ranges for analysis. When the discretizations became finer (discretization II and III), more mis-predictions were noted (as compared to discretization I) (Table 3). This highlighted the difficulty of converting LSM-XL into LSM-M values accurately. Since the training results on discretization II and III were unsatisfactory, we only focused on discretization I in the following validation. In discretization I, patients were classified into 3 categories based on the LSM-XL: < 4.8 kPa (n = 59); 4.8 kPa to 10.6 kPa (n = 260); and ≥ 10.7 kPa (n = 198). Among patients with BMI > 25–30 kg/m2, the numbers of patients in these three categories were 30 (< 4.8 kPa), 131 (4.8 kPa to 10.6 kPa) and 101 (≥ 10.7 kPa) respectively. For those with BMI > 30 kg/m2, the numbers were 29 (< 4.8 kPa), 129 (4.8 kPa to 10.6 kPa) and 97 (> 10.7 kPa) respectively (Table 4).
Confusion matrices for predicting discretization I, II, and III by using liver stiffness measurement by XL probe in the exploratory cohort.
| LSM by XL probe (kPa) | ||||||||
| Discretization I | < 6.0 Mild fibrosis | 6.0–11.9 Gray zone | ≥ 12.0 Advanced fibrosis | |||||
| < 4.8 | 27 | 32 | 0 | |||||
| 4.8–10.6 | 12 | 220 | 28 | |||||
| ≥ 10.7 | 0 | 10 | 188 | |||||
| LSM by M probe (kPa) | ||||||||
| Discretization II | <6.0 | 6.0–8.9 | 9.0–11.9 | 12.0–14.9 | > 15.0 | |||
| < 4.8 | 27 | 28 | 4 | 0 | 0 | |||
| 4.8–6.6 | 12 | 89 | 19 | 2 | 1 | |||
| 6.7–10.6 | 0 | 39 | 73 | 17 | 8 | |||
| 10.7–11.3 | 0 | 0 | 2 | 3 | 1 | |||
| ≥ 11.4 | 0 | 0 | 8 | 18 | 166 | |||
| LSM by M probe (kPa) | ||||||||
| Discretization III | <6.0 | 6.0–6.9 | 7.0–7.9 | 8.0–8.9 | 9.0–9.9 | 10.0–12.9 | 12.0–14.9 | > 15.0 |
| < 4.8 | 27 | 20 | 6 | 2 | 2 | 2 | 0 | 0 |
| 4.8–6.0 | 11 | 27 | 20 | 19 | 3 | 3 | 1 | 0 |
| 6.1–6.6 | 1 | 1 | 10 | 12 | 2 | 11 | 1 | 1 |
| 6.7–9.5 | 0 | 2 | 12 | 24 | 22 | 44 | 12 | 5 |
| 9.6–10.6 | 0 | 0 | 0 | 1 | 1 | 6 | 5 | 3 |
| 10.7–11.3 | 0 | 0 | 0 | 0 | 0 | 2 | 3 | 1 |
| 11.4–12.8 | 0 | 0 | 0 | 0 | 1 | 4 | 13 | 12 |
| > 12.9 | 0 | 0 | 0 | 0 | 0 | 3 | 5 | 154 |
LSM-M: liver stiffness measurement by M probe. LSM-XL: liver stiffness measurement by XL probe.
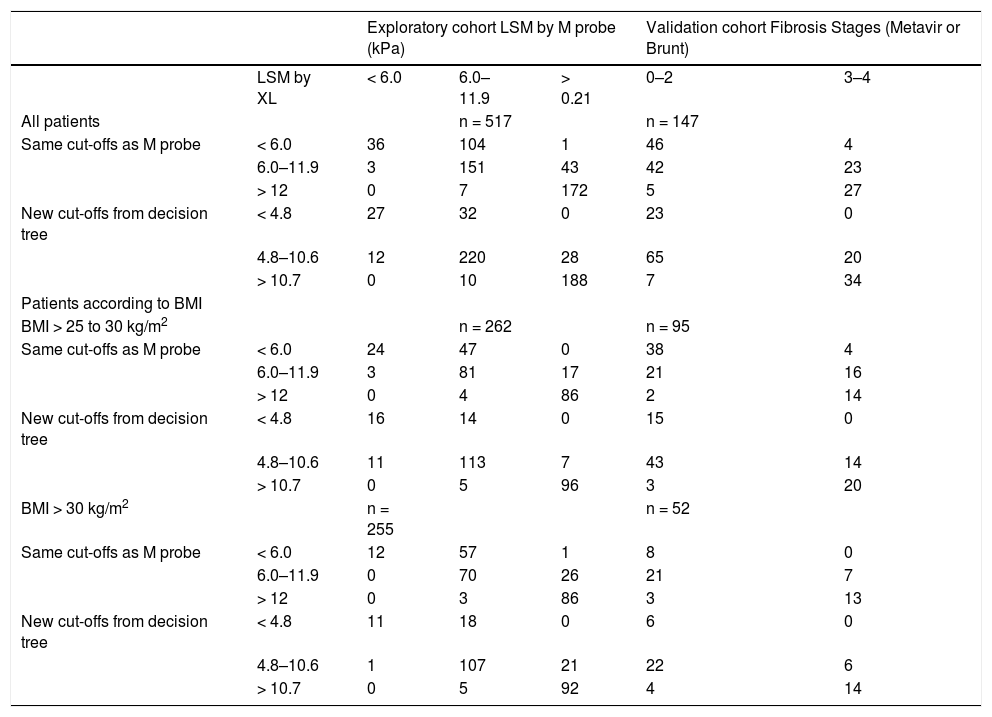
Confusion matrices of exploratory and validation cohorts of different cut-offs liver stiffness measurement by XL probes, and the corresponding liver stiffness measurement by M probe and grouped fibrosis stages.
| Exploratory cohort LSM by M probe (kPa) | Validation cohort Fibrosis Stages (Metavir or Brunt) | |||||
|---|---|---|---|---|---|---|
| LSM by XL | < 6.0 | 6.0–11.9 | > 0.21 | 0–2 | 3–4 | |
| All patients | n = 517 | n = 147 | ||||
| Same cut-offs as M probe | < 6.0 | 36 | 104 | 1 | 46 | 4 |
| 6.0–11.9 | 3 | 151 | 43 | 42 | 23 | |
| > 12 | 0 | 7 | 172 | 5 | 27 | |
| New cut-offs from decision tree | < 4.8 | 27 | 32 | 0 | 23 | 0 |
| 4.8–10.6 | 12 | 220 | 28 | 65 | 20 | |
| > 10.7 | 0 | 10 | 188 | 7 | 34 | |
| Patients according to BMI | ||||||
| BMI > 25 to 30 kg/m2 | n = 262 | n = 95 | ||||
| Same cut-offs as M probe | < 6.0 | 24 | 47 | 0 | 38 | 4 |
| 6.0–11.9 | 3 | 81 | 17 | 21 | 16 | |
| > 12 | 0 | 4 | 86 | 2 | 14 | |
| New cut-offs from decision tree | < 4.8 | 16 | 14 | 0 | 15 | 0 |
| 4.8–10.6 | 11 | 113 | 7 | 43 | 14 | |
| > 10.7 | 0 | 5 | 96 | 3 | 20 | |
| BMI > 30 kg/m2 | n = 255 | n = 52 | ||||
| Same cut-offs as M probe | < 6.0 | 12 | 57 | 1 | 8 | 0 |
| 6.0–11.9 | 0 | 70 | 26 | 21 | 7 | |
| > 12 | 0 | 3 | 86 | 3 | 13 | |
| New cut-offs from decision tree | < 4.8 | 11 | 18 | 0 | 6 | 0 |
| 4.8–10.6 | 1 | 107 | 21 | 22 | 6 | |
| > 10.7 | 0 | 5 | 92 | 4 | 14 | |
BMI: body mass index. LSM: liver stiffness measurement.
A validation cohort, composed of a subgroup of patients who also underwent liver biopsy, was used to validate the new cut-offs of XL probe using liver histology as the gold standard. There were total 357 patients underwent liver biopsy, 108 had BMI < 25.0 kg/m2; whereas 87 and 6 patients had unreliable measurements by M probe and XL probe respectively; further 9 patients were excluded as the quality of liver biopsy was suboptimal. Therefore 147 (106 French and 41 Chinese) patients were included in this validation cohort.
The optimal cut-offs for XL probe to exclude and diagnose advanced fibrosis was 4.8 kPa (sensitivity 100%, specificity 24%) and 10.7 kPa (sensitivity 37%, specificity 93%) respectively. The decision tree trained for discretization I were used to predict the discretized LSM-M values on the 147 biopsy data for the purpose of validation, which has not been used in the training process. Twenty-three patients had LSM-XL < 4.8 kPa, which represented the corresponding LSM-M < 6.0 kPa to excluding advanced fibrosis. No patient with advanced fibrosis was discordant to the LSM category. Forty-one patients (28%) had LSM-XL ≥ 10.7 kPa, which represented the corresponding LSM-M ≥ 12.0 kPa confirming advanced fibrosis. Seven patients without advanced fibrosis were discordant to this LSM category (Table 4). These 7 patients had stage 1 to 2 liver fibrosis but were mis-diagnosed to have advanced fibrosis by LSM-XL. Their BMI was 35.0 ± 8.2 kg/m2 and waist circumference was 113 ± 11 cm. The overall accuracy was 89% among these 62 patients. On the other hand, 85 patients had LSM-XL > 4.8 kPa to 10.7 kPa, which represented the gray zone where liver biopsy was recommended in clinical practice.1 On the other hand, the performance of same cut-offs of M probe (6.0 kPa and 12.0 kPa) applied in XL probe was less satisfactory as it would under-stage 4 patients of advanced fibrosis, whereas it would overstage 5 patients of F0 to 2 fibrosis (Table 3).
These new cut-offs of XL probe (4.8 kPa and 10.6 kPa) had more appreciably improved performance among patients with BMI > 25–30 kg/m2. They would have avoided the 4 cases of under-staging by the cut-offs of M probe. On the other hand, among patients with BMI > 30 kg/m2, these new cut-offs of XL probe will increase one case of over-staging compare to the cut-offs of M probe.
DiscussionThis study was the first and biggest multicenter study aimed to derive and evaluate the appropriate cut-offs of XL probe for corresponding cut-offs of M probe. Overall, there was a good correlation between the readings of the two probes, but direct conversion of the readings was difficult. Using decision tree analysis of discretized M probe readings, the two LSM cut-offs 4.8 kPa and 10.7 kPa of the XL probe were the closest estimates of the M probe cutoffs 6.0 kPa and 12.0 kPa to exclude and confirm advanced liver fibrosis. These new cut-offs of XL probe should be applied to patients with BMI > 25–30 kg/m2, but they were not necessarily indicated among those with BMI > 30 kg/m2 as they did not improve the performance to exclude and diagnose advanced fibrosis. Probably the cut-offs from M probe could be applied to patients with BMI > 30 kg/m2. To derive cut-offs of XL probe in this way partly overcomes the limited number and sample sizes of biopsy-based validation studies of XL probe, at the same time allows a reasonably meaningful interpretation of the XL probe in clinical practice.
The novel findings of this study were not just the new cut-offs of XL probe, but also that cut-offs of M probe could be probably applied to obese patients with BMI > 30 kg/m2. This made sense from the design of the XL probe, which facilitates higher depth of measurements of liver parenchyma below the skin surface. Therefore the LSM by XL probe in the obese persons should be comparable to the LSM by M probe in normal weight persons. The area uncertainty lies on the overweight patients, such that the exact influence of subcutaneous fat and skin-to-liver capsule distance on the performance of both probe remains to be delineated. We recently reported our observation that LSM values by M probe started to rise in NAFLD patients with BMI > 25–30 kg/m2 even at the same stage of fibrosis.23 From the results of the current study, cut-offs slightly lower than that of M probe, for approximately 1.2 kPa to 1.3 kPa, should be applied in XL probe should be adopted for overweight patients (BMI > 25–30 kg/m2). This echoed the results of previous study of XL probe, in which lower LSM values by XL probe than M probe were consistently observed.10–13
The much higher rate of reliable LSM by XL probe (80%) compared to M probe (34%) in patients with BMI > 25 kg/m2 implied that XL probe can be clinically applied more widely to subjects who are suspected or confirmed to have chronic liver disease. The rate of reliable LSM by M probe in the current study was only 34%, which was much lower compared to the previous reports.6,7 This was because this cohort of patients had LSM by both M and XL probes, and the later probe was sometimes chosen when LSM by M probe failed, results were doubtful or unreliable. Hence this cohort included significant proportion of obese and/or NAFLD patients, as evidenced by the fact that more than 85 and 52% of the 1969 subjects had BMI > 25 and 30 kg/m2, respectively. This approach significantly reduced the success rate of LSM by M probe, at the same time this highlighted the power of XL probe. The rate of reliable LSM was still up to 80% in this cohort of patients whose BMI was > 30 kg/m2 in half of the cases, and even 7% of patients had BMI > 40 kg/m2. This is particularly important in NAFLD patients as they are often obese,24 such that the success rate of LSM by M probe would be as low as 75% in those with BMI > 30 kg/m2.5
One issue of these new cut-offs of XL was that a significant proportion (50 and 60% in the exploratory and validation cohort respectively) of patients with BMI > 25–30 kg/m2 would be classified into the ‘gray zone’ category. On the other hand, 38 and 54% in the exploratory and validation cohort of patients with BMI > 30 kg/m2 were classified into the ‘gray zone’ category. These were somehow higher than the 40% in our previous ALT-based algorithm for chronic hepatitis B patients and the 16% in our previous report for NAFLD.4,5 This was because for simplicity sake we adopted 6.0 kPa and 12.0 kPa as the cut-offs of M probe among our patients with mixed disease etiologies, as the best LSM cut-offs for advanced fibrosis are slightly different for different etiologies.1 Therefore, the range of LSM falling in the gray zone was wider in this study as compared to that of the ALT-based algorithm for hepatitis B (6.0 kPa to 9.0 kPa for normal ALT and 7.5 to 12.0 kPa for elevated ALT)4 or the algorithm for NAFLD (7.9 to 9.6 kPa).5 Nonetheless, approximately 50% of patients (or 34% if those with unreliable XL measurements were also included in the denominator) would be able to avoid a liver biopsy using XL probe with the new cut-offs. This already significantly reduces the burden of liver biopsy. Therefore LSM by XL probe may be considered as the initial screening tool for obese subjects who are at risk of NAFLD and liver fibrosis.
There were total 7 out of 62 patients (no underestimation and 7 over-estimations) had discordant LSM-XL results and liver biopsy. The rate of discordance of 11% was relatively low compared to other non-invasive tests of liver fibrosis.1 Seven patients had their liver fibrosis overestimated by LSM-XL, and 3 of them had stage 2 fibrosis. The overestimation was not confined to XL probe but also M probe, as the LSM-M ranged from 9.0 kPa to 22.0 kPa. Possible reasons of the overestimation of liver fibrosis might be contributed by the elevated serum ALT levels (in 3 patients) and morbid obesity (BMI > 35 kg/m2 in 4 patients). In a recent population study, subjects with extreme BMI were also found to have higher LSM.25 In another study testing XL probe in patients with different liver diseases, BMI > 40 kg/m2 was also found to be associated with discordance between LSM and histology.12
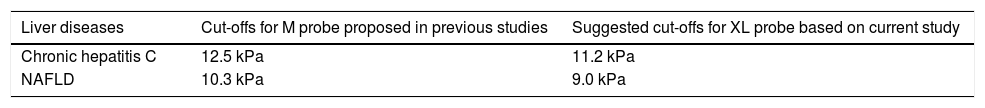
Our study has several limitations. First, a large proportion of patients were excluded in the analysis of the exploratory cohort as they had unreliable LSM by M probe. This might limit generalizability of the findings to patients who failed M and/or XL probe. However this just reflected the real-life clinical practice particularly in a Caucasian center for NAFLD patients. The high rate of unreliable LSM by M probe urges the need of deriving and validating the cut-offs XL probe. Second, this study included patients with mixed etiologies of liver diseases. It is therefore not our primary goal to investigate the best cut-off for different stages of liver fibrosis for a specific disease, which will require larger scaled studies with liver biopsy. As these studies are more expensive and will take more time to complete, the current study can partly compensate the clinical need on the use of XL probe. The proposed cut-offs for XL probe for the two major etiologies in this study, chronic hepatitis C (N = 152) and NAFLD (N = 203), based on our findings are provided in table 5. These proposed cut-offs are only approximate estimates as they will be revisited as experience accumulates. Furthermore, we have also included 147 patients with liver biopsy for validation of the cut-offs of XL probe. In fact, liver biopsy is not a perfect gold standard which may also contribute to the discrepancy between liver biopsy and LSM results. Third, patients were recruited from tertiary centers, and the proportion of patients with advanced fibrosis and cirrhosis was higher than the general population. On the other hand, the external validity of this study was also improved by the inclusion of both Chinese and Caucasian patients. Forth, neither the regression equation or decision tree approach will work perfectly because some patients have higher LSM-XL than LSM-M. Discretization into categories might lead to a relatively small number of patients in individual category, especially for the lowest results. Fifth, skin-capsular distance was not measured as suggested by the manufacturer. Whether this affected the validity of LSM-XL was unknown. Lastly, a major drawback of transient elastography in general is that no independently validated cut-offs for specific liver diseases are available even for the M probe, which may also affect the validity of LSM-XL.
The cut-offs of liver stiffness measurement values for M and the XL probes to diagnose histologic cirrhosis for the two major etiologies, chronic hepatitis C (n = 152) and NAFLD (n = 203) in this study.
| Liver diseases | Cut-offs for M probe proposed in previous studies | Suggested cut-offs for XL probe based on current study |
|---|---|---|
| Chronic hepatitis C | 12.5 kPa | 11.2 kPa |
| NAFLD | 10.3 kPa | 9.0 kPa |
In conclusion, cut-offs of XL probe at 4.8 kPa and 10.7 kPa derived from the decision tree were the best estimates of 6.0 and 12.0 kPa with M probe among patients with BMI > 25–30 kg/m2. With these new cut-offs of XL probe, 34–50% of patients with > 25–30 kg/m2 may avoid liver biopsy. In these patients we need to use both probes and we are uncertain yet what is the best probe to use. For those with BMI > 30 kg/m2, probably the cut-offs of M probe remain applicable to XL probe.
Abbreviations- •
ALT: alanine aminotransferase.
- •
BMI: body mass index.
- •
HBsAg: hepatitis B surface antigen.
- •
HCV: hepatitis C virus.
- •
IQR: interquartile range.
- •
LSM: liver stiffness measurement.
- •
NAFLD: nonalcoholic fatty liver disease.
None.
Conflict of Interest StatementGrace Wong has served as a speaker for Echosens and an advisory committee member for Otsuka.
Vincent Wong has served as an advisory committee member for Roche, Novartis, Gilead and Otsuka. He has also served as a speaker for Bristol-Meyrs Squibb, Roche, Novartis, Abbott Diagnostics and Echosens.
Henry Chan is a consultant for Abbott, Bristol Myer Squibb, Gilead, Merck, Novartis, Roche and Vertex, and has received honorarium for lecture for Abbott, Bristol-Myers Squibb, FuRui, Gilead, Glaxo-Smith-Kline, Merck, Novartis and Roche.
Victor de Lédinghen is consultant for Merck, Echosens, Gilead, Janssen, Boehringer Ingelheim and received paid lecture fees from Janssen, Echo-sens, Roche, Gilead.
Authors’ Contributions StatementGrace Wong, Julien Vergniol, Vincent Wong, Henry Chan and Victor de Lédinghen were responsible for the conception, design of the study and the development of methodology. Grace Wong, Julien Vergniol, Vincent Wong, Juliette Foucher, Faiza Chermak and Wassil Merrouche were responsible for the acquisition of data. Peter Lo and Kwong-Sak Leung were responsible for the development of cutoffs of XL probe. Brigitte Le Bail and Paul Choi were responsible for the histologic assays of liver biopsy samples. Grace Wong, Julien Vergniol, Vincent Wong, Henry Chan and Victor de Lédinghen were responsible for the analysis and interpretation of data, as well as the writing, review and/or revision of the manuscript.


