


Introduction. Gadoxetate-disodium is a liver-specific MR contrast agent absorbed by hepatocytes via organic anion transporting polypeptide 1B3 and is excreted into the biliary system by multidrug resistance-associated protein 2. It has been suggested that relative parenchymal enhancement on hepatocyte phase image is associated with hepatic function. However, it is not clear whether gadoxetate-disodium-enhanced MRI can be used as a noninvasive fibrosis marker. Thus, the purpose of our study was to evaluate the diagnostic performance of gadoxetate-disodium-enhanced MRI in predicting the hepatic fibrosis stage.
Materials and methods. A total of 113 patients who had fibrosis staged according to the Batts and Ludwig score were enrolled: F0 (n = 13), F1 (n = 18), F2 (n = 15), F3 (n = 32), and F4 (n = 35). All patients underwent gadoxetate-disodium-enhanced MRI before confirmation by biopsy (n = 67) or surgery (n = 46). For quantitative analysis, the contrast enhancement index (CEI) was calculated by measuring the signal intensity (SI) in liver and paraspinal muscle using a region of interest, as follows: CEI = (liver SI/paraspinal muscle SI) 20minhepatocyte phase image/(liver SI/paraspinal muscle SI) pre-contrast T1–weighted image. The diagnostic performance was evaluated by the ROC curve, adjusted for the prevalence of each fibrosis stage.
Results. A significant negative correlation was observed between CEI and fibrosis stage (r = –0.545, P < 0.0001). The adjusted AUROC for CEI in the prediction of mild (≥ F1), moderate (≥ F2), or severe fibrosis (≥ F3) and liver cirrhosis (F4) was 0.668, 0.703, 0.73, and 0.84, respectively. In conclusion, our results demonstrate that quantitative analysis of relative hepatic enhancement using gadoxetate-disodium-enhanced MRI can predict the hepatic fibrosis stage.
Assessment of hepatic fibrosis is crucial in deciding on the management course, monitoring the disease, and determining the prognosis for patients with liver disease. Liver biopsy is still the reference standard, but the invasiveness of the procedure is a negative factor. Therefore, diverse noninvasive methods for assessment of hepatic fibrosis have been studied and developed. The majority of noninvasive tools for assessment of hepatic fibrosis can be categorised according to two types of methods.1.–10 The first method is a serum fibrosis marker-based method that uses laboratory parameters, such as the aspartate aminotransferase (AST) to platelet ratio index (APRI), the Forns index, hyaluronic acid, and procollagen peptides.1.–5 The alternate approach is a physical method that uses transient elastography (TE) (Fibroscan®; Echosens, Paris, France), MR elastography (MRE), apparent diffusion coefficient (ADC) measurement using diffusion weighted image (DWI), or acoustic radiation force impulse elastography.6.–10 However, these methods can be inaccurate or not routinely available in many hospitals. In addition to conventional anatomical imaging for morphological analysis, clinicians need a simple, accurate, cost-effective, noninvasive method for determination of the hepatic fibrosis stage. Therefore, conventional liver US, CT, or MRI for prediction of the hepatic fibrosis stage, together with an indirect serum fibrosis marker, may be desirable.
Gadoxetate-disodium (Primovist, Bayer Schering Pharma, Berlin, Germany) is a T1 contrast agent that has frequently been used for liver MRI. Gadoxetate-disodium is a hepatocyte-specific uptake compound and also serves as an extracellular contrast agent. Up to 50% of it is actively absorbed by hepatocytes via organic anion transporting polypeptide 1B3 (OATP1B3) and excreted into the biliary system by multidrug resistance-associated protein 2 (MRP2).11 According to recent reports, the relative hepatic parenchymal enhancement ratio using gadoxetate-disodium-enhanced MRI could indicate hepatic function.12,13 However, there are few data on whether gadoxetate-disodium-enhanced MRI can be used as a noninvasive marker of hepatic fibrosis.14.–16
Therefore, we investigated the diagnostic performance of gadoxetate-disodium-enhanced 3T MRI in the prediction of the hepatic fibrosis stage.
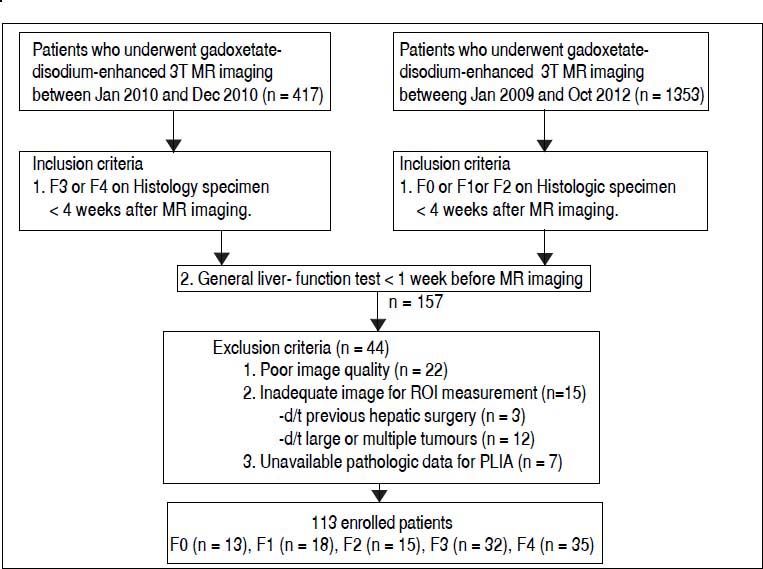
Material and MethodsStudy subjectsInstitutional review board approval was obtained for this retrospective study, and informed consent was waived. Patients were included if the following inclusion criteria were satisfied: patients who were staged for the degree of hepatic fibrosis in a histopathological specimen and who underwent gadoxetate-disodium-enhanced 3T MRI less than four weeks before histological confirmation and a general liver function test less than one week before MRI. In total, 113 patients who satisfied the inclusion and exclusion criteria were enrolled in this study (Figure 1). The enrolled study subjects were divided into two groups. Group 1 consisted of subjects with no or mild to moderate hepatic fibrosis, and group 2 consisted of subjects with severe fibrosis or cirrhosis. Periods of recruitment differed between the two groups because the numbers of each group in the same period were statistically too small or too large, respectively.

Flow diagram of the study subjects. The hepatic fibrosis stages according to the Batts and Ludwig scoring system are as follows: F0: no hepatic fibrosis. F1: mild hepatic fibrosis. F2: moderate hepatic fibrosis. F3: severe hepatic fibrosis. F4: hepatic cirrhosis. ROI: region of interest. PLIA: portal and lobular inflammatory activity.
We excluded 22 patients because of poor quality due to uncontrolled respiration, an artefact, or lack of an accurate 20 min axial hepatocyte phase image. We also excluded 15 patients who had undergone hepatic surgery (n = 3) or had tumours (n = 12) because measuring hepatic parenchymal signal intensity (SI) at four different sections of the liver using a region of interest (ROI) measurements was impossible. Seven patients were excluded due to unavailable pathological data for portal and lobular inflammatory activity (PLIA).
The hepatitis B surface antigen was present in 82 patients and the hepatitis C virus antibody in nine patients. Five patients were diagnosed with alcoholic liver disease. Seventeen patients had neither of these. Histopathological specimens were obtained by ultrasonography-guided liver biopsy (n = 67; mean biopsy length ± SD: 1.50 cm ± 0.27; range 1.2–2.5 cm) or surgery (n = 46; mean biopsy length ± SD: 1.59 cm ± 0.22; range 1.0–2.0 cm). Surgery was performed for hepatocellular carcinoma as follows: segmentectomy and wedge resection (n = 22), sectionectomy (n = 12), right hemihepatectomy (n = 10), extended left hemihepatectomy (n = 1), and central bisectionectomy (n = 1).
The Batts and Ludwig staging and grading of chronic hepatitis on histological specimens was adopted as a reference standard as follows: no fibrosis (F0), enlarged fibrotic portal tracts (F1), periportal fibrosis or portal-to-portal septa without architectural distortion (F2), bridging fibrosis with architectural distortion but no obvious cirrhosis (F3), and cirrhosis (F4); and no/minimal inflammation (A0), portal inflammation or lobular inflammation without necrosis (A1), mild periportal inflammation and piecemeal necrosis or focal hepatocellular necrosis (A2), moderate periportal inflammation and piecemeal necrosis or severe focal cell damage (A3), and severe periportal inflammation and piecemeal necrosis or bridging necrosis (A4).17
MR imaging protocolAll of the patients underwent MRI using a 3T system (Signa Excite; GE Medical Systems, Milwaukee, WI) and an eight-channel torso array coil before biopsy or surgery. The conventional liver MRI protocol consisted of the following sequence: pre-contrast axial T1–weighted image (T1WI) and an axial T1WI with dual-echo gradient echo; axial, coronal T2–weighted images with a single-shot fast spin echo technique. Pre-contrast and post-contrast axial T1WIs were acquired using a breath-hold fat-suppressed three-dimensional fast spoiled-gradient recalled echo sequence (LAVA, liver acceleration volume acquisition). 3D LAVA was performed using the following parameters:
- •
Repetition time: 4 msec.
- •
Echo time: 2 msec.
- •
Echo train length: 1.
- •
Flip angle: 12 degrees.
- •
Section thickness: 4.4 mm.
- •
Field of view: 342 × 380 mm.
- •
Image matrix: 320 × 192.
Each patient received an intravenous bolus injection of gadoxetate-disodium at a standard dose (0.025 mmol/kg of body weight) and a flow rate of 2 mL/s followed by a 20-mL saline flush. Post-contrast axial images were obtained at 0 s, 30 s, 60 s, 3 min, 5 min, 7 min, and 20 min, and coronal images were obtained at approximately 10 min and 15 min. Respiratory-triggered two-dimensional fat-suppressed axial T2-weighted fast spin echo and breath-hold two-dimensional axial DWIs (b factors: 0, 400 and 800 sec/mm2) were also obtained.
Quantitative image analysisTwo attending faculty members (S.H.C and J.H.B., with nine and five years of clinical experience in interpreting hepatobiliary MR, respectively), who were blinded to patient information, evaluated the MRI through consensus.
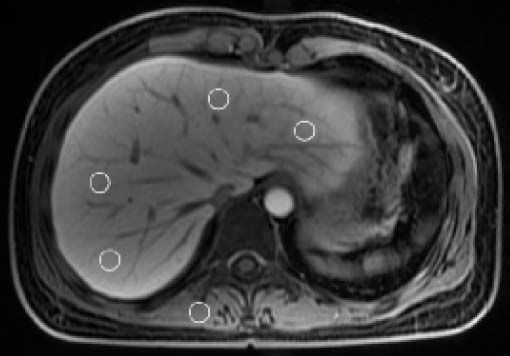
For quantitative analysis, the reviewer measured hepatic parenchymal SI on the pre-contrast axial T1WI and 20 min hepatocyte phase. Hepatic parenchymal SI was measured at each of the four sections (i.e., left lateral, left medial, right anterior, and right posterior sections) using a ROI measurements. The reviewer carefully located the ROI box (ROI size: 1–2 cm2) in each section to avoid the vessels, biliary structures, tumour, and prominent artefacts. The mean value of the four hepatic sections was calculated and served as the representative value of the entire hepatic parenchymal SI on each phase. In addition, we measured the SI in the right paraspinal muscle at the same level on the pre-contrast axial T1WI and 20 min hepatocyte phase, respectively (Figure 2). Contrast enhancement index (CEI) in the liver was calculated15,16 (Figure 3).
 of the liver using a region of interest measurements (circles). Right paraspinal muscle SI was also measured. CEI: contrast enhancement index. SI: signal intensity. ROI: a region of interest.")
Axial T1–weighted 20 min hepatocyte phase image obtained after intravenous injection of gadoxetate-disodium in a 34– year-old female with hepatic fibrosis stage 0 and a CEI of 1.6623. Hepatic parenchymal SI was measured in each of the four sections (left lateral, left medial, right anterior, and right posterior sections) of the liver using a region of interest measurements (circles). Right paraspinal muscle SI was also measured. CEI: contrast enhancement index. SI: signal intensity. ROI: a region of interest.

All measurements were performed using imaging processing software (G3; Infinitt, Seoul, Korea) on a picture archiving and communication system workstation monitor.
Laboratory blood testTo evaluate the relationship between liver function test (LFT) results and CEI, the following serum parameters were recorded: AST, alanine aminotransferase (ALT), total bilirubin (TB), direct bilirubin (DB), albumin, alkaline phosphatase (ALP), gamma-glutamyl transpeptidase (GGT), prothrombin time international normalised ratio (PT-INR), and platelet count.
Statistical analysisStatistical analyses were performed using two statistical software packages (SPSS, version 19, SPSS, Chicago, Ill; MedCalc, version 12.2.1.0, Med-Calc software, Mariakerke, Belgium). The results are expressed as the mean ± SD for continuous variables. Spearman’s or Pearson’s correlation analysis was performed to evaluate the relationship between hepatic fibrosis stage, LFT, PLIA, and CEI. After testing of CEI for normality using the Kolmogorov-Smirnov test, one-way analysis of variance was used to calculate the significant difference of CEI according to hepatic fibrosis stage and the degree of PLIA. The Mann-Whitney U test was performed to evaluate the statistical difference of hepatic fibrosis staging between core and wedge biopsy sample, and CEI between non-advanced hepatic fibrosis (F0–2) and advanced hepatic fibrosis (F3–4). The diagnostic performance of CEI in predicting the hepatic fibrosis stage was calculated using the area under the receiver operating characteristic curve (AUROC). A P value of less than 0.05 was considered statistically significant.
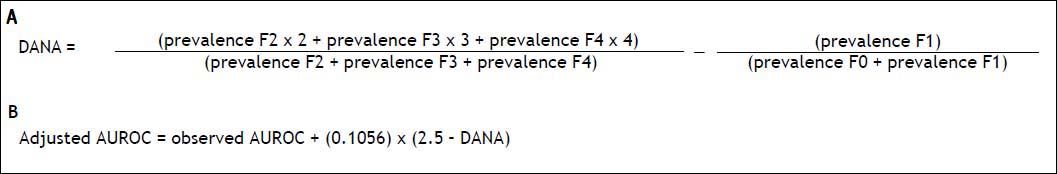
Standardisation of AUROCs to correct for spectrum biasRecently, Poynard, et al. reported that owing to the heterogeneous prevalence of hepatic fibrosis stages from F0 to F4, adjustment of AUROC is needed for the study of biomarkers of hepatic fibrosis, using the difference between advanced and non-advanced fibrosis (DANA) method.18 The DANA method uses the formula which transforms any prevalence profile into a homogeneous distribution (Figure 4A). After calculating the DANA, we calculated the adjusted AUROC using the formula of figure 4B.19
Results
The baseline characteristics of the study subjects are summarised in table 1.
Demographic and clinical characteristics of study subjects (n = 113).
| Fibrosis Stage | F0 (n = 13) | F1 (n = 18) | F2 (n = 15) | F3 (n = 32) | F4 (n = 35) |
|---|---|---|---|---|---|
| Male:female | 5:8 | 13:5 | 10:5 | 21:11 | 24:11 |
| Age (years) | 45.69 ± 16.98 | 55.50 ± 13.43 | 54.33 ± 14.59 | 58.53 ± 9.63 | 58.51 ± 9.29 |
| BMI (kg/m2) | 22.91 ± 2.63 | 23.11 ± 4.56 | 22.97 ± 2.37 | 23.33 ± 2.57 | 24.43 ± 2.66 |
| CEI | 1.60 ± 0.31 | 1.53 ± 0.18 | 1.50 ± 0.18 | 1.45 ± 0.30 | 1.20 ± 0.20 |
| AST (IU/L) | 24.54 ± 16.71 | 32.5 ± 23.30 | 71.47 ± 94.46 | 46.75 ± 22.56 | 58.37 ± 48.75 |
| ALT (IU/L) | 25.08 ± 23.65 | 28.33 ± 19.92 | 37.40 ± 24.33 | 50.94 ± 35.23 | 51.89 ± 99.61 |
| Albumin (g/dL) | 3.93 ± 0.76 | 4.11 ± 0.47 | 3.94 ± 0.60 | 4.12 ± 0.52 | 3.58 ± 0.58 |
| Total bilirubin (mg/dL) | 0.63 ± 0.40 | 0.91 ± 0.86 | 0.80 ± 0.36 | 0.69 ± 0.33 | 1.41 ± 1.14 |
| Direct bilirubin (mg/dL) | 0.18 ± 0.10 | 0.36 ± 0.64 | 0.27 ± 0.20 | 0.24 ± 0.15 | 0.65 ± 0.54 |
| ALP (IU/L) | 64.25 ± 22.80 | 84.33 ± 38.47 | 81.87 ± 29.58 | 89.09 ± 36.29 | 102.89 ±34.67 |
| GGT (IU/L) | 55.41 ± 51.01 | 114.23 ± 249.67 | 59.80 ± 53.64 | 63.92 ± 63.04 | 125.98 ± 105.33 |
| PT-INR | 1.01 ± 0.08 | 1.05 ± 0.11 | 1.09 ± 0.21 | 1.07 ± 0.08 | 1.18 ± 0.13 |
| Platelets (109/L) | 243.00 ± 94.52 | 193.06 ± 56.36 | 212.87 ± 84.56 | 132.44 ± 53.51 | 109.03 ± 46.54 |
| PLIA grade 0/1/2/3/4 | 8/2/1/2/0 | 0/12/6/0/0 | 0/1/12/2/0 | 0/3/18/11/0 | 1/4/17/10/3 |
Data are expressed as the mean ± SD. BMI: body mass index. CEI: contrast enhancement index. AST: aspartate aminotransferase. ALT: alanine aminotransferase. ALP: alkaline phosphatase. GGT: gamma-glutamyl transpeptidase. PT-INR: prothrombin time international normalised ratio. PLIA: portal and lobular inflammatory activity.
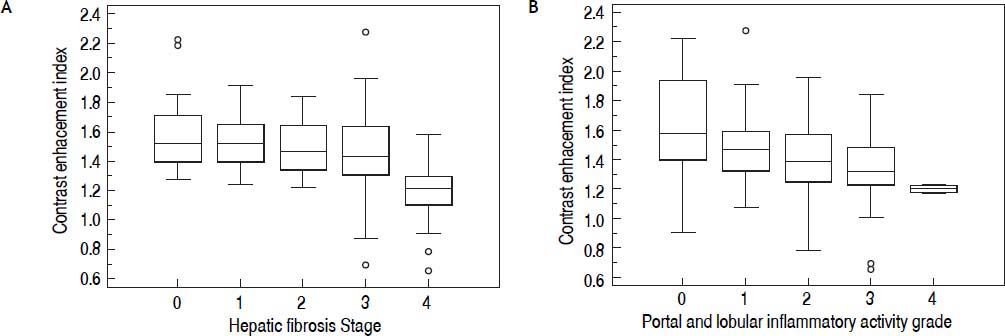
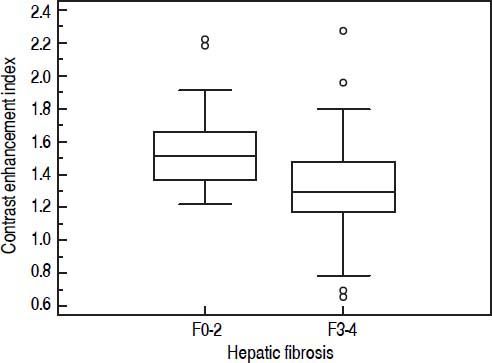
A significant negative correlation was observed between CEI and the hepatic fibrosis stage ( r = –0.545, P < 0.0001), meaning that as the hepatic fibrosis stage progressed, CEI decreased (Table 2, Figure 5A). Also as the grade of PLIA increased, median CEI decreased (Figure 5B). However, CEI was weakly correlated with PLIA (r = –0.298, P = 0.0013). Amongst the LFTs, albumin had the highest correlation with CEI (r = 0.309, P = 0.001). Albumin was weakly correlated with CEI, and the degrees of correlation between other serum parameters and CEI were weaker. CEI was weakly correlated with TB, DB, ALP, PT-INR, and platelet count (Table 2). A statistically significant difference was observed in mean CEI according to hepatic fibrosis stage or PLIA (P < 0.001 or P = 0.011, respectively). Mean CEI in the non-advanced hepatic fibrosis group (F0–2) was significantly higher than that in the advanced hepatic fibrosis group (F3–4) (P < 0.0001) (Figure 6). A significant difference of hepatic fibrosis staging was observed between core and wedge biopsy samples (mean stage: 3.07 ± 1.22 vs. 1.70 ± 1.17, respectively; P < 0.0001).
Correlations between fibrosis stage and CEI, and between liver function tests and CEI.
| Liver function test, grade, stage | Correlation coefficient | 95% CI | P value |
|---|---|---|---|
| Fibrosis stage | –0.545 | –0.663 to -0.401 | < 0.0001* |
| PLIA | –0.298 | –0.458 to -0.120 | 0.0013* |
| AST | –0.166 | –0.340 to -0.020 | 0.0794 |
| ALT | –0.014 | –0.199 to -0.172 | 0.8815 |
| Albumin | 0.309 | 0.130 to 0.468 | 0.001* |
| Total bilirubin | –0.292 | –0.453 to -0.113 | 0.0018* |
| Direct bilirubin | –0.307 | –0.466 to -0.128 | 0.001* |
| ALP | –0.219 | –0.389 to -0.035 | 0.02* |
| GGT | –0.110 | –0.292 to -0.080 | 0.2555 |
| PT-INR | –0.276 | –0.439 to -0.096 | 0.0032* |
| Platelet | 0.307 | 0.129 to 0.465 | 0.001* |
| BMI | –0.113 | –0.291 to 0.074 | 0.2351 |
P value: statistically significant by Pearson’s or Spearman’s correlation analysis. CEI: contrast enhancement index. PLIA: portal and lobular inflammatory activity. AST: aspartate aminotransferase. ALT: alanine aminotransferase. ALP: alkaline phosphatase. GGT: gamma-glutamyl transpeptidase. PT-INR: prothrombin time international normalised ratio. BMI: body mass index.
 and PLIA degrees (B). A small circle indicates an outside value, and a small rectangle indicates a far out value. CEI: contrast enhancement index. PLIA: portal and lobular inflammatory activity.")
. CEI: contrast enhancement index.")
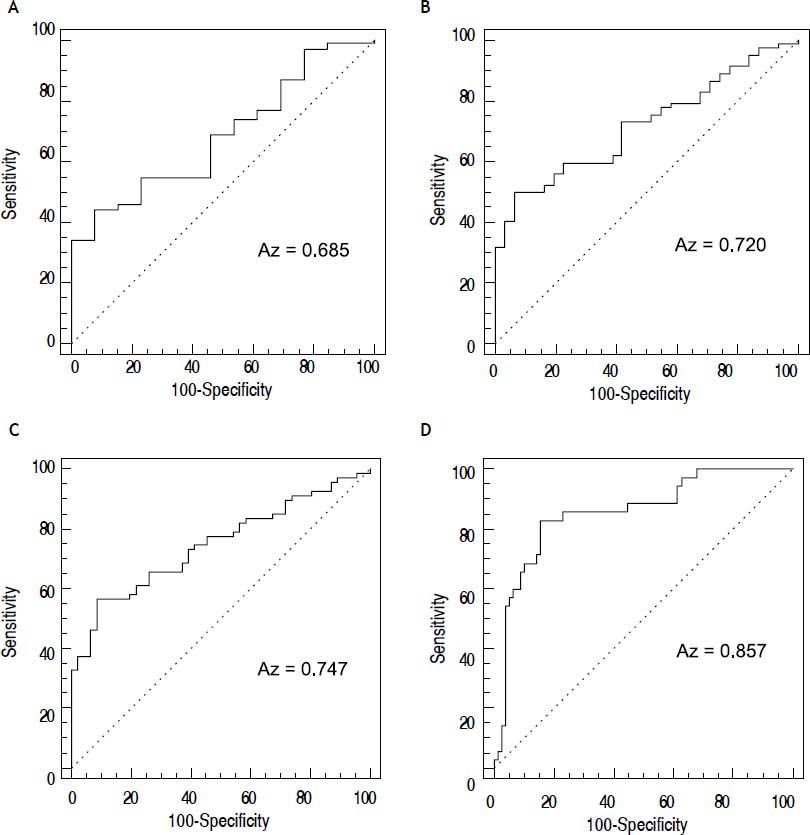
The AUROCs for CEI in the prediction of mild or greater (≥ F1), moderate or greater (≥ F2), severe or greater hepatic fibrosis (≥ F3), and liver cirrhosis (F4) were 0.685 (P = 0.0073); 0.72 (P < 0.0001); 0.747 (P < 0.0001); and 0.857 (P < 0.0001), respectively
(Figure 7). In the standardisation of AUROCs, the DANA was 2.663257. The adjusted AUROCs for CEI in the prediction of mild or greater (≥ F1), moderate or greater (≥ F2), severe or greater hepatic fibrosis (≥ F3), and liver cirrhosis (F4) were 0.668, 0.703, 0.73, and 0.84, respectively (Table 3).
 (A), moderate or greater hepatic fibrosis (≥ F2) (B), severe or greater hepatic fibrosis (≥ F3) (C), and liver cirrhosis (F4) (D). CEI: contrast enhancement index.")
The ROC curve for the diagnostic performance of CEI in predicting the hepatic fibrosis stage. Mild or greater hepatic fibrosis (≥ F1) (A), moderate or greater hepatic fibrosis (≥ F2) (B), severe or greater hepatic fibrosis (≥ F3) (C), and liver cirrhosis (F4) (D). CEI: contrast enhancement index.
Diagnostic performance of CEI in predicting the hepatic fibrosis stage.
| Cut-off | AUROC | Adjusted AUROC | Sensitivity | Specificity | P value | |
|---|---|---|---|---|---|---|
| ≥ F1 | ≤ 1.322 | 0.685 (0.591–0.769) | 0.668 | 44% (34.1–54.3) | 92.3% (64–99.8) | 0.0073* |
| ≥ F2 | ≤ 1.3196 | 0.72 (0.628–0.800) | 0.703 | 50% (38.7–61.3) | 93.5% (78.6–99.2) | < 0.0001* |
| ≥ F3 | ≤ 1.3173 | 0.747 (0.657–0.824) | 0.73 | 56.7% (44.0–66.8) | 91.3% (79.2–97.6) | < 0.0001* |
| = F4 | ≤ 1.3146 | 0.857 (0.779–0.916) | 0.84 | 82.9% (66.4–93.4) | 84.6% (74.7–91.8) | < 0.0001* |
Data in parentheses are 95% confidence intervals.
The degree of relative hepatic parenchymal enhancement using gadoxetate-disodium-enhanced MRI can indicate hepatic function.10,11 This fact relies on the assumption that as hepatic function is impaired, hepatic parenchymal enhancement in the hepatocyte phase is decreased. However, the mechanism is unclear. Kim, et al. and Ni, et al. suggested the following mechanism: as hepatic fibrosis progresses, OATP-mediated uptake of gadoxetate- disodium is impaired in hepatocytes with reduced function or dysfunction.20,21 A recent experimental study in cirrhotic rats by Tsuda, et al. reported that up-regulation of MRP2 accompanied by morphological changes in bile canaliculi and microvilli might explain decreased hepatic parenchymal enhancement.22 Based on the above results, a limited number of advanced studies have reported on the diagnostic performance of gadoxetate-disodium-enhanced MRI in the prediction of the hepatic fibrosis stage.14.–16 However, the number of such studies is insufficient to determine the usefulness of gadoxetate-disodium-enhanced MRI in the prediction of the hepatic fibrosis stage.
Our study attempted to determine whether quantitative analysis of relative hepatic parenchymal enhancement using gadoxetate-disodium-enhanced 3T MRI could predict the hepatic fibrosis stage. Our results showed a significant negative correlation between CEI and the hepatic fibrosis stage (r = –0.545). The results of previous studies using gadoxetate-disodium also support this finding: Motosugi, et al. and Watanabe, et al. reported a correlation between CEI with histopathological fibrosis (r = –0.393 and r = –0.79, respectively).14,16
In our study, a significant difference in mean CEI was observed between the two groups F0–2 and F3–4. The discriminatory ability of hepatic fibrosis with F3 or greater is important, given that patients with advanced hepatic fibrosis or cirrhosis should be screened for portal hypertension and hepatocellular carcinoma.9,23 Gadoxetate-disodium-enhanced MRI showed statistically significant diagnostic performance in the discrimination of F3 or greater from F1–F2. When a CEI value of 1.3173 was used as the cut-off value, the adjusted AUROC in the prediction of F3 or greater was 0.73. The diagnostic performance of CEI in predicting other hepatic fibrosis stages was also statistically significant. In particular, in cirrhosis patients, when a CEI value of 1.3146 was used as the cut-off value, the adjusted AUROC was 0.84 (sensitivity, 82.9%; specificity, 84.6%). However, in the current study, the sensitivity of gadoxetate-disodium-enhanced MRI in the prediction of a fibrosis stage of F3 or lower was relatively low. In a meta-analysis by Wang, et al., when compared with MRE and DWI, the AUROCs of MRE and DWI in the prediction of moderate hepatic fibrosis were 0.98 and 083, respectively, and in severe hepatic fibrosis were 0.98 and 0.86, respectively.6 According to Martínez, et al., when compared with TE and APRI, the AUROCs of TE and APRI in the prediction of moderate hepatic fibrosis were 0.72–0.93 and 0.69–0.88, respectively, and in liver cirrhosis, were 0.87–0.98 and 0.61–0.94, respectively.5 Given the above results, diagnostic performance of gadoxetate-disodium-enhanced MRI in the prediction of hepatic fibrosis may appear to be inferior to that of MRE, DWI, and TE and similar or inferior to APRI. However, utilising gadoxetate-disodium-enhanced MRI in the prediction of the hepatic fibrosis stage is promising and provides a large amount of additional information, including basic anatomical imaging for morphological analysis, evaluation of focal hepatic lesions, and checking for bile duct obstructions. In addition, quantitative analysis of gadoxetate-disodium-enhanced MRI using a ROI measurement may be easier and faster than other MR techniques, such as ADC measurement using DWI or MRE. The major drawbacks of MRE are its cost and time-consuming effort.5 Using gadoxetate-disodium-enhanced MRI for hepatic fibrosis staging in addition to using it in combination with an indirect serum fibrosis marker may enhance clinicians’ confidence in predicting the hepatic fibrosis stage without additional equipment. Further studies on the control of confounding factors and the diagnostic added value of gadoxetate-disodium-enhanced MRI to previous known fibrosis markers are needed.
Our study has several limitations. First, the number of study subjects was small. An additional series with a larger sample size is needed. Second, we enrolled study subjects as two separate groups during two different periods, early (F0–F2; from Jan 2009 to Oct 2012) and advanced hepatic fibrosis (F3–F4; from Jan to Dec 2010). Although the reviewers were not aware of the separate enrolment of the study subjects or of any patient information, the possibility of test review bias cannot be excluded. Third, we included 22 patients in our study, who were histopathologically confirmed and staged for hepatic fibrosis based on segmentectomy or wedge resection. Unless the safety margin of the surgically resected specimen is sufficient, the tumour can affect hepatic fibrosis staging. It would have been worthwhile to study whether the hepatic fibrosis stage of patients had been histopathologically proven based only on multifocal liver parenchyma biopsy. In addition, we did not consider the sampling variability of hepatic fibrosis based on biopsy length or location. As demonstrated in earlier studies, actual liver biopsy length or location can impact the degree of observed hepatic fibrosis. Smaller length biopsy specimens can reduce the accuracy of fibrosis surrogate markers, and biopsy specimens in the subcapsular area usually reveal more severe fibrotic changes than in the central-deep portion of the liver, which is used as the reference standard.24,25 In this study, the number of study subject was too small to investigate how large an effect of these factors had upon the accuracy of gadoxetate-disodium-enhanced MRI. A prospective study that considers the sampling variability on biopsy length and location is required to minimise this bias. In addition, in this study, a significant difference of hepatic fibrosis staging was observed between core and wedge biopsy samples. This may be because all subjects who were proven the degree of hepatic fibrosis stage on wedge biopsy sample were patients with hepatocellular carcinoma. Therefore, it may be the possibility that patients with relatively well preserved hepatic function or a lower hepatic fibrosis stage underwent hepatic resection in order to avoid post-hepatectomy liver failure. Fourth, we did not consider confounding factors that influenced MR SI, such as factors associated with the MR imaging system, or patient status or laboratory data.11,15,26,27 In patients with liver cirrhosis, sarcopenia as well as fatty infiltration of skeletal muscle may have occurred, and this factor can also affect the prediction of hepatic fibrosis. However, because the aim of our study was to evaluate the diagnostic performance of gadoxetate-disodium-enhanced 3T MRI in predicting the hepatic fibrosis stage, such confounding factors were beyond the scope of our study. Further studies that control for presumed confounding parameters are needed.
Despite the limitations of the study, we determined that quantitative analysis of relative hepatic parenchymal enhancement using gadoxetate-disodium-enhanced 3T MRI can predict the hepatic fibrosis stage. However, additional studies are required.
AcknowledgementThis research was supported by Basic Science Research Program through the National Research Foundation (NRF) of Korea funded by the Ministry of Education, Science and Technology (2012005117).


