


Objective. Angiotensin II, one component of renin-angiotensin system (RAS), is formed from Ang I by the catalysing of angiotensin converting enzyme (ACE). Angiotensin II plays an important role in the development of insulin resistance. ACE2, a homologue of ACE, couterregulate the actions of angiotensin II by facilitating its breakdown to angiotensin-(1–7). RAS has been implicated in the pathogenesis of non-alcoholic steatohepatitis (NASH). Earlier demonstration that thiazolidinediones (TZDs) improve steatohepatitis promoted us to evaluate the change of hepatic ACE2 expression in rats with high fat diet (HFD)-induced NASH and the effects of TZDs on the hepatic ACE2 expression.
Material and methods. Rats were divided into normal control group, high fat diet (HFD) group, and pioglitazone group. After 24 weeks of treatment with pioglitazone, a TZD, we evaluated changes in liver histology, insulin sensitivity, lipid metabolism, circulating RAS levels and hepatic ACE2 expression.
Results. Compared with normal controls, the concentrations of serum lipid, aminotransaminase, glucose, insulin, ACE, angiotensin II, ACE2, angiotensin-(1–7) and the degree of hepatic ACE2 expression were significantly higher in rats with HFD-induced NASH. Pioglitazone significantly reduced the concentrations of serum lipid, aminotransaminase, glucose, insulin, ACE, angiotensin II while markedly raised the concentrations of serum ACE2, angiotensin-(1–7) and the degree of hepatic ACE2 expression.
Conclusion. Hepatic ACE2 expression markedly increased in rats with HFD-induced NASH and was further upregulated by pioglitazone. Hepatic ACE2 may be a new target of pioglitazone treatment for NASH.
Non-alcoholic fatty liver disease (NAFLD) is now the most common liver disease in China. It includes a spectrum of liver damage ranging from simple steato-sis, non-alcoholic steatohepatitis (NASH: steatosis with lobular inflammation and hepatocyte ballooning) to cirrhosis.1 NASH is the linchpin between simple steatosis and cirrhosis in the spectrum of NA-FLD.2 Meanwhile, the probability of developing liver fibrosis is greater in patients with NASH than in those with simple steatosis.3 Till now, there is no widely accepted treatment for NASH.
Insulin resistance (IR) is thought to be an essential mechanism for the pathogenesis of NASH.4,5 The renin-angiotensin system (RAS) is a key regulator of hydro-electrolytic balance and blood pressure.6 Angiotensin (Ang) II is formed from Ang I by the catalysing of angiotensin converting enzyme (ACE) and mediates a number of diverse effects by binding to the Ang II type-1 receptor (AT1). ACE2, a homologue of ACE, catalyses the conversion of Ang II to an ‘alternative’ effector of RAS, Ang-(1–7).7,8 Study indicates that RAS is involved in the pathogenesis of IR.9 Ang II can promote IR, whereas Ang-(1–7) may improve IR by opposing the effects of Ang II.10,11 Apart from the circulating RAS, the existence of local RAS has also been described in liver and pancreas since its original detection in heart and kidney. Hepatic ACE2 is significantly elevated in the bile duct-ligated (BDL) rats characterized by experimental biliary fibrosis, which represents a counter-regulatory response to RAS-mediated liver injury.12,13 Hepatic ACE2 may directly antagonize RAS by degrading Ang II or through altering the expression of peroxisome proliferator-activated receptor γ (PPARγ) to improve IR.14 Thiazolidinediones (TZDs), the PPARγ agonists, including pioglitazone and rosiglitazone, are originally used in the treatment of type 2 diabetes melli-tus (T2DM) as insulin sensitizers.15 Over the past several years, studies indicate that TZDs may be beneficial in the treatment of NASH. TZDs improve hepatic steatosis by stimulating hepatic fatty acid oxidation and inhibiting de novo lipogenesis via the activation of adenosine monophosphate-activated protein kinase (AMPK) signaling pathway.16 However, the hepatic ACE2 expression during the treatment with TZDs in NASH has not previously been studied. The TZD used in the present study was pio-glitazone and we aimed to detect:
- •
The change of hepatic ACE2 expression in rats with HFD-induced NASH, and
- •
The effects of pioglitazone on hepatic ACE2 expression.
Experimental procedures were carried out in accordance with the Guide for the Care and Use of Laboratory Animals (Animal Research Laboratary, Chongqing Medical University), and the study protocol was approved by the Animal Research Committee of Chongqing Medical University.
Eight-week-old male Sprague-Dawley (SD) rats, weighing 110–120 g, were maintained in a room under controlled temperature (20–22 °C) with a 12 h day/12 h night cycle. After being fed normal chow for one week to adapt to vivarium conditions, the rats were randomly divided into three groups:
- •
Normal control group (NC group, n = 10) were maintained on the standard chow and gavaged with normal saline.
- •
High fat diet group (HD group, n = 10) were maintained on the high fat diet (HFD) (15% lard oil and 2% pure cholesterol were added to the standard chow. SLAC Laboratory Animal Co., Ltd., Shanghai, China) and gavaged with normal saline according to Fan, et al.17
- •
Pioglitazone intervention group (HP group, n = 10) were maintained on the HFD and gavaged with pioglitazone for 24 weeks according to Lee, et al. (10 mg/kg per day; Conba Pharmaceutical Co., Ltd., Zhejiang, China).18
According to Kleiner, et al.,19 hematoxylin and eosin (H&E)-stained sections were scored blindly for the degree of steatosis, lobular inflammation and he-patocyte ballooning.
Biochemical assaysAlanine aminotransferase (ALT), aspartate aminotransferase (AST), alkaline phosphatase (ALP), triglyceride (TG), total cholesterol (TC), high density lipoprotein-cholesterol (HDL-C), low density lipoprotein-cholesterol (LDL-C), free fatty acid (FFA) and fasting blood glucose (FBG) concentrations were measured using a biochemical kit with an autobiochemical analysis apparatus (Hitachi, Tokyo, Japan). Fasting insulin (FINS) concentration was determined using an insulin radioimmunoassay (RIA) kit (Beijing Atom High Tech, Beijing, China) with a fully automated rRIA-immunity analyser (Xi’an Nuclear Instrument Factory, Xi’an, China). Insulin sensitivity was estimated using the homeostasis model assessment of insulin resistance (HOMA-IR):20
FBG (mmol/L) x FINS (mU/L)/22.5.
Concentrations of Ang II and Ang-(1–1) (mybio-source, San Diego, USA), angiotensin converting enzyme (ACE) and ACE2 (Life Sciences Advanced Technologies, Inc., Petersburg, USA) were quantified using enzyme-linked immunosorbent assay (ELISA) kits.
mRNA amplificationAfter treating all glassware with diethyl pyrocarbonate (DEPC) to inhibit RNases, total RNA was extracted from liver tissues using Trizol reagents (TaKaRa, Dalian, China). Total RNA was quantified by ultraviolet spectroscopy and reverse transcripta-se-polymerase chain reaction assay was performed using the ACE2 primer (Forward primer: 5’-gac aac ttc ttg aca gcc catc-3’. Reverse primer: 5’-acc atc cac ctc cac ttc tcta-3’). β-actin (Forward primer: 5’-cct gaa gta ccc cat tga acac-3'. Reverse primer: 5’-ctc att gcc gat agt gat gacc-3’) was used as an endogenous control gene for normalization. Amplification conditions for ACE2 and β-actin were 5 min at 94 °C, followed by 38 cycles of 30 s at 94 °C, 30 s at 55 °C and 45 s at 72 °C. 5 of each PCR product was subjected to 2% agarose gel electrophoresis and staining with GoldView (Viswagen Biotech, Kerala, India). The gel was scanned using an imaging system (Bio-Rad, Hercules, CA, USA) and optical density determined with Quantity One (Bio-Rad Laboratories, California, USA). Experiments were replicated five times.
Western blot analysisTotal proteins were extracted from liver tissues with RIPA (Radio-Immunoprecipitation Assay) lysis buffer (Bioteke, Beijing, China), and separated by sulfate-polyacrylamide gel electrophoresis (SDS-PAGE). Proteins were subsequently transferred to polyvinylidene difluoride membranes (Millipore, Billerica, MA, USA). The blots were blocked with 5% non-fat milk solution for 1 h at room temperature and then incubated over night at 4°C with different antibodies against phosphorylated AMP-activated protein kinase (p-AMPK, Epitomics, California, USA), phosphorylated 3–hydroxy-3–methylglutaryl-coenzyme A reductase (phosphorylated HMG-CoA reductase, Millipore, Massachusetts, USA), phos-phorylated Acetyl-CoA carboxylase 1 (p-ACC1, Cell Signaling Technology, Inc., Boston, USA), carnitine palmitoyltransferase 1 (CPT1, Santa Cruz Biotechnology, Inc., California, USA), ACE2 (Epitomics, California, USA), and incubated with peroxidase conjugated goat anti-rabbit IgG secondary antibody (MultiSciences Biotech Co., Ltd., Hangzhou, China). Immunoreactivity was detected by enhanced chemiluminescence detection kit (Keygen, Nanjing, China). The band density was normalized to the corresponding density of β-actin (4A Biotoch Co., Ltd., Beijing, China).
Statistical analysisAll data are expressed as means ± SD. Multiple group comparisons were performed using one-way analysis of variance (ANOVA), followed by Tukey-Kramer post-hoc test. All calculations were performed with SPSS version 17.0 (SPSS, Chicago, IL, USA). Significance was assumed at P < 0.05.
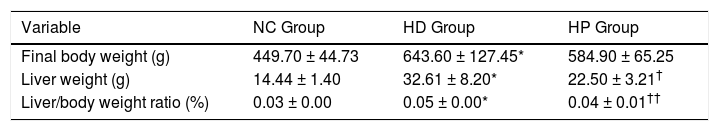
RESULTSEffects of pioglitazone on liver weight, body weight and liver histologyFinal body weight, liver weight and ratio of liver weight to body weight were significantly higher in the HD group compared with the NC group (P < 0.001) (Table 1). Liver weight (P < 0.01) and ratio of liver weight to body weight (P < 0.001) were significantly lower in the HP group compared with the HD group (Table 1), whereas final body weight was not significantly different between the HP and HD groups (P > 0.05) (Table 1).
Data for body weight, liver weight in the normal control (NC group), high fat diet (HD group), and pioglitazone intervention groups (HP group).
| Variable | NC Group | HD Group | HP Group |
|---|---|---|---|
| Final body weight (g) | 449.70 ± 44.73 | 643.60 ± 127.45* | 584.90 ± 65.25 |
| Liver weight (g) | 14.44 ± 1.40 | 32.61 ± 8.20* | 22.50 ± 3.21† |
| Liver/body weight ratio (%) | 0.03 ± 0.00 | 0.05 ± 0.00* | 0.04 ± 0.01†† |
Data are the mean ± SD.
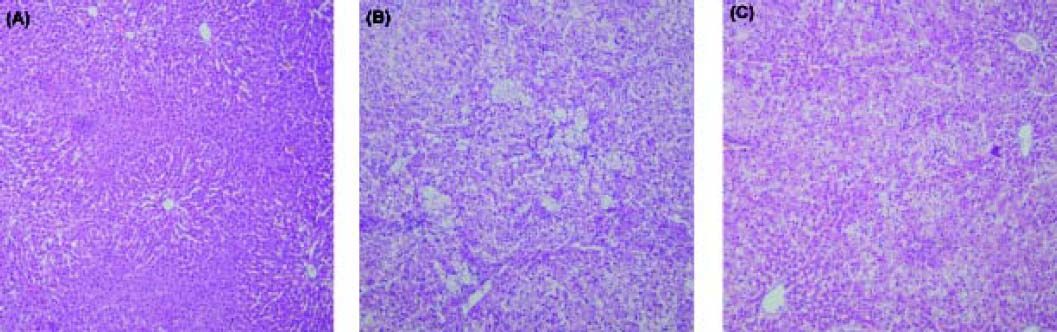
All liver tissues were analyzed with H&E staining (Figure 1). The histological changes in the NC group were within normal limits. In the HD group, macrovesicular steatosis occupied 33 to 66% of the total area (mean score 2.9 ± 0.2). On average, there were 2 to 4 foci of lobular inflammation per x 200 field (mean score 2.3 ± 0.6), and few ballooned cells (mean score 0.8 ± 0.6) in the HD group. After 24 weeks of treatment with pioglitazone, significant improvement was observed in steatosis (mean score 1.4 ± 0.5, P < 0.05), lobular inflammation (mean score 1.0 ± 0.3, P < 0.05) and hepatocyte ballooning (mean score 0.4 ± 0.3, P < 0.05).
 the normal control group (NC group), (B) the high fat diet group (HD group), (C) the pioglitazone intervention group (HP group). The histological changes in rat liver in the NC group were within normal limits (A). Severe steatosis was found in rat liver in the HD group (B). Significant improvement in steatosis was found in rat liver in the HP group (C). Haematoxylin and eosin; original magnification x10.")
Histopathological findings in (A) the normal control group (NC group), (B) the high fat diet group (HD group), (C) the pioglitazone intervention group (HP group). The histological changes in rat liver in the NC group were within normal limits (A). Severe steatosis was found in rat liver in the HD group (B). Significant improvement in steatosis was found in rat liver in the HP group (C). Haematoxylin and eosin; original magnification x10.
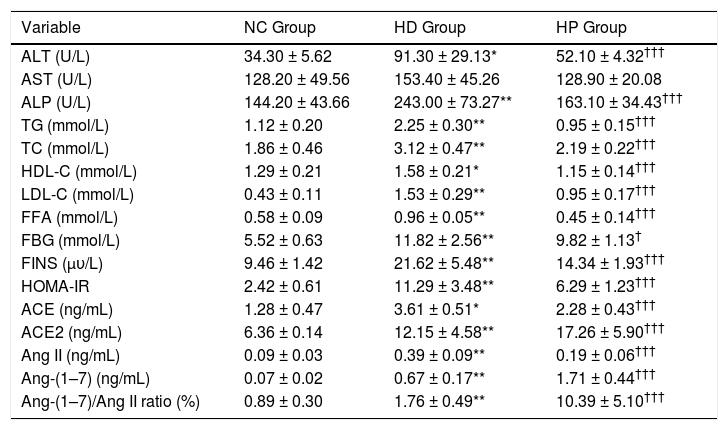
The HOMA-IR (P < 0.001) and concentrations of serum ALT (P < 0.01), ALP (P < 0.001), TG (P < 0.001), TC (P < 0.001), HDL-C (P < 0.01), LDL-C (P < 0.001), FFA (P < 0.001), FBG (P < 0.001), FINS (P < 0.001), ACE (P < 0.01), ACE2 (P < 0.001), Ang II (P < 0.001), Ang-(1–7) (P < 0.001) and ratio of Ang-(1–7) to Ang II (P < 0.001) were significantly higher in the HD group compared with the NC group. Serum AST concentration was not significantly different between the HD and NC groups (P > 0.05) (Table 2). The HOMA-IR (P < 0.001) and concentrations of serum ALT (P < 0.001), ALP (P < 0.001), TG (P < 0.001), TC (P < 0.001), HDL-C (P < 0.001), LDL-C (P < 0.001), FFA (P < 0.001), FBG (P < 0.05), FINS (P < 0.001), ACE (P < 0.001) and Ang II (P < 0.001) were significantly lower in the HP group compared with the HD group, whereas ACE2 (P < 0.001), Ang-(1–7) (P < 0.001) and ratio of Ang-(1–7) to Ang II (P < 0.001) were significantly higher. Serum AST concentration was not significantly different between the HD and HP groups (P > 0.05) (Table 2).
Data for biochemical characteristics, angiotensin converting enzyme, angiotensin converting enzyme 2, angiotensin II, angiotensin-(1–7) concentrations and ratio of angiotensin-(1–7) to angiotensin II in the normal control (NC group), high fat diet (HD group), and pioglitazone intervention groups (HP group).
| Variable | NC Group | HD Group | HP Group |
|---|---|---|---|
| ALT (U/L) | 34.30 ± 5.62 | 91.30 ± 29.13* | 52.10 ± 4.32††† |
| AST (U/L) | 128.20 ± 49.56 | 153.40 ± 45.26 | 128.90 ± 20.08 |
| ALP (U/L) | 144.20 ± 43.66 | 243.00 ± 73.27** | 163.10 ± 34.43††† |
| TG (mmol/L) | 1.12 ± 0.20 | 2.25 ± 0.30** | 0.95 ± 0.15††† |
| TC (mmol/L) | 1.86 ± 0.46 | 3.12 ± 0.47** | 2.19 ± 0.22††† |
| HDL-C (mmol/L) | 1.29 ± 0.21 | 1.58 ± 0.21* | 1.15 ± 0.14††† |
| LDL-C (mmol/L) | 0.43 ± 0.11 | 1.53 ± 0.29** | 0.95 ± 0.17††† |
| FFA (mmol/L) | 0.58 ± 0.09 | 0.96 ± 0.05** | 0.45 ± 0.14††† |
| FBG (mmol/L) | 5.52 ± 0.63 | 11.82 ± 2.56** | 9.82 ± 1.13† |
| FINS (μυ/L) | 9.46 ± 1.42 | 21.62 ± 5.48** | 14.34 ± 1.93††† |
| HOMA-IR | 2.42 ± 0.61 | 11.29 ± 3.48** | 6.29 ± 1.23††† |
| ACE (ng/mL) | 1.28 ± 0.47 | 3.61 ± 0.51* | 2.28 ± 0.43††† |
| ACE2 (ng/mL) | 6.36 ± 0.14 | 12.15 ± 4.58** | 17.26 ± 5.90††† |
| Ang II (ng/mL) | 0.09 ± 0.03 | 0.39 ± 0.09** | 0.19 ± 0.06††† |
| Ang-(1–7) (ng/mL) | 0.07 ± 0.02 | 0.67 ± 0.17** | 1.71 ± 0.44††† |
| Ang-(1–7)/Ang II ratio (%) | 0.89 ± 0.30 | 1.76 ± 0.49** | 10.39 ± 5.10††† |
Data are the mean ± SD.
p < 0.001 compared with the high fat diet group (HD group). ALT: alanine aminotransferase. AST: aspartate aminotransferase. ALP: alkaline phosphatase. TG: triglyceride. TC: total cholesterol. HDL-C: high density lipoprotein-cholesterol. LDL-C: low density lipoprotein-cholesterol. FFA: free fatty acid. FBG: fasting blood glucose. FINS: fasting insulin. HOMA-IR: homeostasis model assessment of insulin resistance. ACE: angiotensin converting enzyme. ACE2: angiotensin converting enzyme 2. Ang II: angiotensin-II. Ang-(1–7): angiotensin-(1–7).
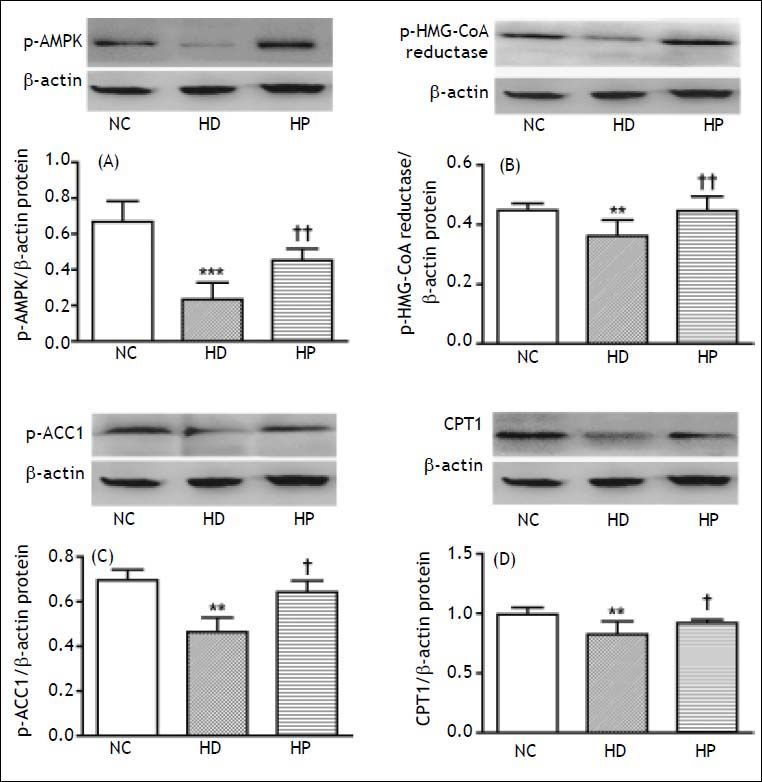
p-AMPK is a measure of AMPK. p-ACC1 and p-HMG-CoA reductase are inactive forms of ACC1 and HMG-CoA reductase. p-ACC1 and p-HMG-CoA re-ductase vary inversely with ACC1 and HMG-CoA reductase activities. The hepatic protein expression of p-AMPK (P < 0.001), p-HMG-CoA reductase (P < 0.01), p-ACC1 (P < 0.01) and CPT1 (P < 0.01) were significantly lower in the HD group compared with the NC group (Figure 2). The hepatic protein expression of p-AMPK (P < 0.01), p-HMG-CoA reductase (P < 0.01), p-ACC1 (P < 0.05) and CPT1 (P < 0.05) were significantly higher in the HP group compared with the HD group (Figure 2).
 is a measure of AMPK. Phosphorylated ACC1 (p-ACC1) and phos-phorylated HMG-CoA reduc-tase (p-HMG-CoA reductase) are inactive forms of ACC1 and HMG-CoA reductase. p-ACC1 and p-HMG-CoA reductase vary inversely with ACC1 and HMG-CoA reductase activities. Effects of pioglitazone on hepatic protein expression of (A) p-AMPK, (B) p-HMG-CoA reduc-tase, (C) p-ACC1, (D) carnitine palmitoyltransferase 1 (CPT1) in the high fat diet (HFD)-fed non-alcoholic steatohepatitis (NASH) rats: normal control group (NC group), high fat diet group (HD group) and pio-glitazone intervention group (HP group). Data are the mean ± SD. ** P < 0.01, *** P < 0.001 compared with the NC group; † P < 0.05, †† P < 0.01 compared with the HD group. A. The hepatic protein expression of p-AMPK was significantly lower in the HD group compared with the NC group (*** P < 0.001), but was significantly higher in the HP group compared with the HD group (††P < 0.01). B. The hepatic protein expression of p-HMG-CoA re-ductase was significantly lower in the HD group compared with the NC group (**P < 0.01), but was significantly higher in the HP group compared with the HD group (†† P < 0.01). C. The hepatic protein expression of p-ACC1 was significantly lower in the HD group compared with the NC group (** P < 0.01), but was significantly higher in the HP group compared with the HD group (†P < 0.05). D. The hepatic protein expression of CPT1 was significantly lower in the HD group compared with the NC group (** P < 0.01), but was significantly higher in the HP group compared with the HD group (†P < 0.05).")
Phosphorylated AMPK (p-AMPK) is a measure of AMPK. Phosphorylated ACC1 (p-ACC1) and phos-phorylated HMG-CoA reduc-tase (p-HMG-CoA reductase) are inactive forms of ACC1 and HMG-CoA reductase. p-ACC1 and p-HMG-CoA reductase vary inversely with ACC1 and HMG-CoA reductase activities. Effects of pioglitazone on hepatic protein expression of (A) p-AMPK, (B) p-HMG-CoA reduc-tase, (C) p-ACC1, (D) carnitine palmitoyltransferase 1 (CPT1) in the high fat diet (HFD)-fed non-alcoholic steatohepatitis (NASH) rats: normal control group (NC group), high fat diet group (HD group) and pio-glitazone intervention group (HP group). Data are the mean ± SD. ** P < 0.01, *** P < 0.001 compared with the NC group; † P < 0.05, †† P < 0.01 compared with the HD group. A. The hepatic protein expression of p-AMPK was significantly lower in the HD group compared with the NC group (*** P < 0.001), but was significantly higher in the HP group compared with the HD group (††P < 0.01). B. The hepatic protein expression of p-HMG-CoA re-ductase was significantly lower in the HD group compared with the NC group (**P < 0.01), but was significantly higher in the HP group compared with the HD group (†† P < 0.01). C. The hepatic protein expression of p-ACC1 was significantly lower in the HD group compared with the NC group (** P < 0.01), but was significantly higher in the HP group compared with the HD group (†P < 0.05). D. The hepatic protein expression of CPT1 was significantly lower in the HD group compared with the NC group (** P < 0.01), but was significantly higher in the HP group compared with the HD group (†P < 0.05).
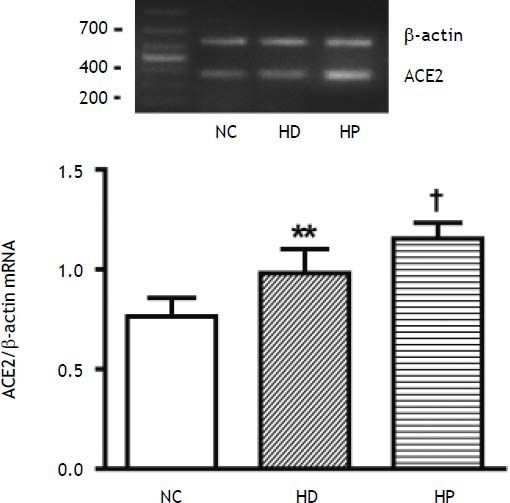
The hepatic expression of ACE2 mRNA was significantly higher in the HD group compared with the NC group (P < 0.01) (Figure 3). The hepatic expression of ACE2 mRNA was significantly higher in the HP group compared with the HD group (P < 0.05) (Figure 3).
 2 mRNA expression in the high fat diet (HFD)-fed non-alcoholic steatohepatitis (NASH) rats: normal control group (NC group), high fat diet group (HD group) and pioglitazone intervention group (HP group). Data are the mean ± SD. **P < 0.01 compared with the NC group; †P < 0.05 compared with the HD group. The hepatic expression of ACE2 mRNA expression was significantly higher in the HD group compared with the NC group (**P < 0.01), and was much higher in the HP group compared with the HD group (fP < 0.05).")
Effects of pioglitazone on hepatic angiotensin converting enzyme (ACE) 2 mRNA expression in the high fat diet (HFD)-fed non-alcoholic steatohepatitis (NASH) rats: normal control group (NC group), high fat diet group (HD group) and pioglitazone intervention group (HP group). Data are the mean ± SD. **P < 0.01 compared with the NC group; †P < 0.05 compared with the HD group. The hepatic expression of ACE2 mRNA expression was significantly higher in the HD group compared with the NC group (**P < 0.01), and was much higher in the HP group compared with the HD group (fP < 0.05).
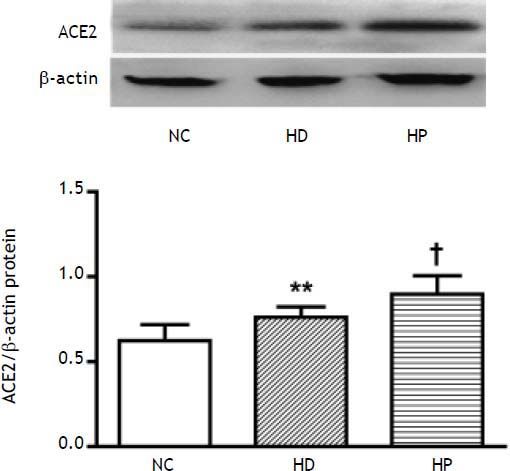
The hepatic protein expression of ACE2 (P < 0.01) was significantly higher in the HD group compared with the NC group (Figure 4), and also higher in the HP group compared with the HD group (P < 0.05) (Figure 4).
 2: normal control group (NC group), high fat diet group (HD group) and pioglitazone intervention group (HP group). Data are the mean ± SD. ** P < 0.01 compared with the NC group; † P < 0.05 compared with the HD group. The hepatic protein expression of ACE2 was significantly higher in the HD group compared with the NC group (** P < 0.01), and was much higher in the HP group compared with the HD group († P < 0.05).")
Effects of pioglitazone on hepatic protein expression of angiotensin converting enzyme (ACE) 2: normal control group (NC group), high fat diet group (HD group) and pioglitazone intervention group (HP group). Data are the mean ± SD. ** P < 0.01 compared with the NC group; † P < 0.05 compared with the HD group. The hepatic protein expression of ACE2 was significantly higher in the HD group compared with the NC group (** P < 0.01), and was much higher in the HP group compared with the HD group († P < 0.05).
In our study, the rats fed the HFD showed increased HOMA-IR, circulating concentrations of ALT, ALP, TG, TC and FFA, severe macrovesicular steatosis and steatohepatitis. Treatment with pioglitazone significantly improved steatohepatitis, decreased HOMA-IR, circulating concentrations of ALT, ALP, TG, TC and FFA in the HFD-fed rats. These results indicate that pioglitazone improves liver histology by improving IR and diminishing FFA-induced hepatic fat deposition in rats with HFD-induced NASH. Dysfunctional adipose tissue impairs glucose and lipid homeostasis partially by FFA-induced ectopic fat deposition. It is well known that IR and FFA-induced metabolic abnormalities are key mechanisms for the development of NAFLD/NASH. By activating the PPARγ TZDs can increase insulin sensitivity by promoting adipo-cyte differentiation, increasing peripheral adipose tissue mass and decreasing ectopic lipid depo-sition.21,22 In our study, we also found that the HFD-fed rats showed weight gain. And treatment with pioglitazone decreased the liver weight and ratio of liver weight to body weight, without decreasing the body weight. Weight gain is a common side effect associated with TZDs, which appears to be caused by the increased peripheral fat deposi-tion.23 Taken together, our findings suggest that in the HFD-fed rats, pioglitazone may not significantly reduce the body weight because it can reduce hepatic fat deposition while simultaneously increasing peripheral fat deposition.
In the present study, we observed that hepatic AMPK activity is downregulated in rats with HFD-induced NASH, and treatment with pioglitazone significantly upregulates hepatic AMPK and CPT1 activities, whereas downregulates hepatic ACC1 and HMG-CoA reductase activities in these rats. AMPK plays a pivotal role in the control of hepatic lipid metabolism. Activation of AMPK in the liver results in the stimulation of fatty acid oxidation and inhibition of lipogenesis. ACC and HMG-CoA reductase are downstream targets for AMPK. ACC and HMG-CoA reductase are, respectively, key enzymes in fatty acid and cholesterol synthesis. There are two major isoforms of ACC, ACC1 and ACC2, in the liver. The malonyl-CoA synthesized by ACC1 is used in fatty acid synthesis. Inhibition of ACC1 by AMPK results in a fall in malonyl-CoA content and a subsequent decrease in fatty acid synthesis and increase in mitochondrial fatty acid oxidation via the regulation of CPT1. TZDs have been demonstrated to activate AMPK in cultured cells. Saha, et al., reported that treatment with pioglitazone activates AMPK in rat liver and adipose tissue in vivo, an effect that is marked in rodents in which AMPK activity is de-pressed.24 Our data are in accordance with these observations. All these findings indicate that pioglitazone improves hepatic steatosis by stimulating fatty acid oxidation and inhibiting lipogenesis and cholesterol synthesis via activation of hepatic AMPK signaling pathway in rats with HFD-induced NASH.
In our study, the rats on the HFD presented increased concentrations of circulating ACE, Ang II and ACE2, and especially a major rise in circulating Ang-(1–7) concentrations. Treatment with pioglitazone significantly decreased concentrations of circulating ACE, Ang II and increased concentrations of circulating ACE2 and Ang-(1–7) in rats with HFD-induced NASH. It has been documented that ACE2 and its product, Ang-(1–7), have a counter-regulatory effect of ACE and its product, Ang II. Ang II may promote IR by (i) inhibiting adipocyte differentiation, (ii) modulating the insulin signal transduc-tion, (iii) lowering the sensitivity of target tissues to insulin and (iv) promoting the synthesis of cytoki-nes with negative effects on insulin signal.25.–27 In contrast to Ang II, Ang-(1–7) improves IR.13 Accordingly, manipulation of RAS by either downregulation of ACE and Ang II, or upregulation of ACE2 and Ang-(1–7) could have therapeutic potentials on IR. In the diseased liver, not only ACE and Ang II but also ACE2 and Ang-(1–7) are upregulated.11,12 Local RAS, rather than systemic RAS, is reported to play a role in tissue repair and fibrogenesis.28.–30 Studies showed that hepatic steatosis upregulates the hepatic expression of components of the RAS, including ACE and Ang II, which promotes inflammation, fibrogenesis and elevates the portal pressure.31,32 And ACE2 is reported to result in a reduction in the portal pressure by converting Ang II into Ang-(1–7) in rat liver.32 Angiotensin-converting enzyme inhibitors (ACEIs) and angiotensin II receptor blockers (ARBs) are used as first lines of anti-hypertensive treatment. Studies found that ACEIs and ARBs ameliorate hepatic steatosis and fibrosis via enhancing the expression of ACE2 and Ang-(1– 7).14,33 Moreover, ARBs are reported to be effective in reducing portal hypertension in patients with cir-rhosis.34 In our study, we have not estimated the effects of pioglitazone on treating animals with already established hepatic steatosis/NASH. And we have no evidence that pioglitazone might improve hepatic steatosis/NASH in patients. However, Uto, et al., reported that pioglitazone significantly ameliorates fat accumulation and fibrosis in rats with already established hepatic steatosis/NASH induced by a choline-deficient, l-amino acid-defined diet.35 And studies also showed that pioglitazone leads to the metabolic and histologic improvement in subjects with biopsy-proven NASH.36,37
In conclusion, TZDs ameliorate hepatic steatosis by improving insulin resistance, modulating hepatic lipid metabolism via activation of hepatic AMPK signaling pathway, and upregulating hepatic ACE2 expression in rats with HFD-induced NASH. Hepatic ACE2 may be a new target of pioglitazone treatment for NASH. These findings provide evidence to suggest that TZDs may assist in the treatment of NASH patients. But in the Pioglitazone versus Vitamin E versus Placebo for the Treatment of Nondia-betic Patients with Nonalcoholic Steatohepatitis (PIVENS) trial, pioglitazone has been shown no significant improvement in fibrosis whereas has significant benefits for some secondary outcomes including changes in serum aminotransferase levels, anthro-pometric measures, and insulin resistance and lipid profiles in the nondiabetic patients with NASH.38 Over the past years, the results of studies with TZDs in NASH patients have been overall promising. However, still many questions remain:
- •
Different TZDs, including pioglitazone and rosi-glitazone, may not be the same for the treatment of NASH.
- •
Patients with type 2 diabetes mellitus (T2DM) have a higher risk of steatohepatitis, fibrosis and cirrhosis than those without T2DM. Whether pioglitazone is equally effective in improving hepatic histology in patients without T2DM and in patients with T2DM or impaired glucose tolerance?
- •
Who should be the best candidates for treatment, NASH patients with or without other metabolic abnormalities?
- •
Whether TZD treatment for NASH patients has to be permanent or is expected to keep beneficial after withdrawl?
Clearly, more works are needed regarding the efficacy, mechanism and safety of the TZDs in NASH animal models and patients.
Abbreviations- •
ACE: angiotensin converting enzyme.
- •
ACEIs: angiotensin-converting enzyme inhibitors.
- •
ALP: alkaline phosphatase.
- •
ALT: alanine aminotransferase.
- •
AMPK: adenosine monophosphate-activated protein kinase.
- •
Ang: angiotensin.
- •
ANOVA: one-way analysis of variance.
- •
ARBs: angiotensin II receptor blockers.
- •
AST: aspartate aminotransferase.
- •
ATI: Ang II type-1 receptor.
- •
BDL: bile duct-ligated.
- •
DEPC: diethyl pyrocarbonate.
- •
ELISA: enzyme-linked immunosorbent assay.
- •
FBG: fasting blood glucose.
- •
FFA: free fatty acid.
- •
FINS: fasting insulin.
- •
H&E: hematoxylin and eosin.
- •
HDL-C: high density lipoprotein-cholesterol.
- •
HFD: high fat diet.
- •
HOMA-IR: homeostasis model assessment of insulin resistance.
- •
HP group: pioglitazone intervention group.
- •
IR: insulin resistance.
- •
LDL-C: low density lipoprotein-cholesterol.
- •
NAFLD: non-alcoholic fatty liver disease.
- •
NASH: non-alcoholic steatohepatitis.
- •
NC group: normal control group.
- •
PIVENS: Pioglitazone versus Vitamin E versus Placebo for the Treatment of Nondiabetic Patients with Nonalcoholic Steatohepatitis.
- •
PPARγ: peroxisome proliferator-activated receptor γ.
- •
RAS: renin-angiotensin system.
- •
RIA: radioimmunoassay.
- •
SD: Sprague-Dawley.
- •
T2DM: type 2 diabetes mellitus.
- •
TC: total cholesterol.
- •
TG: triglyceride.
- •
TZDs: thiazolidinediones.


