


Aim. The present study aimed to evaluate the changes in the serum N-glycome profiles in chronic hepatitis B (CHB) patients and to assess the role of N-glycome-derived markers in the noninvasive diagnosis of liver fibrosis.
Materials and Methods. After liver biopsy for pathological grading and staging, 128 CHB patients underwent serum N-glycomic analysis using DNA sequencer-assisted fluorophore-assisted carbohydrate electrophoresis (DSA-FACE) and sensitive markers were screened.
Results. Peaks 1, 2, 8 and 10 in the N-glycome profiles could, to some extents, distinguish liver fibrosis at different stages. In addition, the N-glycome-derived marker log(peak2/peak8) possessed the highest diagnostic accuracy. The areas under the receiver operating characteristic (AUROCs) curves of the log(peak2/peak8) were 0.675, 0.736 and 0.754 in the diagnosis of significant fibrosis, advanced fibrosis and early cirrhosis, respectively. In combination with some marker panels (SLFG, S index, Fibrometer, Hui, Forns, APRI and Hepascore), it showed the best diagnostic potency in distinguishing significant fibrosis (SLFG + log[peak2/peak8], AUROC = 0.813) from advanced fibrosis (SLFG + log[peak2/peak8], AUROC = 0.899) and a better diagnostic potency in the identification of early cirrhosis (S index + log[peak2/peak8], AUROC = 0.903, lower than Hui model [AUROC = 0.927]) in the validation cohort.
Conclusions. N-glycomic changes are present in the serum of CHB patients with liver fibrosis, and N-glycan profiling is a noninvasive and effective tool to assess the liver fibrosis, especially in combination with serum marker panels.
Chronic hepatitis B virus (HBV) infection is a major cause of chronic liver disorders and usually leads to liver fibrosis and cirrhosis.1,2 Patients with HBV infection ultimately die of end-stage liver diseases or develop hepatocellular carcinoma.3 The early prevention of liver damage and anti-fibrotic treatment can efficiently delay the progression of liver disorders. Therefore, the assessment of liver fibrosis is a critical step in the treatment of chronic liver diseases. Liver biopsy is the gold standard in the diagnosis of fibrosis. However, it is invasive and has sampling error and inconsistency between different observers and other shortcomings. These shortcomings significantly limit the wide application of liver biopsy in the diagnosis of diseases such as chronic hepatitis B.4 Therefore, it is imperative to find convenient and noninvasive indicators for the clinical diagnosis of liver diseases. In the last decade, diagnostic models using combined serum markers have become an interest area in the studies on liver fibrosis. Models for the diagnosis of chronic hepatitis C (CHC), including Fibrotest,5 Forns index,6 aspartate aminotransferase (AST) to platelet ratio index (APRI)7 and Hepascore,8 and models for the diagnosis of chronic hepatitis B (CHB) including SLFG model,9 and Hui’ model10 have been used as new diagnostic tests. In our previous study, results demonstrated these models have a diagnostic value for liver fibrosis, to some extents,11 although the sensitivity and specificity of serum markers alone do not fully meet the clinical requirements.
In addition to plasma cells, hepatocytes are the main source of serum glycoproteins, as the liver in volves in the clearance of proteins with aberrant glycosylation. Therefore, liver disorders may cause changes in the serum glycoprotein profiles. The complexity of the glycan structure has impeded the study on serum glycomics. Fortunately, Callewaert, et al.12 developed a novel technique using DNA sequencer-assisted fluorophore-assisted carbohydrate electrophoresis (DSA-FACE) for the systemic and rapid analysis of N-glycan profiles. Since then, DSA-FACE has been applied in the diagnosis of liver cirrhosis13 and hepatocellular carcinoma (HCC).14 Callewaert, et al.13 found that peak 7 increased, while peak 8 decreased in patients with liver cirrhosis when compared with those in normal population. The derived variable log(peak7/peak8) (GlycoCirrho-Test) can distinguish the compensated cirrhosis from non-cirrhotic chronic liver disease with the sensitivity of 79% and specificity of 86%. Liu, et al.14 compared the difference in the serum N-glycan profiles between patients with cirrhosis and patients with HBV induced HCC. Their results revealed the abundance of peak 9 increased significantly in HCC patients when compared with those without HCC. Peak 7 was significantly lower in HCC patients than in cirrhosis patients. The sensitivity and specificity of GlycoHCCTest [log(peak9/peak7)] were very similar to those of AFP, which can help improve the diagnostic accuracy for HCC patients.
In the present study, DSA-FACE was applied to detect the N-glycome profiles in CHB patients, investigate the correlation of N-glycome profiles with liver fibrosis and evaluate their diagnostic value.
Material and MethodsPatientsThe present study was approved by the Ethics Committee of the Shanghai First People’s Hospital, Shanghai Jiao Tong University School of Medicine, and informed, and informed consent was obtained before study. A total of 128 CHB patients undergoing liver biopsy were recruited from 2009 to 2010. The inclusion criteria included:
- •
Patients aged 18~65 years.
- •
Patients with a history of hepatitis B infection or positive for hepatitis B surface antigen (HBsAg) for > 6 months, and positive for HBsAg and/or HBV DNA at the time of enrollment.
- •
Patients with persistent or recurrent elevation of alanine aminotransferase (ALT).
- •
Patients with pathologically confirmed liver injury.
The exclusion criteria included:
- •
Patients with HIV infection or chronic hepatitis C.
- •
The amount of daily alcohol consumption was > 30 g.
- •
Patients with metabolic or other types of liver injury.
- •
Patients received substandard liver biopsy.
- •
Patients received liver-related treatment previously.
One week before liver biopsy, blood were collected for routine blood test, serum biochemistry and prothrombin time (PT) examination. Serum was isolated and stored at-80 °C for further examinations. Hematological (Sysmex XE-2100, Sysmex Corporation, Japan) and biochemical (Hitachi 7600 Chemistry Analyzer, Hitachi, Japan; Wako Pure Chemical Industries, Ltd., Japan) parameters were measured using standard methods. The reference ranges were:
- •
5.1~18.8 μmol/L for total bilirubin (Tbil).
- •
0~12 μmol/L for indirect bilirubin (Ibil).
- •
66~87 g/L for total protein (TP).
- •
34~55 g/L for albumin (ALB).
- •
1.5~2.5 for albumin/globulin (A/G).
- •
8~38 IU/L for aspartate aminotransferase (AST).
- •
4~44 IU/L for ALT.
- •
8~64 IU/L for γ-glutamyltransferase (GGT), and
- •
40~129 IU/L for alkaline phosphatase (ALP).
Markers of hepatitis virus infection including HBsAg, HBsAb, HBeAg, HBeAb, HBcAb and anti-HCV antibody were determined using immunological methods (Abbott ARCHITECT i2000 SR system, Abbott Laboratories, USA). The serum HBV-DNA level was detected by a real-time PCR (ABI 7300, Applied Biosystems, USA). A serum HBV DNA concentration ≥ 103 copies/mL was designated as HBV DNA-positive. All assays were performed according to the manufacturers’ instructions. The serum hyaluronic acid (HA), N-terminal peptide of type III pro-collagen (PIIIP), type IV collagen (CIV) and laminin (LN) were measured by radioimmunoassay (Lumino Analayzer and Maglumi Reagent, STRATEC Biomedical Systems AG, Germany). Tissue inhibitor of metalloproteinases-1 (TIMP-1) was detected by ELISA (R&D systems, USA).
All laboratory tests above were performed in the Department of Laboratory Medicine of Eastern Hepatobiliary Hospital of Second Military Medical University, Shanghai.
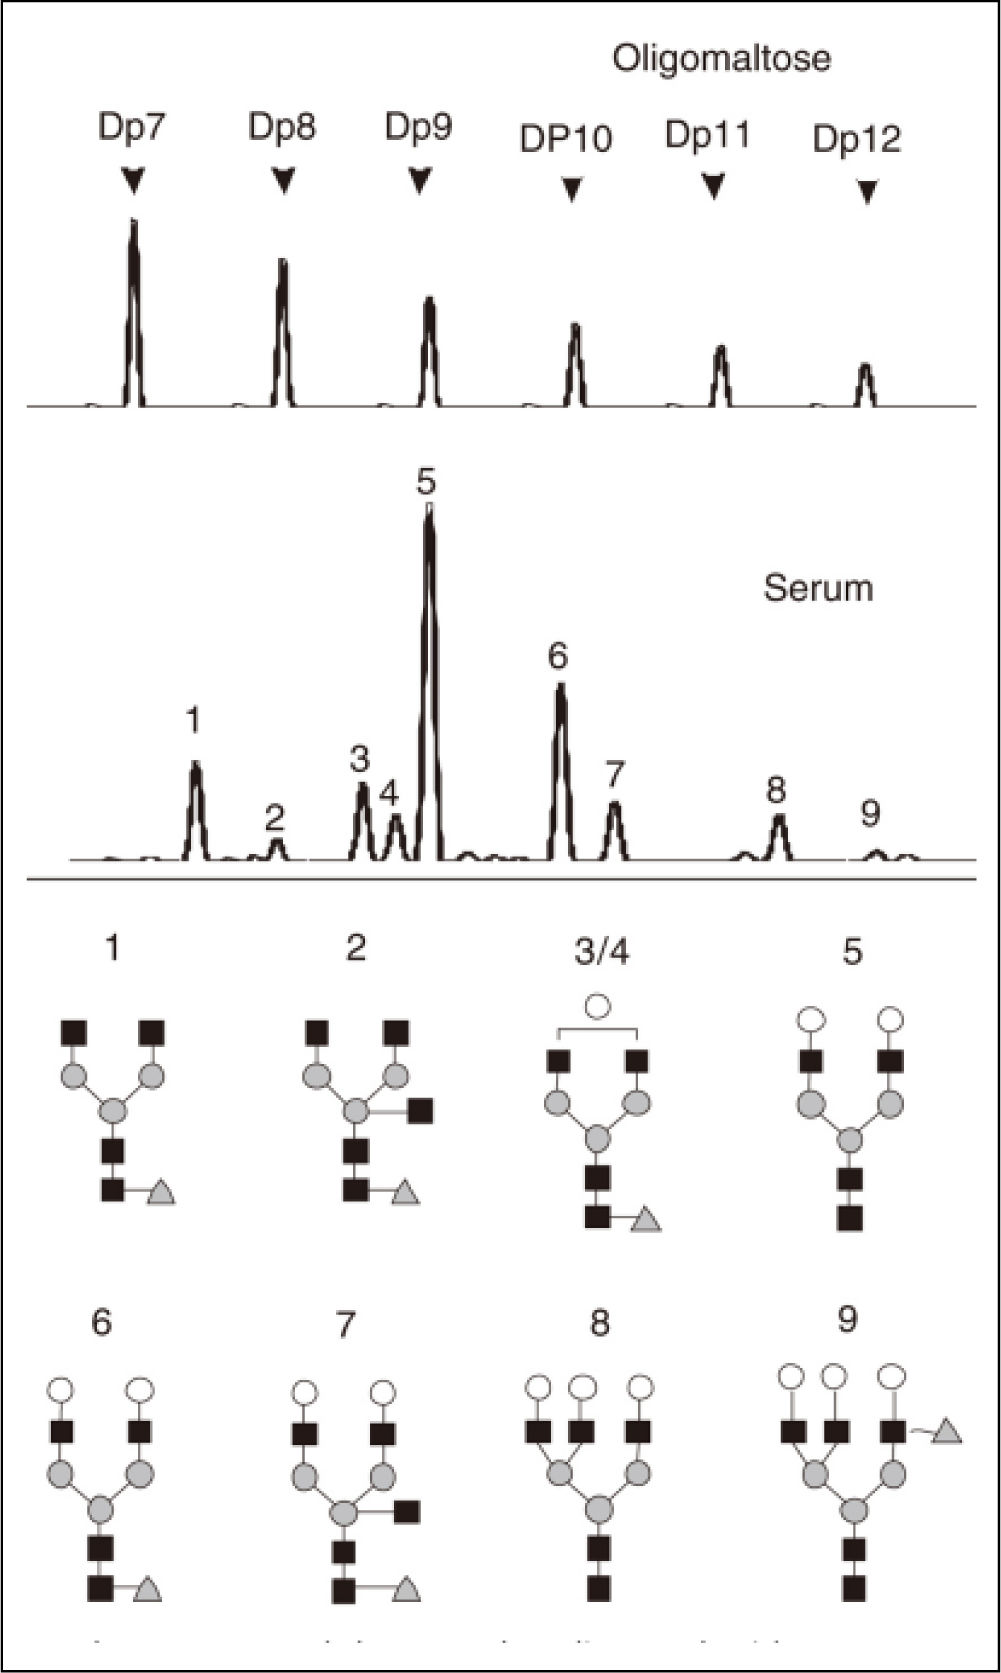
Serum protein N-glycome profilingSerum protein N-glycome analysis was performed as described previously.13 Briefly, the N-glycans present on the proteins in 2 μL of serum were released using the peptide N-glycosidase-F (PNGaseF) (New England Biolabs, MA) labeled with 8-aminonaphtale-ne-1,3,6-trisulphonic acid (APTS) (Invitrogen, CA). Sialic acid was removed with arthrobacter ureafaciens sialidase (Roche Bioscience, Palo Alto, CA), and the samples above were analyzed by DNA sequencer-assisted fluorophore-assisted carbohydrate electrophoresis (DSA-FACE) using a capillary electrophoresis (CE)-based ABI3130 Genetic Analyzer (Applied Biosystems, Foster city, CA). The data were analyzed using the GeneScan v3.7 software (Applied Biosystems). Ten peaks were obtained (Figure 1), and the heights of each peak were measured to numerically descript the profiles. Statistical analysis was performed following normalization by internal reference.13
, peak 2 is an agalacto, core-α-1,6-fucosylated bisecting biantennary (NGA2FB), peak 3 and peak 4 are a single agalacto, core-α-1,6-fucosylated biantennarys (NG1A2F), peak 5 is a bigalacto, biantennary glycan (NA2), peak 6 is a bigalacto, core-α-1,6-fucosylated biantennary (NA2F), peak 7 is a bigalacto, core-α-1,6-fucosylated bisecting biantennary (NA2FB), peak 8 is a triantennary (NA3) and peak 9 is a branching α-1,3-fucosylated triantennary (NA3Fb).")
Upper panel shows malto-oligosaccharides as a reference of sugar mass. A typical desialylated N-glycan profile of total serum protein is shown in the lower panels. Peak 1 is an agalacto, core-α-1,6-fucosylated biantennary glycan (NGA2F), peak 2 is an agalacto, core-α-1,6-fucosylated bisecting biantennary (NGA2FB), peak 3 and peak 4 are a single agalacto, core-α-1,6-fucosylated biantennarys (NG1A2F), peak 5 is a bigalacto, biantennary glycan (NA2), peak 6 is a bigalacto, core-α-1,6-fucosylated biantennary (NA2F), peak 7 is a bigalacto, core-α-1,6-fucosylated bisecting biantennary (NA2FB), peak 8 is a triantennary (NA3) and peak 9 is a branching α-1,3-fucosylated triantennary (NA3Fb).
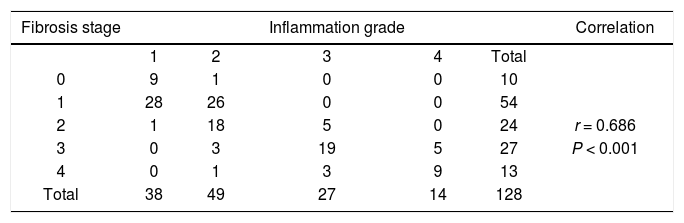
All patients underwent the ultrasound-guided liver biopsy on admission. The size of liver tissue was ≥ 1.0 cm in diameter, and the number of portal areas in each tissue was ≥ 6. These tissues were fixed in 10% formaldehyde and embedded in paraffin followed by hematoxylin-eosin (H&E) staining, Gordon-Sweet staining, Massaon’s trichrome, and van Gieson’s (VG) staining. Histological grading and staging were examined and scored by two pathologists blinded to the study, according to Scheuer’s classification.15 Inflammation, necrosis and fibrosis were scored from 0 to 4. The number of liver biopsies classified (total n = 128) in each of Scheuer’s five consecutive stages (from S0 to S4) were 10, 54, 24, 27 and 13 respectively.
Statistical analysisQuantitative variables were expressed as median (25th-75th percentile), categorical variables as number (percentage). Univariate analysis (Student t test or nonparametric test) was performed to identify variables showing significant difference between patients with and without significant fibrosis or cirrhosis. Predictive models were constructed by stepwise logistic regression and used to identify independent factors associated with each end point (significant fibrosis, advanced fibrosis or cirrhosis). The overall diagnostic performance of single marker and marker panels was evaluated by receiver operating characteristic (ROC) curve analysis. Correlation was analyzed by Spearman rank correlation analysis. Sensitivity (Se), specificity (Spe), positive predictive values (PPV), negative predictive values (NPV), diagnostic accuracy (DA), positive likelihood ratios (LR+) and negative likelihood ratios (LR-) were calculated using the cut-off values. Statistical analysis was performed with SPSS version 15.0 (SAS Institute Inc., Cary, NC, USA) software. A value of p < 0.05 was considered statistically significant.
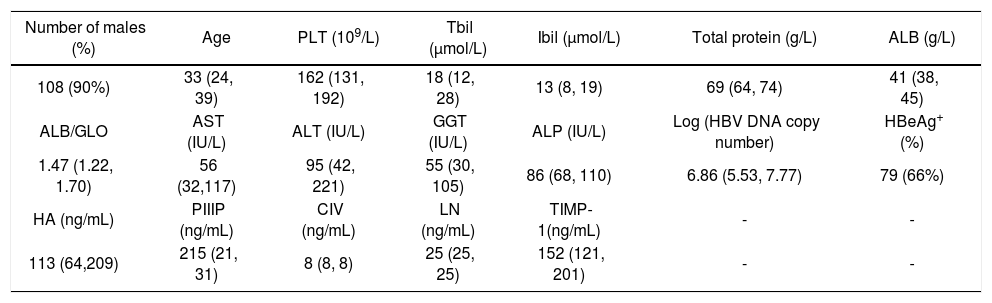
ResultsCharacteristics of patientsSerum markers and biochemical indicators of 128 CHB patients were measured for the evaluation of liver injury (Table 1). The degree of inflammation and fibrosis was assessed by patho-logical analysis (Table 2). The correlation coefficient of liver inflammation and fibrosis was 0.686, indicating that inflammation grades and fibrosis stages were positively correlated. The more active the inflammation was, the higher the degree of fibrosis was.
Characteristics of 128 CHB patients.
| Number of males (%) | Age | PLT (109/L) | Tbil (μmol/L) | Ibil (μmol/L) | Total protein (g/L) | ALB (g/L) |
|---|---|---|---|---|---|---|
| 108 (90%) | 33 (24, 39) | 162 (131, 192) | 18 (12, 28) | 13 (8, 19) | 69 (64, 74) | 41 (38, 45) |
| ALB/GLO | AST (IU/L) | ALT (IU/L) | GGT (IU/L) | ALP (IU/L) | Log (HBV DNA copy number) | HBeAg+ (%) |
| 1.47 (1.22, 1.70) | 56 (32,117) | 95 (42, 221) | 55 (30, 105) | 86 (68, 110) | 6.86 (5.53, 7.77) | 79 (66%) |
| HA (ng/mL) | PIIIP (ng/mL) | CIV (ng/mL) | LN (ng/mL) | TIMP-1(ng/mL) | - | - |
| 113 (64,209) | 215 (21, 31) | 8 (8, 8) | 25 (25, 25) | 152 (121, 201) | - | - |
Note: Data without normal distribution are expressed as median (25%, 75%); quantitative data as number (%). PLT: platelets. Tbil: total bilirubin. Ibil: indirect bilirubin. ALB: albumin. GLO: globulin. AST: aspartate aminotransferase. ALT: alanine aminotransferase. GGT: γ-glutamyltransferase. ALP: alkaline phosphatase. HBeAg: hepatitis B e Antigen. HA: hyaluronic acid. PIIIP: N-terminal peptide of type III pro-collagen. CIV: type IV collagen. LN: laminin. TIMP-1: tissue inhibitor of metalloproteinase-1.
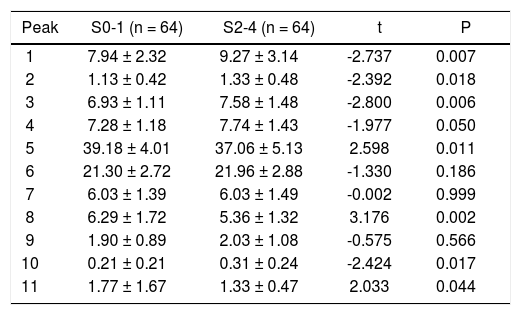
Patients were divided into mild fibrosis (S0-1) group and severe fibrosis group (S2-4) (Table 3). The mean peak areas were compared between two groups. Results showed peaks 1, 2, 3, 4 and 10 in the severe fibrosis group were significantly increased, while peaks 5, 8 and 11 markedly decreased when compared with mild fibrosis group (P < 0.05).
Differences in N-glycome profiles between mild fibrosis and severe fibrosis.
| Peak | S0-1 (n = 64) | S2-4 (n = 64) | t | P |
|---|---|---|---|---|
| 1 | 7.94 ± 2.32 | 9.27 ± 3.14 | -2.737 | 0.007 |
| 2 | 1.13 ± 0.42 | 1.33 ± 0.48 | -2.392 | 0.018 |
| 3 | 6.93 ± 1.11 | 7.58 ± 1.48 | -2.800 | 0.006 |
| 4 | 7.28 ± 1.18 | 7.74 ± 1.43 | -1.977 | 0.050 |
| 5 | 39.18 ± 4.01 | 37.06 ± 5.13 | 2.598 | 0.011 |
| 6 | 21.30 ± 2.72 | 21.96 ± 2.88 | -1.330 | 0.186 |
| 7 | 6.03 ± 1.39 | 6.03 ± 1.49 | -0.002 | 0.999 |
| 8 | 6.29 ± 1.72 | 5.36 ± 1.32 | 3.176 | 0.002 |
| 9 | 1.90 ± 0.89 | 2.03 ± 1.08 | -0.575 | 0.566 |
| 10 | 0.21 ± 0.21 | 0.31 ± 0.24 | -2.424 | 0.017 |
| 11 | 1.77 ± 1.67 | 1.33 ± 0.47 | 2.033 | 0.044 |
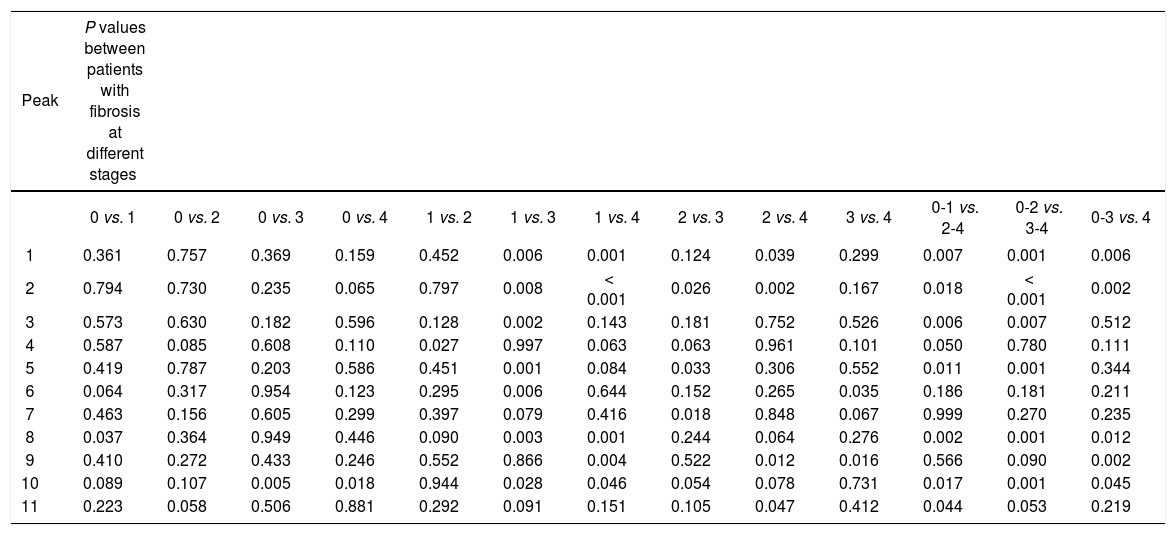
The changes in the W-glycomic peaks were further compared between patients with different fibrosis stages (Table 4). Results showed peaks 1, 2, 8 and 10 were better to distinguish patients with fibrosis at different stages. The statistically significant difference was found between groups with or without significant fibrosis (S2-4), advanced fibrosis (S3-4), or early cirrhosis (S4).
Relationship between N-glycome profiles and fibrosis staging.
| Peak | P values between patients with fibrosis at different stages | ||||||||||||
|---|---|---|---|---|---|---|---|---|---|---|---|---|---|
| 0 vs. 1 | 0 vs. 2 | 0 vs. 3 | 0 vs. 4 | 1 vs. 2 | 1 vs. 3 | 1 vs. 4 | 2 vs. 3 | 2 vs. 4 | 3 vs. 4 | 0-1 vs. 2-4 | 0-2 vs. 3-4 | 0-3 vs. 4 | |
| 1 | 0.361 | 0.757 | 0.369 | 0.159 | 0.452 | 0.006 | 0.001 | 0.124 | 0.039 | 0.299 | 0.007 | 0.001 | 0.006 |
| 2 | 0.794 | 0.730 | 0.235 | 0.065 | 0.797 | 0.008 | < 0.001 | 0.026 | 0.002 | 0.167 | 0.018 | < 0.001 | 0.002 |
| 3 | 0.573 | 0.630 | 0.182 | 0.596 | 0.128 | 0.002 | 0.143 | 0.181 | 0.752 | 0.526 | 0.006 | 0.007 | 0.512 |
| 4 | 0.587 | 0.085 | 0.608 | 0.110 | 0.027 | 0.997 | 0.063 | 0.063 | 0.961 | 0.101 | 0.050 | 0.780 | 0.111 |
| 5 | 0.419 | 0.787 | 0.203 | 0.586 | 0.451 | 0.001 | 0.084 | 0.033 | 0.306 | 0.552 | 0.011 | 0.001 | 0.344 |
| 6 | 0.064 | 0.317 | 0.954 | 0.123 | 0.295 | 0.006 | 0.644 | 0.152 | 0.265 | 0.035 | 0.186 | 0.181 | 0.211 |
| 7 | 0.463 | 0.156 | 0.605 | 0.299 | 0.397 | 0.079 | 0.416 | 0.018 | 0.848 | 0.067 | 0.999 | 0.270 | 0.235 |
| 8 | 0.037 | 0.364 | 0.949 | 0.446 | 0.090 | 0.003 | 0.001 | 0.244 | 0.064 | 0.276 | 0.002 | 0.001 | 0.012 |
| 9 | 0.410 | 0.272 | 0.433 | 0.246 | 0.552 | 0.866 | 0.004 | 0.522 | 0.012 | 0.016 | 0.566 | 0.090 | 0.002 |
| 10 | 0.089 | 0.107 | 0.005 | 0.018 | 0.944 | 0.028 | 0.046 | 0.054 | 0.078 | 0.731 | 0.017 | 0.001 | 0.045 |
| 11 | 0.223 | 0.058 | 0.506 | 0.881 | 0.292 | 0.091 | 0.151 | 0.105 | 0.047 | 0.412 | 0.044 | 0.053 | 0.219 |
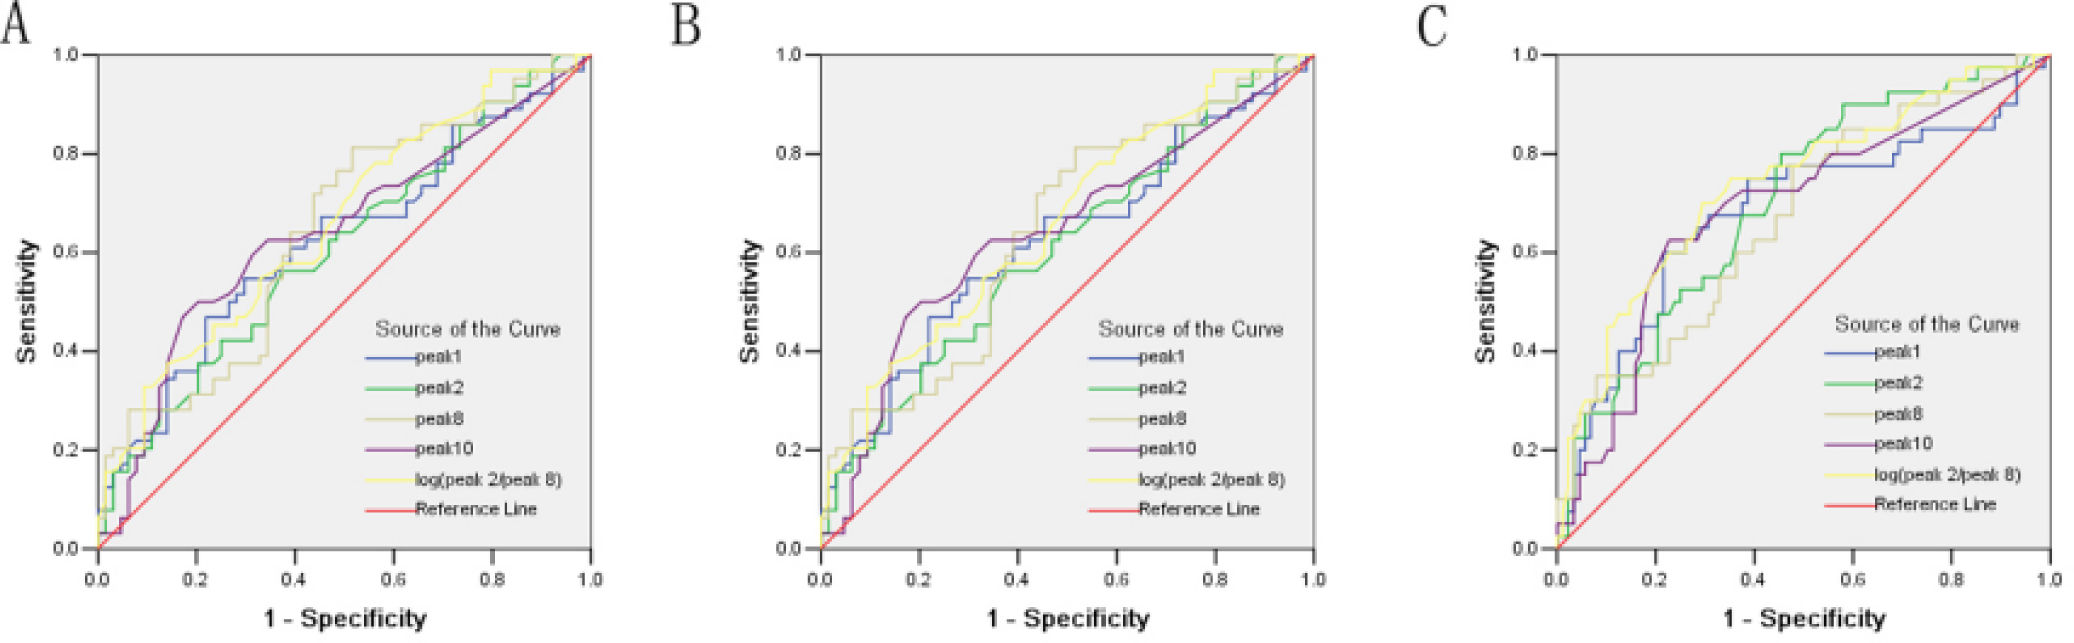
ROC curve was used to determine the role of different peaks in the diagnosis of fibrosis at different stages. In the prediction of significant liver fibrosis (S2-4), the areas under ROC (AUROCs) of different peaks were in the following order (Figure 2A):
- •
log(peak2/peak8) (0.675) > peak 8 (0.648) > peak 10 (0.640) > peak 1 (0.624) > peak 2 (0.609).
![Receiver operating characteristic (ROC) curve for the prediction of significant liver fibrosis of S2-4 from fibrosis score of S0-1 (AUROCs: log[peak2/peak8] [0.675] > peak 8 [0.648] > peak 10 [0.640] > peak 1 [0.624] > peak 2 [0.609]) A. Advanced fibrosis score of S3-4 from fibrosis score of S0-2 (AUROCs: log[peak2/peak8] [0.736] > peak 2 [0.702] > peak 10 [0.687] > peak 1 [0.682] > peak 8 [0.672)). B. Early cirrhosis score of S4 from fibrosis score of S0-3 (AUROCs: log[peak2/peak8] [0.754] > peak 2 [0.740] > peak 10 [0.687] > peak 1 [0.682] > peak 8 [0.672)). C. Peaks from the serum N-glycan profile.](https://static.elsevier.es/multimedia/16652681/0000001100000002/v1_201906150950/S1665268119310257/v1_201906150950/en/main.assets/gr2.jpeg?xkr=ue/ImdikoIMrsJoerZ+w997EogCnBdOOD93cPFbanNeKOJqKH5+Za6P+RA5Vq9Dlroj+sCGaz548oX3JsbtfYm5MpEX+OF6kWdRCzsD2j1G/4Ks/IFGW73Z8q32XlXfz2tnPzAX9HU1AmxYJCtmgxylwAUxoE/JGFPurZ+K3VJbfVJR25Wv04SPGb2kfDa5yXM6N32j90zqr4UORvoah0qeXZ3l/6VmtQwSbddqndZFVmqoDimkvwM0GVm+rc9V+bi1eUhMO6oHUd3A/dBgprGlXWa2FF60vzfio02f6W/w= "Receiver operating characteristic (ROC) curve for the prediction of significant liver fibrosis of S2-4 from fibrosis score of S0-1 (AUROCs: log[peak2/peak8] [0.675] > peak 8 [0.648] > peak 10 [0.640] > peak 1 [0.624] > peak 2 [0.609]) A. Advanced fibrosis score of S3-4 from fibrosis score of S0-2 (AUROCs: log[peak2/peak8] [0.736] > peak 2 [0.702] > peak 10 [0.687] > peak 1 [0.682] > peak 8 [0.672)). B. Early cirrhosis score of S4 from fibrosis score of S0-3 (AUROCs: log[peak2/peak8] [0.754] > peak 2 [0.740] > peak 10 [0.687] > peak 1 [0.682] > peak 8 [0.672)). C. Peaks from the serum N-glycan profile.")
Receiver operating characteristic (ROC) curve for the prediction of significant liver fibrosis of S2-4 from fibrosis score of S0-1 (AUROCs: log[peak2/peak8] [0.675] > peak 8 [0.648] > peak 10 [0.640] > peak 1 [0.624] > peak 2 [0.609]) A. Advanced fibrosis score of S3-4 from fibrosis score of S0-2 (AUROCs: log[peak2/peak8] [0.736] > peak 2 [0.702] > peak 10 [0.687] > peak 1 [0.682] > peak 8 [0.672)). B. Early cirrhosis score of S4 from fibrosis score of S0-3 (AUROCs: log[peak2/peak8] [0.754] > peak 2 [0.740] > peak 10 [0.687] > peak 1 [0.682] > peak 8 [0.672)). C. Peaks from the serum N-glycan profile.
In the prediction of advanced liver fibrosis (S3-4), the AUROCs of different peaks were in the following order (Figure 2B):
- •
log(peak2/peak8) (0.736) > peak 2 (0.702) > peak 10 (0.687) > peak 1 (0.682) > peak 8 (0.672).
In the prediction of early liver cirrhosis (S4), the AUROCs of different peaks were as following order (Figure 2C):
- •
log(peak2/peak8) (0.754) > peak 2 (0.740) > peak 10 (0.687) > peak 1 (0.682) > peak 8 (0.672).
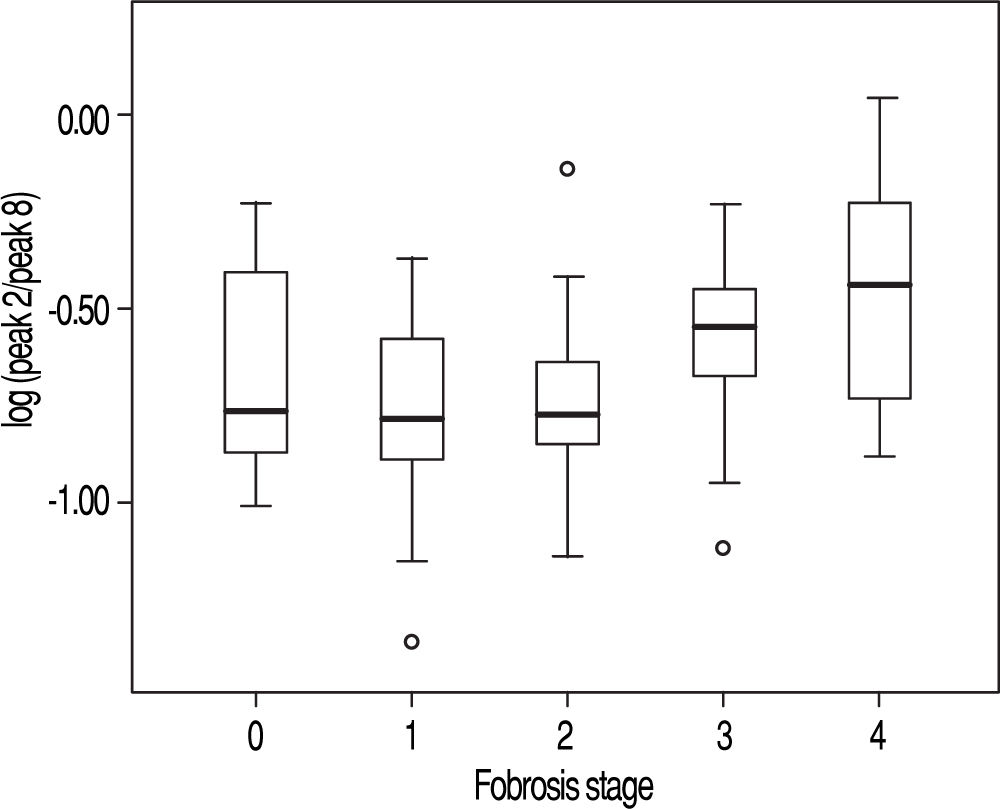
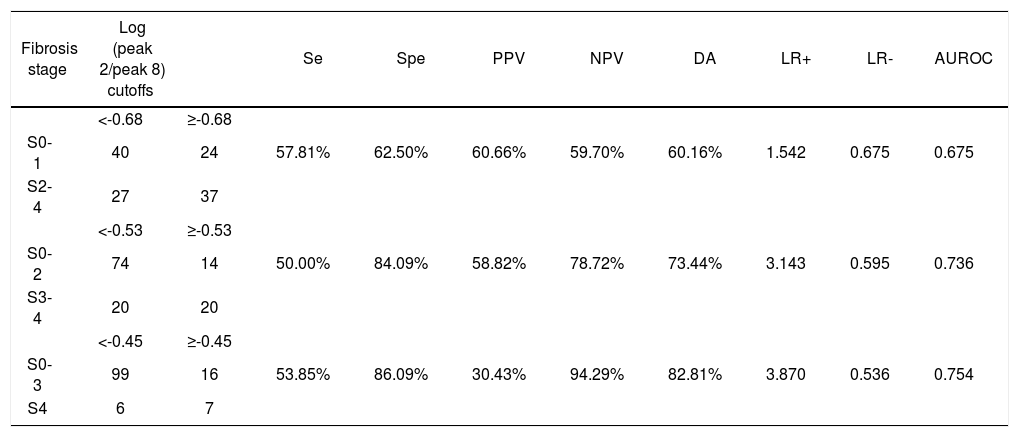
Among the variables derived from peaks 1, 2, 8, and 10, log(peak2/peak8) possessed the best AUROC of 0.675 for S0-1 vs. S2-4, 0.736 for S0-2 vs. S3-4, and 0.754 for S0-3 vs. S4 (Figure 2 and Table 5). Statistical analysis demonstrated that log(peak2/peak8) was a good predictor of advanced fibrosis and early cirrhosis but not applicable in identifying mild fibrosis (Figure 3).
Predictive value of log(peak 2/peak 8).
| Fibrosis stage | Log (peak 2/peak 8) cutoffs | Se | Spe | PPV | NPV | DA | LR+ | LR- | AUROC | |
|---|---|---|---|---|---|---|---|---|---|---|
| <-0.68 | ≥-0.68 | |||||||||
| S0-1 | 40 | 24 | 57.81% | 62.50% | 60.66% | 59.70% | 60.16% | 1.542 | 0.675 | 0.675 |
| S2-4 | 27 | 37 | ||||||||
| <-0.53 | ≥-0.53 | |||||||||
| S0-2 | 74 | 14 | 50.00% | 84.09% | 58.82% | 78.72% | 73.44% | 3.143 | 0.595 | 0.736 |
| S3-4 | 20 | 20 | ||||||||
| <-0.45 | ≥-0.45 | |||||||||
| S0-3 | 99 | 16 | 53.85% | 86.09% | 30.43% | 94.29% | 82.81% | 3.870 | 0.536 | 0.754 |
| S4 | 6 | 7 |
Se: sensitivity, Spe: specificity. PPV: positive predictive value. NPV: negative predictive value. DA: diagnostic accuracy. LR+: positive likelihood ratio.
LR-: negative likelihood ratio.
 of liver fibrosis at different stages. The vertical axis represents the log(peak 2/peak 8).")
The key step in the pathophysiology of liver fibrosis is a balance between extracellular matrix (ECM) deposition and its degradation.16 The accumulation of ECM can result from both increased synthesis and decreased degradation. Many serum ECM markers have been found for the assessment of fibrosis including N-terminal peptide of type pro-colla-gen,17,18 type IV collagen,18 HA,19,20 LN,21 collagenases and their inhibitors.22,23 Among 128 CHB patients with fibrosis, HA showed a strong correlation with fibrosis stages (r = 0.429, P = 0.000). However, fibrosis stages showed no correlation with PIIIP (r = 0.149, p = 0.092), CIV (r = 0.105, P = 0.239), LN (r = -0.009, P = 0.919) and TIMP1 (r = 0.102, P = 0.253). While HA did not improve the AUROCs in the prediction of significant fibrosis (S2-4), advanced fibrosis (S3-4) and cirrhosis (S4) in the validation cohort when combined with log (peak2/peak8).
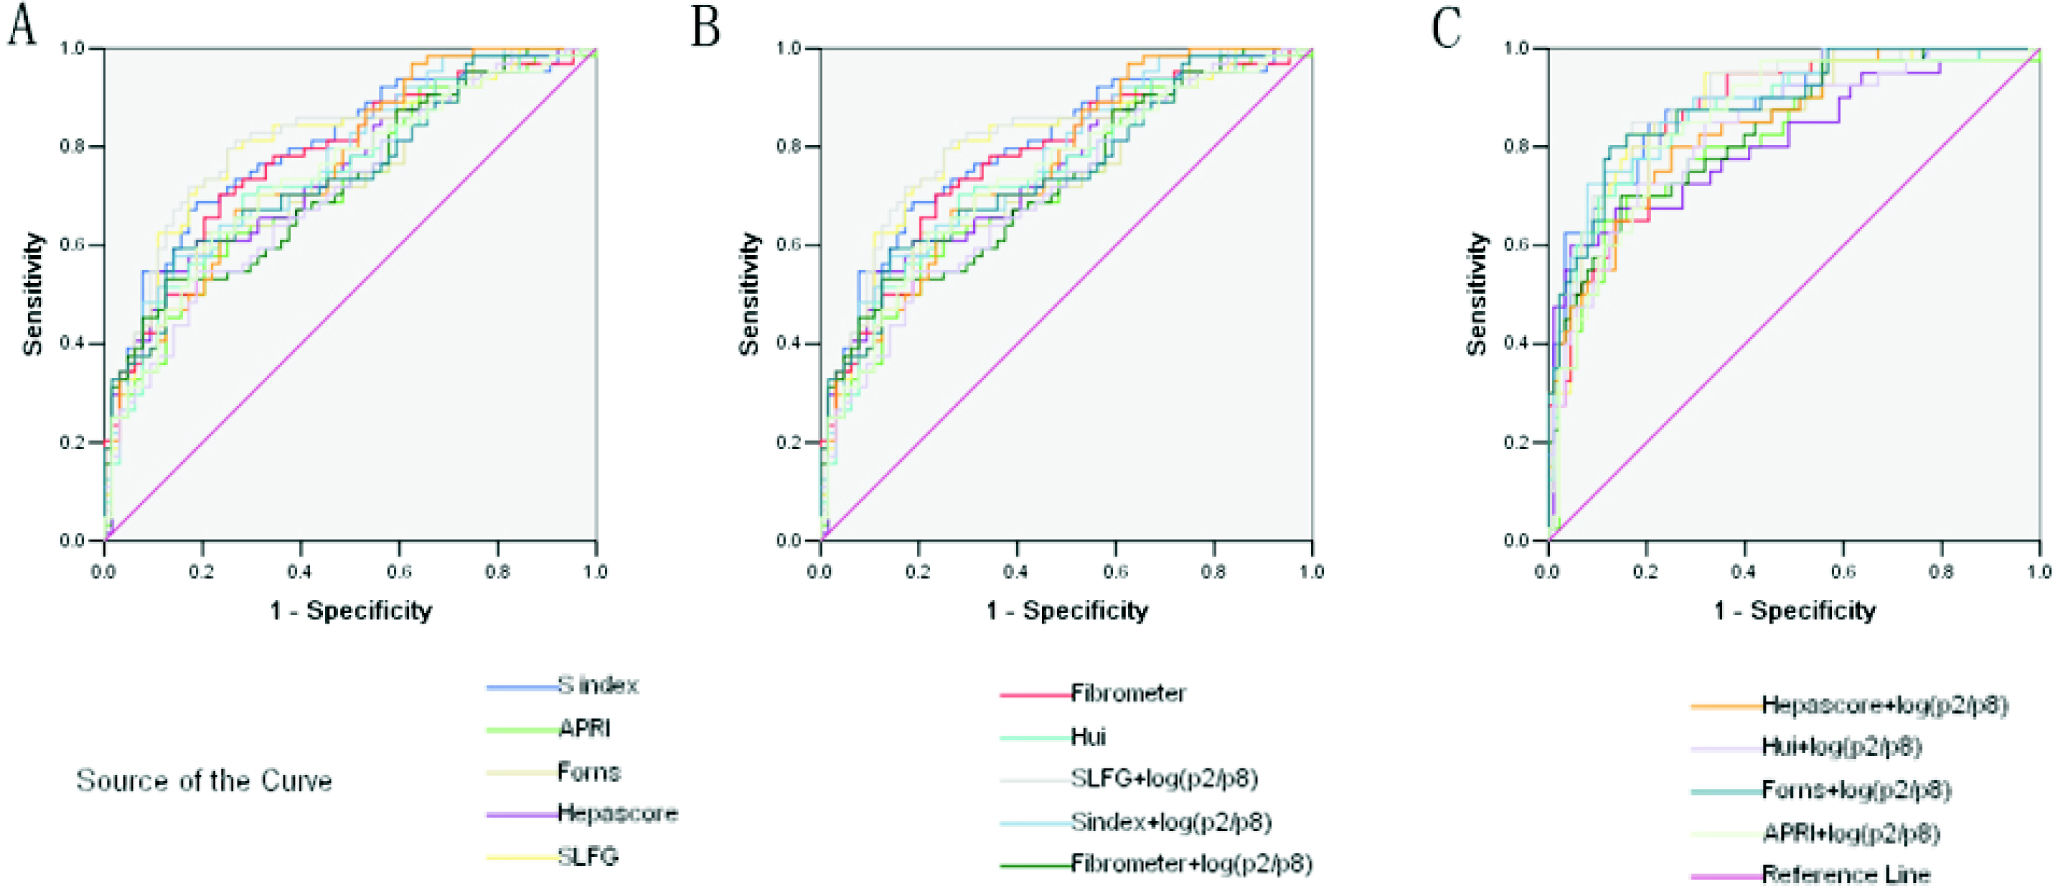
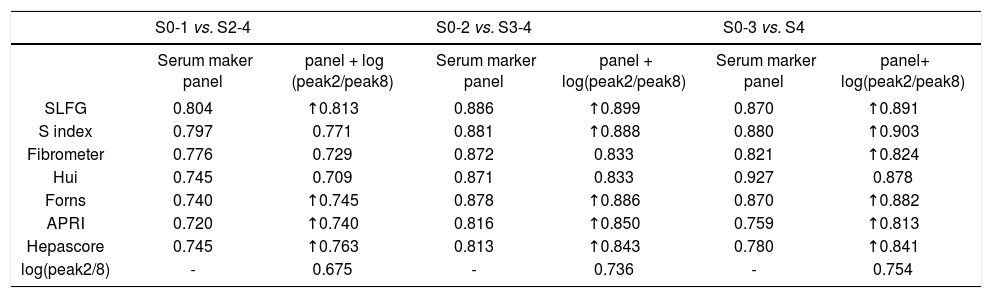
Diagnostic value of serum marker panels including S index, Forns score, APRI index, Hepascore, Fibrometer,24 Hui model and SLFG model was evaluated in the validation cohort enrolling 128 patients. The scores were calculated using the formulas previously reported. Correlations with fibrosis stages in the validation cohort were (sort descending, P < 0.001 in each model):
- •
r = 0.626 for SLFG model.
- •
r = 0.603 for S index.
- •
r = 0.582 for Fibrometer.
- •
r = 0.529 for Hui model.
- •
r = 0.520 for Forns score.
- •
r = 0.492 for APRI.
- •
r = 0.488 for Hepascore.
In the prediction of significant fibrosis (S2-4) in the validation cohort, the AUROCs were:
- •
0.804 for SLFG model.
- •
0.797 for S index.
- •
0.776 for Fibrometer.
- •
0.745 for Hepascore.
- •
0.745 for Hui model.
- •
0.740 for Forns score, and
- •
0.720 for APRI.
However, combined markers such as SLFG + log(peak2/peak8), Forns + log(peak2/peak8), APRI + log(peak2/peak8) and Hepascore + log(peak2/peak8) improved the diagnostic potency in identifying significant fibrosis (Figure 4A and Table 6). In the prediction of advanced fibrosis (S3-4), the AUROCs were:
- •
0.886 for SLFG model.
- •
0.881 for S index.
- •
0.878 for Forns score.
- •
0.872 for Fibrometer.
- •
0.871 for Hui model.
- •
0.813 for Hepascore, and
- •
0.816 for APRI.
 curve for the prediction of clinically valid liver fibrosis score of S2-4 from fibrosis score of S0-1. A. Fibrosis score of S3-4 from fibrosis score of S0-2. B. Fibrosis score of S4 from fibrosis score of S0-3. C. The values of glycome markers and serum marker panels. Areas under the curves (AUROCs) show the diagnostic potency of serum marker panels and N-glycan profile.")
Receiver operating characteristic (ROC) curve for the prediction of clinically valid liver fibrosis score of S2-4 from fibrosis score of S0-1. A. Fibrosis score of S3-4 from fibrosis score of S0-2. B. Fibrosis score of S4 from fibrosis score of S0-3. C. The values of glycome markers and serum marker panels. Areas under the curves (AUROCs) show the diagnostic potency of serum marker panels and N-glycan profile.
Areas under the curves (AUROCs) in the prediction of significant fibrosis (S2-4), advanced fibrosis (S3-4) and cirrhosis (S4) in the validation cohort.
| S0-1 vs. S2-4 | S0-2 vs. S3-4 | S0-3 vs. S4 | ||||
|---|---|---|---|---|---|---|
| Serum maker panel | panel + log (peak2/peak8) | Serum marker panel | panel + log(peak2/peak8) | Serum marker panel | panel+ log(peak2/peak8) | |
| SLFG | 0.804 | ↑0.813 | 0.886 | ↑0.899 | 0.870 | ↑0.891 |
| S index | 0.797 | 0.771 | 0.881 | ↑0.888 | 0.880 | ↑0.903 |
| Fibrometer | 0.776 | 0.729 | 0.872 | 0.833 | 0.821 | ↑0.824 |
| Hui | 0.745 | 0.709 | 0.871 | 0.833 | 0.927 | 0.878 |
| Forns | 0.740 | ↑0.745 | 0.878 | ↑0.886 | 0.870 | ↑0.882 |
| APRI | 0.720 | ↑0.740 | 0.816 | ↑0.850 | 0.759 | ↑0.813 |
| Hepascore | 0.745 | ↑0.763 | 0.813 | ↑0.843 | 0.780 | ↑0.841 |
| log(peak2/8) | - | 0.675 | - | 0.736 | - | 0.754 |
And combined markers including (Figure 4B and Table 6):
- •
SLFG + log(peak2/peak8).
- •
S index + log(paek2/peak8).
- •
Forns + log(peak2/peak8).
- •
APRI + log(peak2/peak8), and
- •
Hepascore + log(peak2/peak8) also improved the diagnostic potency in identifying advanced fibrosis.
In the prediction of cirrhosis (S4), the AUROCs were:
- •
0.927 for Hui model.
- •
0.880 for S index.
- •
0.870 for Forns score.
- •
0.870 for SLFG model.
- •
0.821 for Fibrometer.
- •
0.780 for Hepascore, and
- •
0.759 for APRI.
And the combined markers such as (Figure 2C and Table 6):
- •
SLFG + log(peak2/peak8).
- •
S index + log(paek2/peak8).
- •
Fibrometer + log(peak2/peak8).
- •
Forns + log(peak2/peak8).
- •
APRI + log(peak2/peak8), and
- •
Hepascore + log(peak2/peak8) improved the diagnostic potency in identifying early cirrhosis.
These models can be divided into two types, models only consisting of simple routine tests (S index, Hui model, Forns score and APRI) and models being composed of special tests such as HA and α2-macrog-lobulin (SLFG model, Fibrometer and Hepascore). Generally speaking, the combination of N-glycans with these models had higher AUROCs than the models alone, especially in identifying cirrhosis. In both types, models from CHB patients (S index and SLFG model) were superior to others. N-glycans improved the diagnostic potency of SLFG in predicting significant fibrosis, advanced fibrosis and cirrhosis, and while S index only in predicting advanced fibrosis and cirrhosis.
DiscussionFollowing genomics and proteomics, glycomics is being increasingly applied in the diagnosis and differentiation of diseases although glycomics is still in its infancy when compared with the former two techniques.25 Similar to proteomics and genomics, glycomics explores the role of carbohydrates in the biological processes, including carbohydrate-carbohydrate, carbohydrate-protein and carbohydrate-nucleic acid interactions.26 Carbohydrates are an important source of energy and basic components of biological structures. A variety of biological functions of carbohydrates and their glycosylation have been revealed with the development of molecular biology and cell biology. Glycans participate in various biological functions and are components of bioactive molecules that involve in the regulation of cell adhesion, molecular trafficking and clearance, receptor activation, signal transduction, immune response and expression of markers on the malignant cells.27,28 Glycosylation is highly sensitive to the biochemical environment and has been implicated in many diseases including cancer.28 Recently, interest in the glycan profiling is increasing due to the potential of glycans as disease markers.13,14,29,30 With the increasing understanding of genomics, proteomics and glycomics of diseases, increasing mechanisms underlying the pathogenesis of diseases are clarified, and the screening of diagnostic and prognostic markers for diseases will be greatly facilitated.
The liver is a major resource of glycoprotein and the asialogiycoprotein receptor and the mannose/N-acetylglucosamine (GlcNAc) receptor in the liver have important roles in the clearance of aberrantly glycosylated proteins. Therefore, hepatocyte dysfunction may lead to aberrant changes in the glycosylation level, glycosylation site, and the amount of glycans in glycoproteins, thus altering the serum N-glucome profile. In the progression from inflammation to fibrosis and from fibrosis to carcinogenesis, the structures and functions of glycans also change.13,29 To different extents, serum N-glycome profiles can reflect the changes in the hepatocyte function.31-33 Thus, any change in the serum N-glycans may reflect the alterations in the liver physiology and pathophysiology, and changes in the quantity and type of serum N-glycans can be utilized for the non-invasive diagnosis of liver diseases.34 However, the high complexity of sugar chains and the lack of high-performance glycosylation analysis techniques have limited the extensive investigation of glycobiology and clinical applications. Callewaert, et al.12 presented methodology allowing the medium-throughput analysis of N-glycans derived from low picomole amounts of glycoproteins using the standard DNA-sequencing equipment available in any life sciences laboratory. All sample preparation steps (enzymatic deglycosylation with PNGase F, desalting, derivatization with 8-amino-1,3,6-pyrenetrisulfonic acid, and postderivatization cleanup) are performed using 96-well-based plates. This integrated sample preparation scheme is also compatible with capillary electrophoresis and MAL-DI-TOF-MS (matrix-assisted laser desorption/ionization time-of-flight mass spectrometry) platforms already in use in some glycobiology labs. This technology (DSA-FACE) brings high-performance glycosylation analysis within reach of each life sciences lab and thus help expedite the pace of discovery in the field of glycobiology. It is noteworthy that the detection of liver fibrosis glycomics is based on the DSA-FACE technology development. It demands less for sample preparation and can analysis the structure of N-glycan at the same time. It also provides a new way to further study the pathophy-siology of liver fibrosis tissue. This new analysis provides us with a more sensitive detection of glycomics and appropriate to carry out in the general laboratory, which will be introduced glycomics to the diagnosis of liver fibrosis and reduce some liver biopsy examinations.
Callewaert, et al.13 reported that serum protein N-glycan profiles generated by DNA sequencer/fragment analyzers could distinguish the compensated cirrhotic and decompensated cirrhosis from the non-cirrhotic chronic liver disease patients with high sensitivity and specificity. The sensitivity and specificity of serum protein N-glycan profiles were 79 and 86%, respectively, in distinguishing compensated cirrhotic from noncirrhotic chronic liver diseases, and 100 and 100%, respectively, in distinguishing compensated cirrhotic from decompensated cirrhosis. This novel glycomics was to detect fluorescently labeled glycans based on the capillary electrophoresis. In the present study, we applied this technique to distinguish CHB patients with liver fibrosis at different stages (0-4) and investigate the serum N-glycome profiles in patients with fibrosis at different stages. Our goal was to apply this technique as a novel noninvasive tool for the diagnosis and staging of liver fibrosis.
In the present study, the value of DSA-FACE in the diagnosis of liver fibrosis was evaluated through detecting N-glycome profiles in CHB patients. Results revealed that peak 1 (an agalacto core-α-1,6-fucosylated biantennary glycan, NGA2F), peak 2 (an agalacto core-α-1,6-fucosylated bisecting biantennary glycan, NGA2FB), peak 8 (a tri-antennary gly-can, NA3), and peak 10 (a core-α-1,6 fucosylated tri-antennary glycan, NA3Fc) were correlated with liver fibrosis at different stages. Furthermore, the log(peak 2/peak 8) possessed the best diagnostic accuracy, which was in agreement with a previous study on chronic HCV infection patients.29 The AUROCs of log(peak 2/peak 8) were 0.675, 0.736 and 0.754 in distinguishing significant fibrosis, advanced fibrosis and early cirrhosis, respectively. Models from CHB patients (S index and SLFG model) were superior to others in our validation cohort. N-glycan (log[peak 2/peak 8]) improved the diagnostic potency of SLFG in predicting significant fibrosis, advanced fibrosis and cirrhosis, and while S index only in predicting advanced fibrosis and cirrhosis. All the 128 CHB patients were investigated to generate a diagnostic cutoff value as-0.68, -0.53 and-0.45 for significant fibrosis, advanced fibrosis and early cirrhosis, respectively. Our results suggest log(peak2/peak8) may be a good predictor of advanced fibrosis and early cirrhosis, but has poor potency in distinguishing less advanced fibrosis. Gui, et al.35 showed the N-glycan markers (AUROC = 0.740) was slightly superior to FibroTest (AUROC = 0.696) in distinguishing fibrosis patients (F1 or more, according to Ishak’s scoring system36 on a scale of F0-F6) from non-fibrosis patients (F0). The inconsistent results may be attributed to sampling errors, and increasing sample size will improve the reliability.
Finally, the N-glycan markers were positively correlated with the severity of liver fibrosis. Thus, it might be a promising marker for the follow-up of fibrosis. Moreover, N-glycan markers in combination with other marker panels showed the best diagnostic potency in distinguishing significant fibrosis (SLFG + log[peak2/peak8], AUROC = 0.813) and advanced fibrosis (SLFG + log[peak2/peak8], AUROC = 0.899) and a better diagnostic potency for early cirrhosis (S index + log[peak2/peak8], AUROC = 0.903). In contrast, Hui model was more reliable in distinguishing significant fibrosis (AUROC = 0.745), advanced fibrosis (AUROC = 0.871) and early cirrhosis (AUROC = 0.927) than the combination with N-glycan, which had the best diagnostic potency in distinguishing S4 from S0-3 in combination with all serum maker panels in our validation cohort. N-glycan markers can applied as complementary parameters for the current well validated statistical models used in the hepatology except the Hui model.
One limitation of our study was the small number of CHB patients. Further studies with more CHB patients and some HCC patients should be performed to evaluate it as a noninvasive marker of fibrosis progression.
In summary, the alterations of serum N-glycan profile in CHB patients were confirmed in our study. Our results show N-glycan markers have satisfactory reproducibility and play a key role in the diagnosis and treatment of chronic liver diseases. Due to the shortcomings of liver biopsy, noninvasive diagnostic alternatives for liver fibrosis are required. Serum glycan profiles in combination with some marker panels may improve the diagnosis of liver fibrosis and its grading in patients with CHB and potentially reduce the need for liver biopsy. Other glycan markers like cirrhosis marker (GlycoCirrho-Test) and HCC marker (GlycoHCCTest) may be applied to monitor the progression of cirrhosis and HCC.
Abbreviations- •
CHB: chronic hepatitis B.
- •
HCC: hepatocellular carcinoma.
- •
DSA-FACE: DNA sequencer-assisted fluorophore-assisted carbohydrate electrophoresis.
- •
ROC: receiver operating characteristic.
- •
AUROC: area under the receiver operating characteristic.
This study was supported by the National Key Technologies Research and Development Program of China during the 11th Five-year Plan Period (2008ZX10002-006 and 2012ZX10002007-001-040), the National High Technology Research and Development Program of China (863 Program, No: 2006AA02A411), Science and Technology Commission of Shanghai Municipality (No: 10411955300 and 09XD1403200) and Shanghai Municipal Health Bureau (No: XBR2011012).


