


Liver transplant (LT) is a recent option available in the United States (US) to treat those with severe, refractory alcoholic hepatitis (AH). We examined changes in clinical characteristics of patients admitted with AH and tracked hospital outcomes as practice changes involving LT have shifted.
Materials and MethodsUsing the National Inpatient Sample, we performed a cross-sectional analysis of patients admitted with AH during the years 2016–2020 in the US. Differences in clinical characteristics over time were assessed. To compare outcomes between 2016–2017 (when LT was less common) and 2018–2020 (when LT was more common), we conducted linear and logistic regression. Propensity-score matching was used to compare outcomes between patients with and without LT.
ResultsFrom 2016–2017 to 2018–2020, patients admitted with AH tended to have a higher frequency of infection (p = 0.006), hepatorenal syndrome (<0.001), and ascites (<0.001). Hospital costs and length of stay (LOS) were highest in transplant hospitals, and costs rose over time in both non-transplant (NT) teaching and non-teaching hospitals (p < 0.001). Mortality decreased in NT teaching hospitals [aOR 0.7 (95% CI: 0.6–0.8)] and slightly decreased in NT non-teaching hospitals [aOR 0.7 (95% CI: 0.5–1.0)]. In the propensity-matched cohort involving LT versus non-LT patients, there was a 10% absolute reduction in-hospital mortality, but this came at a higher cost (p < 0.001) and length of stay (p < 0.001).
ConclusionsThe severity of AH has been increasing over time, yet mortality has declined after adjusting for severity of disease. Patients who underwent LT survived; however, the healthcare burden of LT is substantial.
Alcoholic hepatitis (AH) refers to inflammation of the liver resulting from excessive, chronic, active alcohol consumption [1]. In those with severe AH, mortality is high, with 30% of patients succumbing to the disease within thirty days of diagnosis [2–4]. While abstinence is the mainstay of treatment, steroids can be effective in reducing mortality in the short term for patients with severe disease [5–7].
Liver transplant (LT) has recently been gaining traction in the United States (US) as a viable solution for select patients with severe AH that is refractory to medical therapy; this development is based on several reports confirming that LT for AH can improve long-term survival [8–10]. While in 2014, only 28 patients with AH underwent LT in the US, this number increased to 138 patients in 2019, per the United Network for Organ Sharing [8]. The benefits notwithstanding, LTs for AH impose a high burden of cost on hospitals due to increased utilization of healthcare-related services and resources [11]. Even patients who ultimately do not undergo LT may contribute to elevated expenditure in hospitals that offer LT for AH, as more resources are directed toward their care to improve their eligibility for transplant.
Since the introduction of LT for refractory AH, inpatient admissions for AH in the US have not been adequately studied. Thus, the main objectives of this project, using the US National Inpatient Sample (NIS) databases from 2016 to 2020, were to: (1) report how demographics, clinical features, and mortality of patients with AH have changed over time and (2) examine trends in the healthcare burden of AH, as practice patterns involving LT have shifted.
2Materials and methodsWe conducted a cross sectional analysis of patients hospitalized with alcoholic hepatitis using the National Inpatient Sample (NIS) from 2016 to 2020. The NIS of the Healthcare Cost and Utilization Project (HCUP) is a national database of discharge data for hospital admissions from non-federal hospitals in the US, which reports patient characteristics, mortality, cost, length of stay (LOS), clinical diagnoses, and hospital-based procedures and surgeries for inpatient encounters. Characteristics of the hospitals in which patients are admitted can also be found. Annually, NIS includes approximately 7 million hospital discharges, which equates to roughly 20% of all hospital admissions in the US [12]. Detailed information on the NIS can be found on its website (https://www.hcup-us.ahrq.gov/databases.jsp).
In this study, patients admitted with alcoholic hepatitis (AH) as a primary, secondary, or tertiary discharge diagnosis were abstracted from the databases using ICD-10 codes K70.11 and K70.10. Of these patients, those who underwent liver transplant (LT), designated by code 0FY00Z0 or 0FY00Z1, as a primary or secondary procedure, were collected. The term “transplant hospital” was used to describe a hospital that, based on its identification code in the database, had performed a LT for AH during at least one hospitalization. Primary outcomes, which included cost, LOS, and inpatient mortality, were reported for transplant hospitals, non-transplant (NT) teaching hospitals, and NT non-teaching hospitals. These outcomes were compared between time ranges 2016–2017 and 2018–2020, given that LT was more commonly performed in the latter years [the majority (80%) of LT for AH had been performed between 2018 and 2020 in the NIS database] [8].
The cost of a hospital stay refers to the expenses incurred due to the production of hospital services, whereas charges refer to the amount that hospitals bill for these services. The cost of each hospital stay was calculated by multiplying the cost-to-charge ratio, supplied by HCUP, with the total charges. Cost was adjusted for inflation by using the consumer price index reported for the years 2016–2020 by the US Bureau of Labor Statistics [13]. All costs were thus reported as 2020 dollars.
Demographic characteristics (age, race, sex, insurance status) of hospitalized patients with AH were also extracted from the database. Comorbid conditions, including infection, coagulopathy, respiratory failure, heart failure, sepsis, shock, malignant cancer, brain death, hepatorenal syndrome (HRS), variceal bleeding, and hepatic encephalopathy, were catalogued.
The risk of mortality associated with each hospital admission was graded with the All Patient Refined-Diagnosis Related Group (APR-DRG) mortality score, which rates the risk of mortality from low to high using scores 0–4 (based on primary and secondary discharge diagnoses, age, and other health conditions) [14]. The North American Consortium for the Study of End-Stage Liver Disease Acute on Chronic Liver Failure (NACSLED-ACLF) score, specific to patients with chronic liver disease, was calculated for each hospital admission to further assess mortality risk [15]. NACSLED-ACLF score ≥2 was defined as two or more organ failures, which included (1) respiratory failure (ICD-10 code for mechanical ventilation) (2) renal failure (ICD-10 codes for acute kidney injury or need for dialysis) (3) cardiovascular failure (ICD-10 codes for shock, central venous pressure procedure, or arterial line procedure), or (4) neurological failure (ICD-10 codes for brain death or hepatic coma). The ICD-10 codes used in the study are listed in Table S1. Because data collected from the NIS database contains publicly available de-identified patient information, review and approval of the Institutional Review Board from the University of Iowa was not required.
2.1Statistical analysisNominal variables are listed as n (%) while continuous variables are reported using mean (standard deviation). Categorical variables, when compared between time ranges, hospital types, and patients who received LT versus those who did not, were analyzed using Pearson's chi square test, Fisher's exact test, or the Pearson's chi square likelihood statistic. In the same instances in which continuous variables are compared, the t-test was used.
Linear and binominal logistic regression analyses were performed to determine how the outcomes (LOS, cost, and mortality) of the AH-related hospitalizations changed between time intervals 2016–2017 and 2018–2020. In models that adjust for confounding factors, the following covariates were used to adjust for disease severity: age, sex, race, APR-DRG mortality score, NACSELD-ACLF ≥ 2, paracentesis, coagulopathy, variceal bleeding, and hepatorenal syndrome. These same covariates, along with hepatic encephalopathy, were used in propensity scoring (PS) [16] to match patients with severe AH from 2016 to 2020 who underwent LT with patients who did not. Controls for propensity matching were selected only from the cohort of patients who had been admitted to hospitals that offered LT for AH. Furthermore, only patients with APR-DRG mortality scores ≥2 were used in the matching process (as LT recipients in the cohort all had scores ≥2). The match tolerance was set at 0.02. Linear regression was used to compare cost and LOS between matched patients. All statistical analyses were conducted using SPSS software ver. 9.0.0.0 (IBM, Armonk, NY, USA).
2.2Ethical statementThis cross-sectional nationwide study involving human participants was in accordance with the ethical standards of the institutional and national research committee and with the 1964 Helsinki Declaration and its later amendments or comparable ethical standards. The Human Investigation Committee (IRB) of the University of Iowa was not required to approve or review this study as the National Inpatient Sample provides publicly available, de-identified data [12].
3ResultsThe NIS database from 2016 to 2020 revealed that there was a total of 39,018 admissions for AH. There were 370 AH hospital admissions in transplant hospitals from 2016 to 2020. In comparison, there were 28,871 hospital admissions for AH in NT teaching hospitals and 11,767 hospital admissions in NT non-teaching hospitals.
3.1Trends over timeOf AH admissions, 16,946 occurred between 2016 and 2017, while 22,072 occurred between 2018 and 2020. Of all the 45 LT recipients, 20% (9/45) underwent LT in 2016–2017 and 80% (36/45) in 2018–2020.
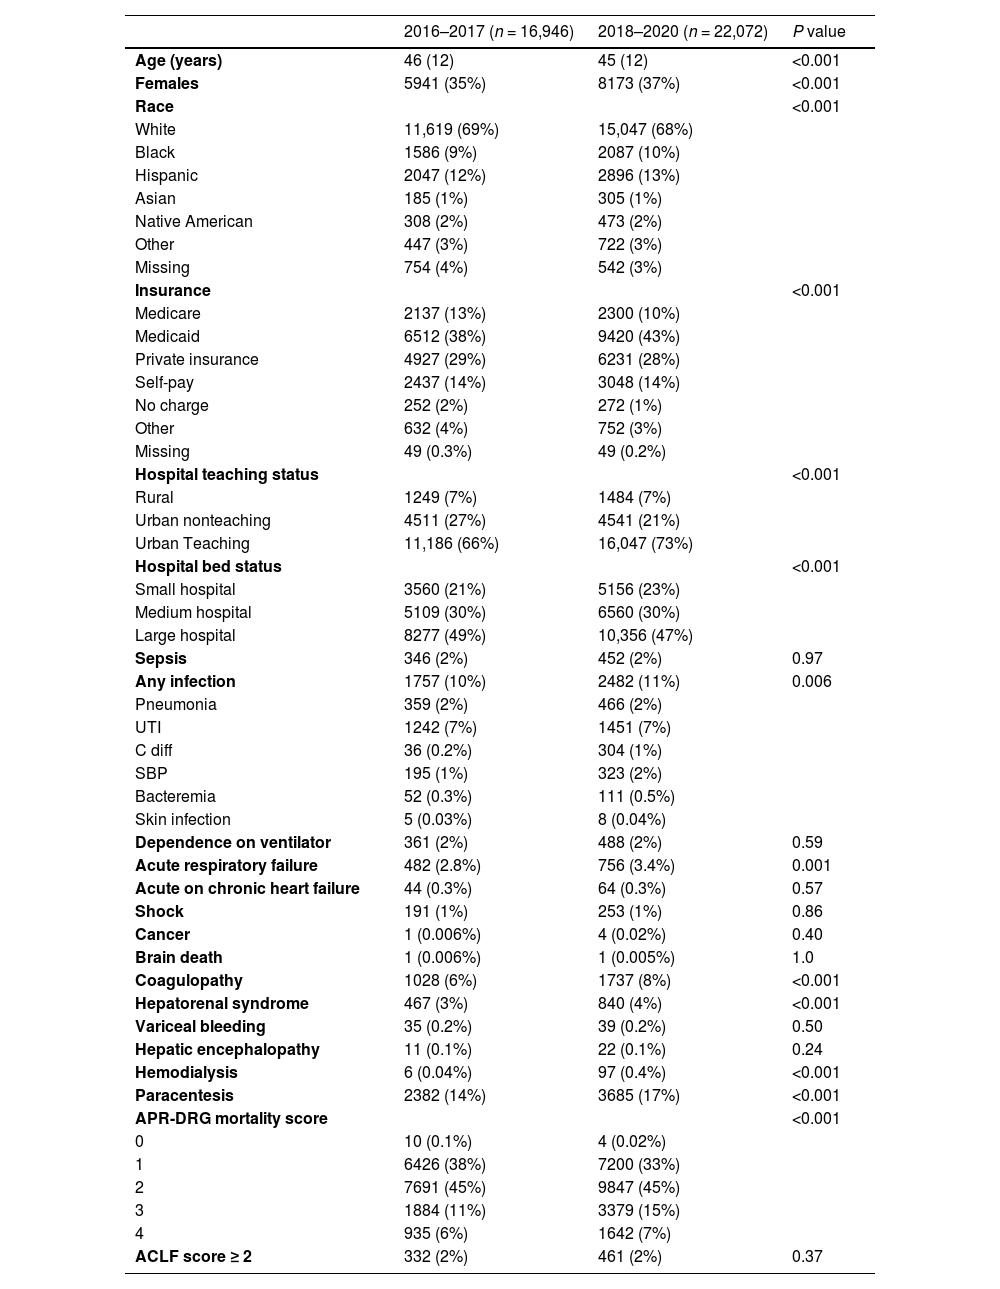
Table 1 illustrates characteristics of patients with AH from 2016 to 2017 compared with those admitted from 2018 to 2020. Age was lower (p < 0.001) in 2018–2020 (average 45 years) than in 2016–2017 (average 46 years), and the proportion of females increased between the two time periods (from 35% to 37%, p < 0.001). The distribution of race among patients with AH shifted; while whites were predominant in both time periods, both African-Americans and Hispanics had slightly higher representation from 2018 to 2020. Furthermore, there were significantly more patients on Medicaid in the time interval 2018–2020 (43% vs. 38%, p < 0.001). Within urban areas, more admissions of AH took place at teaching hospitals rather than non-teaching hospitals over time. In 2018–2020, a higher fraction of patients with AH were admitted to smaller hospitals, when compared to 2016–2017.
Characteristics of all patients admitted with alcoholic hepatitis during 2016–2017 and 2018–2020.
Data are described as mean (standard deviation) or n (%) as appropriate. Abbreviations: UTI- urinary traction infection; C diff- clostridium difficile infection; SBP- spontaneous bacterial peritonitis; APR-DRG- All Patients Refined Diagnosis Related Groups mortality score; ACLF- acute on chronic liver failure mortality score.
Several clinical characteristics were significantly different when comparing admissions from 2018 to 2020 to those from 2016 to 2017. Those admitted with AH in 2018–2020 were also more likely to suffer from the following: infection (11% vs. 10%, p = 0.006), acute respiratory failure (3.4% vs. 2.8%, p = 0.001), and coagulopathy (8% vs. 6%, p < 0.001).
While there was no difference in incidence of variceal bleeding and hepatic encephalopathy between the two time periods, patients with AH had the following liver-related complications more often in 2018–2020: hepatorenal syndrome (4% vs. 3 %, p < 0.001), dialysis dependence (0.4% vs. 0.04%, p < 0.001), and ascites requiring paracentesis (17% vs. 14%, p < 0.001). Finally, APR-DRG mortality scores significantly worsened over time; in contrast to 2016–2017, when 17 % of patients had a score of 3 or 4, in the latter years, the fraction increased to 22 %. Demographic and clinical characteristics of AH patients in transplant, NT teaching hospitals, and NT non-teaching hospitals over time are shown in supplementary tables S2–S4.
3.2Hospital outcomes: cost, length of stay (LOS), and in-hospital mortalityTable 2 depicts changes in LOS, cost, and in-hospital mortality over time, for each hospital type. Admissions for AH grew costlier over time for patients in transplant hospitals, but only in the unadjusted model and when admissions involving LT were excluded. When transplant patients were included, there was no change in cost over time; however, absolute costs were higher, compared to transplant hospital admissions excluding patients with LT, by around two-fold both in 2016–2017 (average $26,098 vs. $11,564, p = 0.01) and 2018–2020 (average $37,539 vs. $19,866, p < 0.001). Furthermore, costs related to AH rose in NT teaching hospitals and NT non-teaching hospitals, from 2016–2017 to 2018–2020, by roughly $4500 and $3900, respectively. Both NT teaching and NT non-teaching hospitals demonstrated cost increases with time that persisted even in the adjusted model.
Length of stay (LOS), cost, and mortality in 2018–2020 compared to 2016–2017 in transplant and non-transplant (NT) hospitals.
| Transplant hospitals, including liver transplant admissions (n = 370) | ||||
|---|---|---|---|---|
| 2016–2017 (n = 96) | 2018–2020 (n = 274) | β (95% CI) / OR (95% CI) | Adjusted β (95% CI) / OR (95% CI)a | |
| LOS (days) | 7 (10) | 10 (12) | 2.7 (0.02–5.4) | −0.3 (−2.5–1.8) |
| Cost ($) | 26,098 (53,327) | 37,539 (61,800) | 11,441 (−2489–25,371) | −3972 (−14,941–6997) |
| Mortality (n,%) | 1 (1.0%) | 9 (3.3%) | 3.2 (0.40–26) | N/Ab |
| Transplant hospitals, excluding liver transplant admissions (n = 325) | ||||
|---|---|---|---|---|
| 2016–2017 (n = 87) | 2018–2020 (n = 238) | β (95% CI)/OR (95% CI) | Adjusted β (95% CI) / OR (95% CI)a | |
| LOS (days) | 5(5) | 7(7) | 2.2 (0.64–3.8) | 0.72 (−0.78–2.2) |
| Cost ($) | 11,564 (12,238) | 19,866 (29,418) | 8303 (1900–14,706) | 2619 (−2836–8074) |
| Mortality (n,%) | 1 (1.1%) | 9 (3.8%) | 3.4 (0.42–27) | N/Ab |
| NT teaching hospitals (n = 26,871) | ||||
|---|---|---|---|---|
| 2016–2017 (n = 11,090) | 2018–2020 (n = 15,781) | β (95% CI)/OR (95% CI) | Adjusted β (95% CI)/ Adjusted OR (95% CI)a | |
| LOS (days) | 5 (5) | 5 (6) | 0.25 (0.11–0.39) | −0.08 (−0.21–0.05) |
| Cost ($) | 11,196 (16,090) | 15,653 (33,947) | 4457 (3773–5142) | 3260 (3700–3820) |
| Mortality (n,%) | 254 (2.3%) | 328 (2.1%) | 0.90 (0.77–1.1) | 0.67 (0.55–0.83) |
| NT non-teaching hospitals (n = 11,767) | ||||
|---|---|---|---|---|
| 2016–2017 (n = 5760) | 2018–2020 (n = 6017) | β (95% CI)/OR (95% CI) | Adjusted β (95 % CI)/ Adjusted OR (95% CI)a | |
| LOS (days) | 5 (5) | 5 (6) | 0.03 (−0.16–0.22) | −0.16 (−0.34–0.02) |
| Cost ($) | 9773 (12,039) | 13,633 (22,691) | 3861 (3200–4522) | 3215 (2593–3836) |
| Mortality (n,%) | 90 (1.6%) | 83 (1.4%) | 0.88 (0.65–1.2) | 0.72 (0.51–1.0) |
Table 1:.
Other inter-hospital type comparisons were performed, revealing that costs in transplant hospitals that included admissions for LT were significantly higher than costs in both NT teaching and NT nonteaching hospitals in 2016–2017 (p < 0.001) and 2018–2020 (p < 0.001). When LT admissions in transplant hospitals were excluded, costs were statistically no different from NT teaching and NT non-teaching hospitals during 2016–2017 (p = 0.83 and p = 0.17, respectively), but were higher during the years 2018–2020 (p = 0.06 and p < 0.001, respectively). NT teaching hospitals also had higher expenditures, compared to NT non-teaching hospitals from 2016-2020 (p < 0.001).
LOS increased from 2016–2017 to 2018–2020 in both transplant and NT teaching hospitals, by, on average, 2.7 days and 0.25 days, respectively. However, after adjusting for factors that portend a higher mortality and morbidity, this difference dissipated. In NT non-teaching hospitals, there was no statistically significant change in LOS over time, in both adjusted and unadjusted models.
Inter-hospital type comparisons revealed that LOS was significantly higher in transplant hospitals (when LTs were included) compared to NT teaching hospitals and non-teaching hospitals from 2016 to 2020 (p < 0.001). When LT admissions from transplant hospitals were excluded, LOS was the same between transplant hospitals and NT hospitals during 2016–2017 (transplant hospital vs. NT teaching hospital: p = 0.88; transplant hospital vs. NT non-teaching hospital: p = 0.49) but was significantly longer in 2018–2020 (p < 0.001). LOS was also significantly lower in NT non-teaching hospitals, compared to their teaching counterparts (p < 0.001 in both time frames).
With respect to inpatient mortality, only NT teaching hospitals were found to have reduced deaths in 2018–2020 compared to 2016–2017, with odds ratio of 0.7 [95% confidence interval (CI): (0.6–0.8)], after adjusting for confounding factors. In NT non-teaching hospitals, the decrease in mortality in the latter years barely missed the statistically significant threshold [adjusted odds ratio (aOR): 0.72 (95% CI: 0.51–1.00); p = 0.06].
3.3Liver transplant for alcoholic hepatitisThere were 45 LTs for AH that occurred between 2016 and 2020 in the hospitals assessed by NIS. The majority (80%) occurred from 2018 to 2020. In the cohort of patients with AH who underwent LT, the predominant demographic was white (76%) and male (64%), with average age of 42 (10) years. Compared to the patients with AH who did not undergo transplant (n = 38,973), patients with LT (n = 45) had a higher frequency of private insurance as the payer (58% vs. 29%, p < 0.001) and they were also younger (p = 0.03), but there were no differences with respect to sex or race. Also, there were several clinical diagnoses that were seen at a significantly increased frequency in those who underwent LT compared to those who did not. These included: sepsis (13% vs. 2%, <0.001), infection (38% vs. 11%, p<0.001), acute respiratory failure with need for mechanical ventilation (13% vs. 2 %, p < 0.001), shock (11% vs. 1 %, <0.001), coagulopathy (27% vs. 7%, p < 0.001), hepatorenal syndrome (53% vs. 3 %, p < 0.001), hepatic encephalopathy (2% vs. 0.1%, p = 0.04), acute kidney failure (82% vs. 13%, p < 0.001), and need for dialysis (27% vs. 0.2%, p < 0.001). Patients with LT also had significantly higher APR-DRG mortality scores, with 91% having a score of 3–4 (compared to 21% in non-LT patients, p < 0.001), and they more often had NACSELD-ACLF scores that were ≥ 2 (29% vs. 2%, p < 0.001). The average hospital cost incurred by each patient was $156,818 ($87,140); the average hospital stay was 27 (21) days. No patients with LT died in-hospital. A full comparison of LT patients with the rest of the AH cohort is shown in Table S5.
3.4Propensity score (PS) matching patients with and without liver transplantThe PS-matched cohort of patients admitted with severe AH consisted of 30 LT recipients and 30 comparable patients without LT. Both controls and cases had been selected from transplant hospitals. Characteristics of the matched cohort are reported in Table 3. After matching, all characteristics were similar between both groups.
Comparison of demographic and clinical characteristics of propensity score-matched patients with and without liver transplant.
Data are described as mean (standard deviation) or n (%) as appropriate. Abbreviations: UTI- urinary traction infection; C diff- clostridium difficile infection; SBP- spontaneous bacterial peritonitis; APR-DRG- All Patients Refined Diagnosis Related Groups mortality sore. ACLF- acute on chronic liver failure mortality score.
Outcomes of the PS-matched cohort are shown in Table 4. Cost was about six times higher in patients who underwent LT (average $141,304 vs. $23,228; p < 0.001), and the LOS was almost three times higher (average 21 days vs. 8 days, p < 0.001). None of the LT recipients died while admitted, in contrast to 10% (3/30) of patients who did not undergo transplant.
Length of stay (LOS), cost, and mortality of propensity score-matched cohort.
In this nationwide (U.S.) cross-sectional study, we examined trends in patient characteristics and hospital-related outcomes related to inpatient admissions for alcoholic hepatitis between 2016 and 2020. During this time frame, LT steadily gained (and continues to gain) credence in the U.S. as a feasible treatment option for patients with first-time AH that is severe and refractory [8]. Of the 45 AH-related admissions in the NIS database that involved LT from 2016 to 2020, the majority [36/45 (80%)] took place between 2018 and 2020. Thus, the impact of LT (or simply its availability) on cost, mortality, and LOS was determined by comparing metrics between 2016–2017 and 2018–2020. Several notable findings were gleaned from our analysis.
From this study, we learned that the demographics of admitted patients with AH shifted over time. In 2018–2020 (compared to 2016–2017), patients with AH were slightly younger (45 years vs. 46 years old on average, p < 0.001), and a higher frequency of them were female (37% vs. 35%, p < 0.001). Although the absolute difference in age or sex was not large between the two timeframes, these trends highlight changes that are particularly prominent when compared with an older report analyzing the years 2011–2017, during which the median age of AH was roughly 55 years with females constituting 29–30% of the cohort [17]. More recent studies have indicated that the COVID-19 pandemic, which likely influenced results in the 2020 NIS database, was associated with increased alcohol consumption in young females due to stress and a sense of uncertainty [18].
The distribution of race among patients with AH also changed between 2016–2017 and 2018–2019, but only in small increments. Whites continued to be predominant, making up nearly 70% of admissions for AH in both time periods. These results are congruent with a prior NIS study analyzing years 2011–2017, which reported similar proportions [17]. Also, those on Medicaid, which was the most common insurance payer of those with AH, increased in frequency between the two time periods from 38% to 43% (p < 0.001). This implies that AH admissions for patients with low socioeconomic status (SES) are becoming more common, which is in line with data from 2011 to 2017 when patients with AH on Medicaid increased from 22 % to 33% [17].
Patients admitted with AH from 2018 to 2020 also suffered from more severe illness than those admitted from 2016 to 2017. They had a slightly higher (but statistically significant) frequency of infection, acute respiratory failure, and coagulopathy, and they also had significantly worse APR-DRG mortality scores (22% with scores 3–4, compared to 17% in 2016–2017) and a higher incidence of HRS, dialysis dependence, and ascites requiring paracentesis. In other words, patients with AH in 2018–2020 were more likely to have infectious, pulmonary, and renal-related complications associated with AH.
The analysis of cost, LOS, and mortality yielded noteworthy results. Among various hospital types, the highest cost was incurred by transplant hospitals, both in 2016–2017 and 2018–2020, particularly when admissions involving LT were included. When LT-related admissions were excluded, average costs were no longer significantly higher than costs in NT teaching and NT nonteaching hospitals in 2016–2017 but were somewhat higher (p = 0.06) when compared with NT teaching hospitals and significantly higher (p < 0.001) than NT non-teaching hospitals during 2018–2020. In both time frames, spending in NT teaching hospitals significantly outpaced those in NT non-teaching hospitals. When trends over time were examined, both NT teaching and non-teaching hospitals demonstrated significant increases in cost between 2016–2017 and 2018–2020, before and after adjusting for confounding factors. Within transplant hospitals, costs only significantly increased over time when those who underwent LT were excluded and only in the unadjusted model, indicating that costs were partially driven by more severe illness.
In totality, the cost analysis demonstrated that LTs weigh heavily on hospitals’ finances, which is consistent with prior studies. Thompson et al. examined the cost of LT for AH between the years 2006–2013, when LTs for this indication were much rarer, and found that the hospital cost for LT could be upwards of $145,000; for the patient, the bill was nearly $300,000, and in the 5-year period following transplant, one million dollars [19]. What was a novel finding from our study, and had not been previously reported, was that even when admissions for AH at transplant hospitals did not ultimately involve LT, costs in 2018–2020 were higher in transplant hospitals than those in NT hospitals, suggesting that more resources and services might have been used to improve patients’ transplant candidacy simply because the potential for LT existed. After adjusting for confounding factors, however, increased expenditure over time was seen not in transplant hospitals, but in NT hospitals. This follows a trend that was noticed between 2002 and 2010 and may have been related to increased utilization of hospital resources and services to optimize patients’ health prior to steroid treatment or discharge [20].
The LOS results closely paralleled those of cost, in that LOS was longest in transplant hospitals when including admissions with LT. After LT admissions were excluded, the difference in LOS between transplant hospitals and NT hospitals disappeared in 2016–2017 but remained in 2018–2020, demonstrating that as LT became more common in the latter years, more time might have been spent trying to optimize patients medically for the potential of transplant, even if it never ended up occurring. Furthermore, LOS (and cost) was higher in NT teaching hospitals than in NT non-teaching hospitals, which is a pattern that has been described before, as teaching teams may spend more time investigating patients’ illnesses, coordinating care among specialists, or optimizing patients medically before discharge [21]. Lastly, LOS increased over time in NT teaching hospitals and transplant hospitals, but only before adjusting for confounding factors. Thus, the longer LOS might have simply reflected a sicker patient population. Our findings contrast with a NIS study performed from 2002 to 2010, which showed that LOS, when not adjusted for confounding factors, remained stagnant at 6 days, among all hospital types combined [20].
In the analysis of mortality, differences were only seen in NT-teaching hospitals over time, and only in the adjusted model. NT non-teaching hospitals barely missed the statistical threshold of significance in this model (p = 0.06). In both these hospital types, the odds of inpatient mortality in 2018–2020 was close to 0.7 times the odds in 2016–2017, after adjusting for severity of disease. No difference in inpatient mortality was observed in transplant hospitals; unfortunately, adjusted analyses were not possible in transplant hospitals due to the low absolute number of deaths, resulting from small sample size. In contrast to our results, an older study from Ali et al. described a slight increase in-hospital mortality from 2009 to 2019; however, mortality data was not divided by hospital type and it was not adjusted for severity of disease [22]. Though the cause for decreased (adjusted) mortality in NT hospitals in 2018–2020, compared to the two years prior, remains speculative, it may have been related to higher rates of treatment with steroids, better optimization of patients prior to treatment, or simply more awareness about treatment options.
Of the 45 patients who underwent LT, the majority were white (75%) and male (65%). Compared to patients who did not undergo LT, they were younger and twice as many had private insurance. Those with higher SES might have had greater access to transplant hospitals or been in a stronger financial position to afford the LT and the costs that follow post-transplant. Yet, even if they were more affluent, patients who underwent LT were sicker; the majority (91%) of them had APR-DRG mortality scores of 3–4, and they also had higher rates of shock, sepsis, HRS, hepatic encephalopathy, acute renal failure, and mechanical ventilation. The need for transplant thus might have been partly driven by these critical illnesses, namely infection and AKI, which are otherwise contraindications to steroid use.
When AH patients who underwent LT were propensity-score matched with patients who did not undergo LT but had similar clinical characteristics, the former patients had costs that were about six times higher, and their LOS was almost three times higher, in keeping with current knowledge about the healthcare burden of LT [19]. Further, there was a 10% absolute reduction in inpatient deaths between the two groups; no patients with LT had died. Unfortunately, data on mortality post-discharge is not given in the NIS database, but prior studies have suggested that survival after transplant can be up to 77% at 6 months (vs. 23% in those who do not obtain LT), with a survival benefit lasting at least 2 years [23].
There were several strengths of this study. First, it was a nationwide study and highly powered, involving multiple centers from various regions of the US. Second, costs were adjusted for inflation and outcomes were adjusted for confounding factors that confer worse liver-related morbidity and mortality. The weaknesses of the study are those involving any NIS study, namely the imperfect nature of ICD-10 codes in capturing appropriate diagnoses, leading to possible mislabeling of diagnoses or lack of labeling in some cases. Furthermore, the database records admissions, but not individual patients. Given the limitations of the NIS database, only a fraction of total LTs for AH were captured (e.g., for 2019, only 12% (16/139) were included in this study) [8]. After using a low propensity match tolerance of 0.02, to ensure tight matching of patient characteristics, only 30 matched patients in transplant hospitals were found to compare outcomes between patients who underwent LT versus those who did not. The criteria to meet NACSELD-ACLF ≥ 2 were approximate, based on coding available through NIS. Finally, post-discharge outcome data are not available in the NIS.
5ConclusionsIn summary, this study found that the severity of AH is increasing, and costs are rising. However, progress has been made in reducing inpatient mortality, both in teaching and non-teaching hospitals, and all patients who underwent LT at a transplant hospital from 2016 to 2020 survived their admission. When patients with AH were admitted to transplant hospitals, particularly in 2018–2020, both cost and LOS were higher, even if patients ultimately did not undergo LT. The healthcare burden of LT on transplant hospitals must be weighed against the significant reduction in mortality seen in-hospital and afterward for patients who undergo LT. As LT for AH becomes more common in the years to come, future studies may yield additional insight into these opposing factors.
FundingThis research did not receive any specific grant from funding agencies in the public, commercial, or not-for-profit sectors.
Declaration of interestsNone.
Author contributionsShahana Prakash: Conceptualization, Methodology, Formal analysis,Investigation, Writing – original draft, Writing – review & editing.Tomohiro Tanaka: Conceptualization, Methodology, Formal analysis, Investigation, Funding acquisition, Supervision, Writing – review & editing.


