


Introduction. Host lipid metabolism influences viral replication and lifecycle of hepatitis C virus. Our aim was to evaluate changes in glucose and lipid metabolism of patients with chronic hepatitis C after therapy with direct acting antivirals (DAA).
Material and methods. We considered patients consecutively treated between January and November 2015 recording clinical data at baseline and week 24 of follow-up. Frozen serum samples were used for apolipoprotein A1 (apoA1), apolipoprotein B (apoB) and lipoprotein (a) [Lp(a)]. Wilcoxon test was utilized to estimate trends and Logistic Regression for predictors of lipid changes.
Results. We enrolled 100 patients, mostly cirrhotic (81%) and with genotype 1b (59%). Ninety-three patients achieved sustained virological response (SVR), while 7 relapsed. Homeostasis model assessment of insulin resistance declined (from 3 to 2.7, p < 0.001); non-high density lipoprotein (HDL) cholesterol increased from 102 ± 29 to 116 ± 35 (p < 0.001), and Lp(a) from 5.6 ± 6.5 to 9.8 ± 11.5 mg/dL (p < 0.001). Rise of low-density lipoprotein/HDL and apoB/apoA1 ratio were registered (from 1.79 ± 1.10 to 2.08 ± 1.05 and from 0.48 ± 0.18 to 0.53 ± 0.18 mg/dL, p < 0.001). We conducted a subanalysis on patients with relapse. In this subgroup, no change of lipid profile was recorded. At multivariate analysis emerged that the addition of ribavirin to DAA, represented an independent predictor of increased Lp(a) (OR 3.982, 95% CI 1.206-13.144, p = 0.023).
Conclusion. DAA therapy led to reduction of insulin resistance. In contrast, pro-atherogenic lipid changes were observed in patients with SVR. Further studies will be necessary to evaluate the cardiovascular balance between amelioration of glucose metabolism and negative changes of lipid profile.
Host lipids show a central role in hepatitis C virus (HCV) cell entry, polyprotein processing, replication, assembly and release.1–3 HCV binds low-density lipoprotein (LDL) and very low-density lipoprotein circulating as lipoviroparticle4 and this association seems to be important to escape the humoral immune response.5
Chronic hepatitis C (CHC) is associated with reduced total cholesterol, LDL and apolipoprotein B (ApoB) levels6 as well as with an increased rate of insulin resistance (IR) and type 2 diabetes mellitus.7 In the interferon (IFN) era, the alterations of glucose metabolism associated to HCV were reversible after viral clearance.8,9 Concerning the effect of IFN on lipids, available data are conflicting.10–12 However, Hsu, et al.13 reported that viral eradication due to IFN may significantly decrease cardiovascular (CV) morbidity.
Data regarding effect of direct-acting antivirals (DAA) on glucose and lipid metabolism are incomplete, extrapolated from clinical trials and partially contradictory.
Meissner, et al.14 reported that HCV clearance due to sofosbuvir (SOF) and ribavirin (RBV) led to early increase of ApoB/apolipoprotein A1 (ApoA1) ratio and LDL (after 4 weeks of antiviral therapy), but these lipid changes disappeared later during treatment.
Other authors showed that negative lipid changes might persist over time. Younossi, et al.15 analyzed CHC genotype (GT) 2 and 3 patients who received SOF and RBV. Four weeks after the end of therapy, GT3 patients showed significant increases in ApoB, high-density lipoprotein (HDL) and LDL as well as a decrease in apolipoprotein E. Mauss, et al.11 reported a median LDL increase of 17 mg/dL at 12 weeks after the end of DAA therapy. Hashimoto, et al.16 suggested that the rapid suppression of HCV core protein by DAA might result in a decrease of lipid droplet production in HCV-infected liver cells, leading to a massive rebound of circulating LDL.
The whole analysis of lipid metabolism should include not only cholesterol and triglycerides but also other lipid patterns. ApoB/ApoA1 ratio is a better predictor of CV disease compared to LDL alone,17,18 ApoB is the best direct marker of atherogenic small dense LDL19 and ApoA1 provides a good estimate of HDL.20 Lipoprotein (a) [Lp(a)] consists of a cholesterol-laden LDL-like particle bound to a plasminogen-like glycoprotein.21 Interestingly, Lp(a) is genetically determined and represents a drug-resistant independent risk factor for CV disease.22
Regarding lipoproteins, Younossi, et al.23 selected GT1 subjects with sustained virological response (SVR) after treatment with ledipasvir/SOF (± RBV). At week 4 after treatment, ApoB and LDL increased while ApoA1 and apolipoprotein E declined.
We aimed to evaluate changes of glucose and lipid metabolism due to DAA treatment in a real-life context.
Material and MethodsStudy designThis was a cohort study on consecutively treated patients with HCV infection who received interferon-free regimens at a tertiary referral center in Emilia Romagna (Italy). Patients began antiviral therapy between January and November 2015. DAA protocol, treatment length and addition of RBV were established following the priority criteria of Italian Medicines Agency committee.24 Eligible patients were aged 18 years or older who were positive for HCV infection as established by both positive serum HCV antibody titers and serum HCV-ribonucleic acid (using real-time Polymerase Chain Reaction-based method), had evidence of liver fibrosis as assessed by biopsy or non-invasive test [Transient Elastography (FibroScan®)] and were followed for at least 24 weeks after therapy. Liver transplantation represented an exclusion criterion. At baseline and at the 24-week follow-up, the following data were collected: diet and exercise pattern, pharmacological therapy, body mass index, waist circumference, blood pressure, fasting laboratory tests including whole glucose and lipid profiles [glycemia, insulin, homeostatic model assessment of IR (HOMA-IR), total cholesterol, LDL, HDL, the LDL/HDL ratio, non-HDL cholesterol, triglycerides] and liver function tests (with calculation of Child-Turcotte-Pugh and Model for End-stage Liver Disease). Criteria for metabolic syndrome (MS)25 were assessed. Serum from baseline and the 24-week follow-up were isolated from whole blood following clotting, centrifuged and immediately stored at −80°C until thawed for further analysis. Pre-collected sera were used for apolipoprotein assessment. ApoA1 and ApoB were determined by a turbidimetric immunoassay test (ASSEL s.r.l., Rome, Italy). Sera containing antigen were added to a solution with a specific antibody that triggered a reaction resulting in turbidity. It was measurable at 340 nm and appeared proportional to concentration of either ApoA1 or Apo B in the sample. Serum Lp(a) concentration was determined by latex immuno turbidimetric method [Lp(a) latex ABCO Diagnostic s.r.l.]. When the sample was mixed with appropriate buffer and latex particles coated with anti-Lp(a), Lp(a) reacted with antibodies leading to agglutination of latex particles. This agglutination was detected as a turbidity change (620 nm) proportional to Lp(a) concentration in the sample.
Statistical analysisAn expert and specifically trained biostatistician performed the statistical analysis. All samples were encoded into a dedicated database. Descriptive statistical analyses were developed at baseline and at the 24-week follow-up. Data are expressed as the mean [± standard deviation (sd)], median (with range) or delta values as applicable. Confidence interval (CI) is presented where appropriate. Significant differences between variables were calculated with non-parametric tests. χ2 or Fisher’s exact test was used for categorical while Kruskal-Wallis for continuous variables. Wilcoxon tes t was utilized to assess tendencies and specific rank test for significance. Logistic Regression was performed for searching the potential predictors of altered lipid metabolism. A p value less than 0.05 was considered significant for all tests. SPSS® software version 20.0 (MJ Norusis, Chicago, US) was used for all statistical analyses.
The laboratory tests described in the present study are not experimental, but they can be performed according to the physician’s decision. However, patients had given informed consent to utilize their stored sera for planned controls.
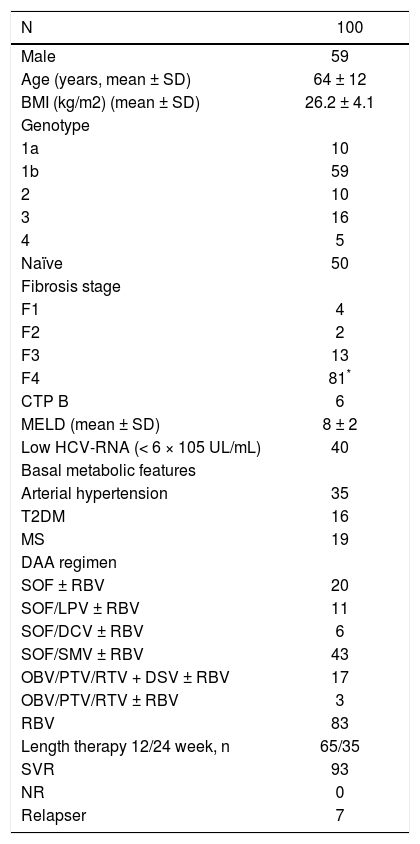
ResultsPatient populationDuring the study period, 115 patients were treated with DAA, and 100 fulfilled the established criteria (Figure 1). Main clinical patterns of entire cohort are reported in table 1.

Baseline features of the entire study population.
| N | 100 |
|---|---|
| Male | 59 |
| Age (years, mean ± SD) | 64 ± 12 |
| BMI (kg/m2) (mean ± SD) | 26.2 ± 4.1 |
| Genotype | |
| 1a | 10 |
| 1b | 59 |
| 2 | 10 |
| 3 | 16 |
| 4 | 5 |
| Naïve | 50 |
| Fibrosis stage | |
| F1 | 4 |
| F2 | 2 |
| F3 | 13 |
| F4 | 81* |
| CTP B | 6 |
| MELD (mean ± SD) | 8 ± 2 |
| Low HCV-RNA (< 6 × 10⁵ UL/mL) | 40 |
| Basal metabolic features | |
| Arterial hypertension | 35 |
| T2DM | 16 |
| MS | 19 |
| DAA regimen | |
| SOF ± RBV | 20 |
| SOF/LPV ± RBV | 11 |
| SOF/DCV ± RBV | 6 |
| SOF/SMV ± RBV | 43 |
| OBV/PTV/RTV + DSV ± RBV | 17 |
| OBV/PTV/RTV ± RBV | 3 |
| RBV | 83 |
| Length therapy 12/24 week, n | 65/35 |
| SVR | 93 |
| NR | 0 |
| Relapser | 7 |
Diagnosis of cirrhosis was performed with liver biopsy in 10 patients and with transient elastography in the other subjects. BMI: Body mass index. CTP: Child-Turcotte-Pugh. MELD: Model for End-stage Liver Disease. HCV: Hepatitis C virus. T2DM: Type 2 diabetes mellitus. MS: Metabolic syndrome. SOF: Sofosbuvir. RBV: Ribavirin. LPV: Ledipasvir. DCV: Daclatasvir. SMV: Simeprevir. OBV: Ombitasvir. PTV: Paritaprevir. RTV: Ritonavir. DSV: Dasabuvir. SVR: Sustained virological response. NR: Non responder.
At the beginning of study period, 2 patients were taking lipid-lowering therapy (rosuvastatin; all with stable dosage in the last three months before enrollment) and 21 anti-diabetics (metformin; all with stable dosage in the last three months before enrollment).
Significant modifications in liver function with regards to albumin, bilirubin, prothrombin time, Model for Endstage Liver Disease or Child-Turcotte-Pugh score were not registered during the study period.
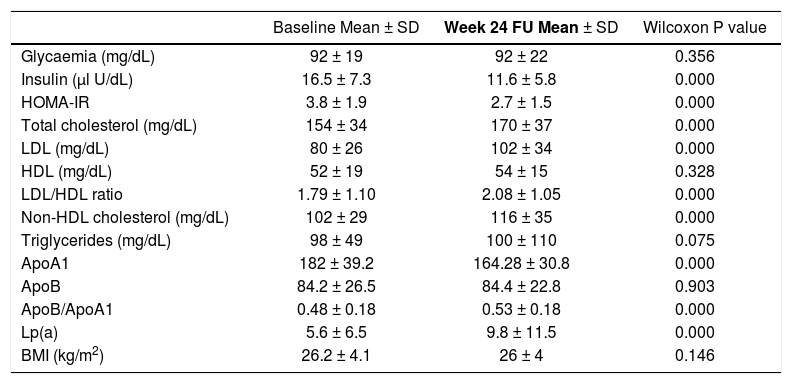
Metabolic changes from baseline to the 24-week follow-up are reported in table 2. Significant modifications in type 2 diabetes mellitus status, arterial hypertension, and MS were not observed. Body mass index values remained stable during the study period. During the study period, no patient modified the anti-diabetic or the lipid-lowering therapy. Patients did not change their lifestyle (diet and aerobic exercise).
Metabolic changes from baseline to week 24 of follow-up.
| Baseline Mean ± SD | Week 24 FU Mean ± SD | Wilcoxon P value | |
|---|---|---|---|
| Glycaemia (mg/dL) | 92 ± 19 | 92 ± 22 | 0.356 |
| Insulin (µl U/dL) | 16.5 ± 7.3 | 11.6 ± 5.8 | 0.000 |
| HOMA-IR | 3.8 ± 1.9 | 2.7 ± 1.5 | 0.000 |
| Total cholesterol (mg/dL) | 154 ± 34 | 170 ± 37 | 0.000 |
| LDL (mg/dL) | 80 ± 26 | 102 ± 34 | 0.000 |
| HDL (mg/dL) | 52 ± 19 | 54 ± 15 | 0.328 |
| LDL/HDL ratio | 1.79 ± 1.10 | 2.08 ± 1.05 | 0.000 |
| Non-HDL cholesterol (mg/dL) | 102 ± 29 | 116 ± 35 | 0.000 |
| Triglycerides (mg/dL) | 98 ± 49 | 100 ± 110 | 0.075 |
| ApoA1 | 182 ± 39.2 | 164.28 ± 30.8 | 0.000 |
| ApoB | 84.2 ± 26.5 | 84.4 ± 22.8 | 0.903 |
| ApoB/ApoA1 | 0.48 ± 0.18 | 0.53 ± 0.18 | 0.000 |
| Lp(a) | 5.6 ± 6.5 | 9.8 ± 11.5 | 0.000 |
| BMI (kg/m2) | 26.2 ± 4.1 | 26 ± 4 | 0.146 |
FU: follow-up, SD: standard deviation. HOMA-IR: Homeostatic Model Assessment of Insulin Resistance. LDL: Low density lipoprotein. HDL: High density lipoprotein. ApoA1: Apolipoprotein A1. ApoB: Apolipoprotein B. Lp(a): Lipoprotein (a). BMI: Body mass index.
The mean glycemia values did not change while the mean insulin levels and HOMA-IR decreased (from 16.5 ± 7.3 to 11.6 ± 5.8, p < 0.001 and from 3.8 ± 1.9 to 2.7 ± 1.5, p < 0.001, respectively). The median insulin level decreased from 16 (range 2-38) to 10 (range 0.5-31) µIU/mL and HOMA-IR from 3.5 (range 0.4-9.3) to 2.3 (range 0.3-8.1) (Figure 2). The insulin levels declined in 69% of patients while the HOMA-IR was decreased in 78% of patients. The mean delta HOMA-IR (week 24 - baseline) was −1.1 ± 1.6, while the median value was −0.7 (range -6.6 − +2.8) (Figure 3).
.")
.")
The HDL and triglyceride levels did not change over time, but the mean total cholesterol and LDL values were significantly increased (from 154 ± 34 to 170 ± 37 mg/dL, p < 0.001 and from 80 ± 26 to 102 ± 34 mg/dL, p < 0.001, respectively). The median total cholesterol increased from 151 (range 81-249) to 170 (range 75-249) mg/dl, and the LDL increased from 75 (range 25-148) to 103 (range 22-179) mg/dL. The total cholesterol was elevated in 71% of subjects, while the LDL concentration was increased in 73%. The mean delta LDL (week 24 - baseline) was +23 ± 32 mg/dL, while the median value was +24 (range −62 − + 98) mg/dL. The mean LDL/HDL ratio was significantly increased (from 1.79 ± 1.10 to 2.08 ± 1.05 mg/dL, p < 0.001). The median LDL/HDL ratio increased from 1,55 (range 0.59-8.13) to 1.83 (range 0.41-6.07). The LDL/HDL ratio was elevated in 68% of the cases. The mean delta LDL/HDL ratio was +0.28 ± 1.03 mg/dL, while the median value was +0.24 (range −5.23 − +3.08) mg/dL. The mean non-HDL cholesterol increased from 102 ± 29 to 116 ± 35 mg/dL (p < 0.001). The median values were 97 (range 42-206) and 114 (range 39-204) mg/dL, respectively (Figure 4). The non-HDL cholesterol was increased in 67% of patients. The mean delta was + 14 ± 32 mg/dL, while the median value was +13 (range −78 − +102) mg/ dL (Figure 5).
.")
.")
Changes in apolipoprotein levels from baseline to the 24-week follow-up are reported in table 2. During the study period, the ApoB levels did not change. The mean ApoA1 levels significantly decreased from 182 ± 39.2 to 164 ± 31 mg/dL (p < 0,001), and the median declined from 178 (range 74-277) to 160 (range 93-236) mg/dL. The ApoA1 levels decreased in 75% of cases, and the mean delta ApoA1 was −17.7 ± 33.7 mg/dL (median value −19, range −105 −+65 mg/dL). The mean ApoB/ApoA1 ratio increased from 0.48 ± 0.18 to 0.53 ± 0.18 mg/dL (p < 0.001), and median ApoB/ApoA1 ratio increased from 0.45 (range 0.23-1.18) to 0.50 (range 0.27-1.14) mg/dL. The ApoB/ApoA1 ratio was increased in 69% of subjects with a delta ApoB/ ApoA1 ratio of+0.05 ± 0.14 mg/dL (median +0.06, range −0.37 − +0.38 mg/dL).
The mean Lp(a) value increased from 5.6 ± 6.5 to 9.8 ± 11.5 mg/dL (p < 0.001), while the median value increased from 3.3 (range 0.3-30.4) to 5.7 (range 0.5-69.5) mg/dL. The Lp(a) was increased in 84% of patients, and the delta Lp(a) was +4.2 ± 6.9 mg/dL (median +1.7, range −0.5 −+43.5) (Figures 6 and 7).
![Distribution of ApoA1, ApoB/ApoA1 ratio and Lp(a) at baseline and 24-week of follow-up. Horizontal bar inside the box represents median values lApoA1, apolipoprotein; ApoB, apolipoprotein B; Lp(a), lipoprotein (a)].](https://static.elsevier.es/multimedia/16652681/0000001700000001/v2_201905311150/S1665268119301085/v2_201905311150/en/main.assets/gr6.jpeg?xkr=ue/ImdikoIMrsJoerZ+w997EogCnBdOOD93cPFbanNeKOJqKH5+Za6P+RA5Vq9DlSIM4aojloVqoLEHvANGVfp3qk6rn9k4c0VHO1/a6NYSi5SQgxaASr31OUKVucSIduHXkryFXYyrrqP07r3zfTOEuxz8YLpWOUMBg0blxJ/5fbm69Fbs1rUGKqO82LDDaOIolzaddJ56xuEhBKZhnlybZRYzclQW5c+DbO6Ct2exTbPLwMLB/fV2mEG85/GtIxan/SUe1fT0dJmK34lLS0pBu7+LNPhGqDgu89dKKp3c= "Distribution of ApoA1, ApoB/ApoA1 ratio and Lp(a) at baseline and 24-week of follow-up. Horizontal bar inside the box represents median values lApoA1, apolipoprotein; ApoB, apolipoprotein B; Lp(a), lipoprotein (a)].")
![Individual delta ApoA1, delta ApoB/ApoA1 ratio and delta Lp(a) value. Each square represents a patient. Arrows indicated the relapsers [ApoA1, apolipoprotein; ApoB, apolipoprotein B; Lp(a), lipoprotein (a)].](https://static.elsevier.es/multimedia/16652681/0000001700000001/v2_201905311150/S1665268119301085/v2_201905311150/en/main.assets/gr7.jpeg?xkr=ue/ImdikoIMrsJoerZ+w997EogCnBdOOD93cPFbanNeKOJqKH5+Za6P+RA5Vq9DlSIM4aojloVqoLEHvANGVfp3qk6rn9k4c0VHO1/a6NYSi5SQgxaASr31OUKVucSIduHXkryFXYyrrqP07r3zfTOEuxz8YLpWOUMBg0blxJ/5fbm69Fbs1rUGKqO82LDDaOIolzaddJ56xuEhBKZhnlybZRYzclQW5c+DbO6Ct2exTbPLwMLB/fV2mEG85/GtIxan/SUe1fT0dJmK34lLS0pBu7+LNPhGqDgu89dKKp3c= "Individual delta ApoA1, delta ApoB/ApoA1 ratio and delta Lp(a) value. Each square represents a patient. Arrows indicated the relapsers [ApoA1, apolipoprotein; ApoB, apolipoprotein B; Lp(a), lipoprotein (a)].")
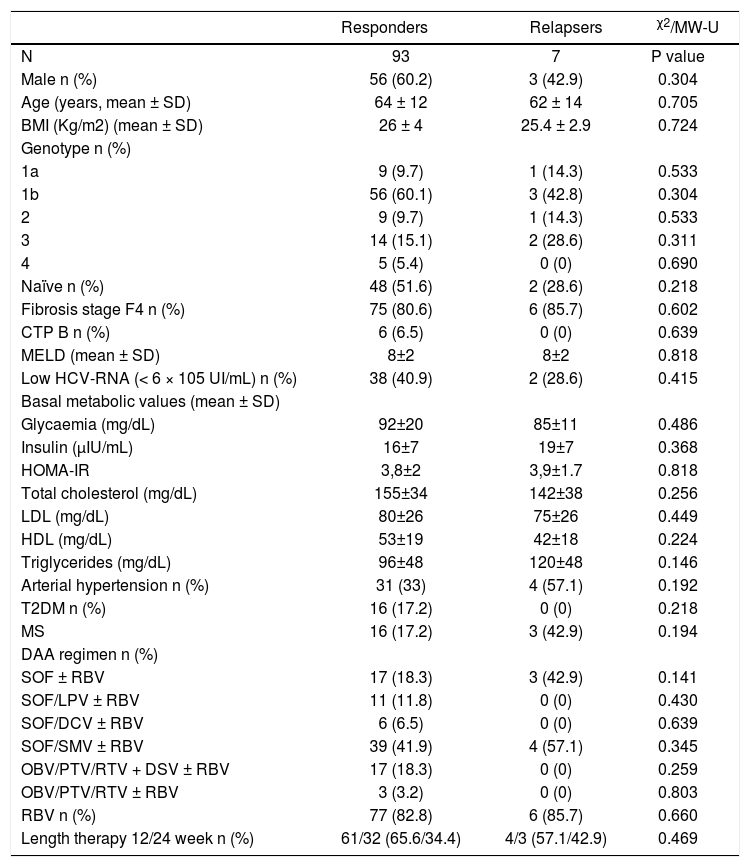
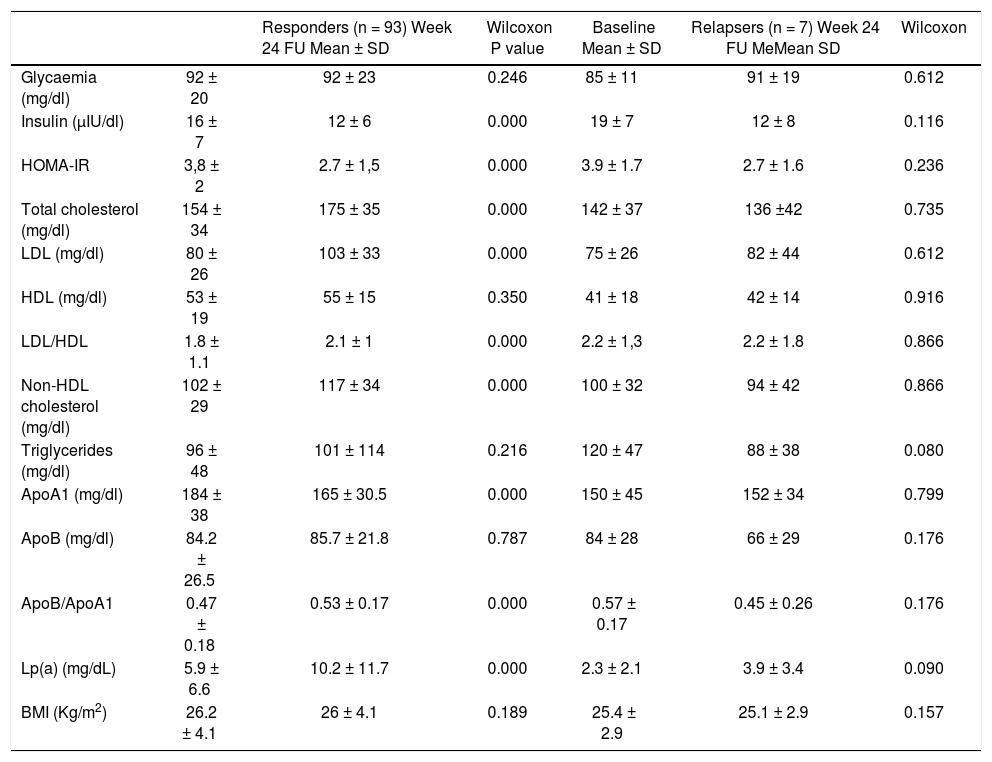
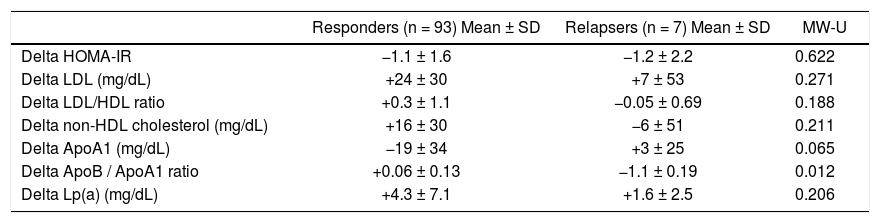
Patients achieving SVR at 24 weeks after the end of treatment and subjects with virological relapse were compared for all patterns. Any significant difference was observed between the two subgroups (Table 3). As shown in table 4, changes in glucose and lipid profile were observed in patients with SVR but not in relapsers. Concerning mean delta values, relevant discrepancies were found in delta LDL/HDL ratio (+0.3 ± 1.1 in responders vs. −0.0 5 ± 0.69 in relapsers, p = 0.188), delta non-HDL cholesterol (+16 ± 30 vs. −6 ± 51 mg/dL, p = 0,211), delta ApoA1 (−19 ± 34 vs. +3 ± 25 mg/dL, p = 0,065). However, the largest difference was observed in the delta ApoB/ApoA1 ratio (+0.06 ± 0.13 vs. −1.1 ± 0.19, p = 0.012) (Table 5). In figures 3, 5 and 7, we indicated the individual delta values of patients with virological relapse.
Main baseline features of patients subdivided according to virological response.
| Responders | Relapsers | χ2/MW-U | |
|---|---|---|---|
| N | 93 | 7 | P value |
| Male n (%) | 56 (60.2) | 3 (42.9) | 0.304 |
| Age (years, mean ± SD) | 64 ± 12 | 62 ± 14 | 0.705 |
| BMI (Kg/m2) (mean ± SD) | 26 ± 4 | 25.4 ± 2.9 | 0.724 |
| Genotype n (%) | |||
| 1a | 9 (9.7) | 1 (14.3) | 0.533 |
| 1b | 56 (60.1) | 3 (42.8) | 0.304 |
| 2 | 9 (9.7) | 1 (14.3) | 0.533 |
| 3 | 14 (15.1) | 2 (28.6) | 0.311 |
| 4 | 5 (5.4) | 0 (0) | 0.690 |
| Naïve n (%) | 48 (51.6) | 2 (28.6) | 0.218 |
| Fibrosis stage F4 n (%) | 75 (80.6) | 6 (85.7) | 0.602 |
| CTP B n (%) | 6 (6.5) | 0 (0) | 0.639 |
| MELD (mean ± SD) | 8±2 | 8±2 | 0.818 |
| Low HCV-RNA (< 6 × 10⁵ UI/mL) n (%) | 38 (40.9) | 2 (28.6) | 0.415 |
| Basal metabolic values (mean ± SD) | |||
| Glycaemia (mg/dL) | 92±20 | 85±11 | 0.486 |
| Insulin (μIU/mL) | 16±7 | 19±7 | 0.368 |
| HOMA-IR | 3,8±2 | 3,9±1.7 | 0.818 |
| Total cholesterol (mg/dL) | 155±34 | 142±38 | 0.256 |
| LDL (mg/dL) | 80±26 | 75±26 | 0.449 |
| HDL (mg/dL) | 53±19 | 42±18 | 0.224 |
| Triglycerides (mg/dL) | 96±48 | 120±48 | 0.146 |
| Arterial hypertension n (%) | 31 (33) | 4 (57.1) | 0.192 |
| T2DM n (%) | 16 (17.2) | 0 (0) | 0.218 |
| MS | 16 (17.2) | 3 (42.9) | 0.194 |
| DAA regimen n (%) | |||
| SOF ± RBV | 17 (18.3) | 3 (42.9) | 0.141 |
| SOF/LPV ± RBV | 11 (11.8) | 0 (0) | 0.430 |
| SOF/DCV ± RBV | 6 (6.5) | 0 (0) | 0.639 |
| SOF/SMV ± RBV | 39 (41.9) | 4 (57.1) | 0.345 |
| OBV/PTV/RTV + DSV ± RBV | 17 (18.3) | 0 (0) | 0.259 |
| OBV/PTV/RTV ± RBV | 3 (3.2) | 0 (0) | 0.803 |
| RBV n (%) | 77 (82.8) | 6 (85.7) | 0.660 |
| Length therapy 12/24 week n (%) | 61/32 (65.6/34.4) | 4/3 (57.1/42.9) | 0.469 |
Chi square. MW-U: Mann-Whitney U test. BMI: Body mass index. CTP: Child-Turcotte-Pugh. MELD: Model for End-stage Liver Disease. HCV: Hepatitis C virus. HoMA-IR: Homeostatic Model Assessment of Insulin Resistance. LDL: Low Density Lipoprotein. HDL: High Density Lipoprotein. T2DM: Type 2 diabetes mellitus. MS: Metabolic syndrome. SOF: Sofosbuvir. RBV: Ribavirin. LPV: Ledipasvir. DCV: Daclatasvir. SMV: simeprevir. OBV: Ombitasvir. PTV: paritaprevir. RTV: Ritonavir. DSV: Dasabuvir. SVR: Sustained virological response. NR: Non responder.
Metabolic changes from baseline to week 24 of follow-up according to virological response.
| Responders (n = 93) Week 24 FU Mean ± SD | Wilcoxon P value | Baseline Mean ± SD | Relapsers (n = 7) Week 24 FU MeMean SD | Wilcoxon | ||
|---|---|---|---|---|---|---|
| Glycaemia (mg/dl) | 92 ± 20 | 92 ± 23 | 0.246 | 85 ± 11 | 91 ± 19 | 0.612 |
| Insulin (µIU/dl) | 16 ± 7 | 12 ± 6 | 0.000 | 19 ± 7 | 12 ± 8 | 0.116 |
| HOMA-IR | 3,8 ± 2 | 2.7 ± 1,5 | 0.000 | 3.9 ± 1.7 | 2.7 ± 1.6 | 0.236 |
| Total cholesterol (mg/dl) | 154 ± 34 | 175 ± 35 | 0.000 | 142 ± 37 | 136 ±42 | 0.735 |
| LDL (mg/dl) | 80 ± 26 | 103 ± 33 | 0.000 | 75 ± 26 | 82 ± 44 | 0.612 |
| HDL (mg/dl) | 53 ± 19 | 55 ± 15 | 0.350 | 41 ± 18 | 42 ± 14 | 0.916 |
| LDL/HDL | 1.8 ± 1.1 | 2.1 ± 1 | 0.000 | 2.2 ± 1,3 | 2.2 ± 1.8 | 0.866 |
| Non-HDL cholesterol (mg/dl) | 102 ± 29 | 117 ± 34 | 0.000 | 100 ± 32 | 94 ± 42 | 0.866 |
| Triglycerides (mg/dl) | 96 ± 48 | 101 ± 114 | 0.216 | 120 ± 47 | 88 ± 38 | 0.080 |
| ApoA1 (mg/dl) | 184 ± 38 | 165 ± 30.5 | 0.000 | 150 ± 45 | 152 ± 34 | 0.799 |
| ApoB (mg/dl) | 84.2 ± 26.5 | 85.7 ± 21.8 | 0.787 | 84 ± 28 | 66 ± 29 | 0.176 |
| ApoB/ApoA1 | 0.47 ± 0.18 | 0.53 ± 0.17 | 0.000 | 0.57 ± 0.17 | 0.45 ± 0.26 | 0.176 |
| Lp(a) (mg/dL) | 5.9 ± 6.6 | 10.2 ± 11.7 | 0.000 | 2.3 ± 2.1 | 3.9 ± 3.4 | 0.090 |
| BMI (Kg/m2) | 26.2 ± 4.1 | 26 ± 4.1 | 0.189 | 25.4 ± 2.9 | 25.1 ± 2.9 | 0.157 |
FU: Follow-up. SD: Standard deviation. HOMA-IR: Homeostatic Model Assessment of Insulin Resistance. LDL: Low density lipoprotein. HDL: High density lipoprotein. ApoA1: Apolipoprotein A1. ApoB: apolipoprotein B. Lp(a): Lipoprotein (a). BMI: Body mass index.
Delta values from baseline to week 24 of follow-up according to virological response.
| Responders (n = 93) Mean ± SD | Relapsers (n = 7) Mean ± SD | MW-U | |
|---|---|---|---|
| Delta HOMA-IR | −1.1 ± 1.6 | −1.2 ± 2.2 | 0.622 |
| Delta LDL (mg/dL) | +24 ± 30 | +7 ± 53 | 0.271 |
| Delta LDL/HDL ratio | +0.3 ± 1.1 | −0.05 ± 0.69 | 0.188 |
| Delta non-HDL cholesterol (mg/dL) | +16 ± 30 | −6 ± 51 | 0.211 |
| Delta ApoA1 (mg/dL) | −19 ± 34 | +3 ± 25 | 0.065 |
| Delta ApoB / ApoA1 ratio | +0.06 ± 0.13 | −1.1 ± 0.19 | 0.012 |
| Delta Lp(a) (mg/dL) | +4.3 ± 7.1 | +1.6 ± 2.5 | 0.206 |
MW-U: Mann-Whitney U test. SD: Standard deviation. HOMA-IR: Homeostatic Model Assessment of Insulin Resistance. LDL: Low density lipoprotein. HDL: High density lipoprotein. ApoA1: Apolipoprotein A1. ApoB: Apolipoprotein B. Lp(a): Lipoprotein (a). BMI: Body mass index.
CHC infection is associated with onset of hepatic steatosis and a decrease of total cholesterol, LDL and apoB, and all these changes were more pronounced in GT3 patients.26 In our study cohort, there were no differences regarding the basal levels of lipids between patients with GT3 and the other patients with the exception of ApoA1, which was significantly lower in GT3 patients (161 ± 29 vs. 186 ± 40 mg/dL, p = 0.010). Delta ApoA1 was also drastically different (−0.125 ± 30 mg/dL in GT3 vs. −21 ± 33 mg/dL in the others, p = 0.020). Regarding the lipid changes from baseline to week 24 of the follow-up, when considering only patients with GT3 infection, there were significant modifications in the total cholesterol, LDL and Lp(a) levels (138 ± 36 to 167 ± 41 mg/dL, p = 0.021, 73 ± 25 to 107 ± 32 mg/dL, p = 0.008 and 8 ± 8 to 12 ± 10 mg/ dL, p = 0.001, respectively). Notably, other changes in the lipid profile were similar to those of the entire cohort, but these differences were not significant. In particular, the LDL/HDL ratio, non-HDL cholesterol, ApoB, and the ApoB/ApoA1 ratio showed an increasing trend while ApoA1 tended to decrease.
Univariate and multivariate analyses for predictors of lipid alterationsUnivariate analysis for predictors of LDL increase indicated that RBV was the unique variable with significant p value [Odds Ratio (OR) 4.062, 95% CI 1,371-12,035, p = 0.011]. We then tested all variables for the predictive capacity of an increased LDL/HDL ratio. Again, only RBV emerged as a significant variable for the univariate analysis (OR 5.413, 95% CI 1.782-16.441, p = 0.003). Considering the potential predictors for increases in non-HDL cholesterol, only RBV showed a p value < 0.1 (OR 5,083, 95% CI 1.679-15.390, p = 0.004).
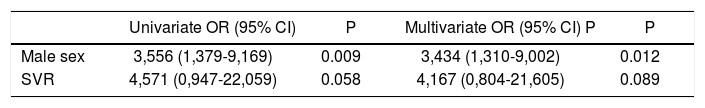
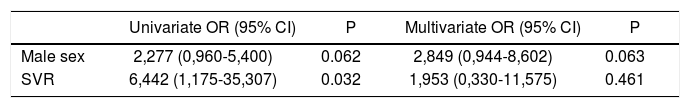
Concerning the predictive factors for decreases in ApoA1, male gender and SVR achievement showed significance in the univariate analysis (OR 3.556, 95% CI 1,379-9,169, p = 0.009 and OR 4.571, 95% CI 0.947-22.059, p = 0.058, respectively). At the multivariate analysis, only male gender emerged as independent predictor (OR 3,434, 95% CI 1,310-9,002, p=0.012) (Table 6). Male gender and SVR were significant at univariate analysis for predictors of ApoB/ApoA1 ratio increase (OR 2.277, 95% CI 0,960-5,400, p = 0.062 and OR 6.442, 95% CI 1,175-35.307, p = 0.032, respectively). The multivariate test failed to identify significant factor (Table 7).
Predictors of ApoA1 decrease.
| Univariate OR (95% CI) | P | Multivariate OR (95% CI) P | P | |
|---|---|---|---|---|
| Male sex | 3,556 (1,379-9,169) | 0.009 | 3,434 (1,310-9,002) | 0.012 |
| SVR | 4,571 (0,947-22,059) | 0.058 | 4,167 (0,804-21,605) | 0.089 |
We reported only factors found to be significant at Univariate analysis (p value < 0.1). OR: Odds ratio. CI: Confidence interval. SVR: Sustained virological response.
Predictors of ApoB/ApoA1 ratio increase.
| Univariate OR (95% CI) | P | Multivariate OR (95% CI) | P | |
|---|---|---|---|---|
| Male sex | 2,277 (0,960-5,400) | 0.062 | 2,849 (0,944-8,602) | 0.063 |
| SVR | 6,442 (1,175-35,307) | 0.032 | 1,953 (0,330-11,575) | 0.461 |
We reported only factors found to be significant at Univariate analysis (p value < 0.1). OR: Odds ratio. CI: Confidence interval. SVR: Sustained virological response.
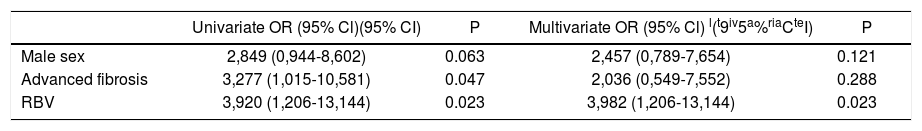
Univariate analysis for predictors for increased Lp(a) indicated that male gender, advanced fibrosis and the use of RBV had p values < 0.1 (OR 2.849, 95% CI 0.944-8.602, p = 0.063, OR 3.277, 95% CI 1.015-10.581, p = 0.047 and OR 3.920, 95% CI 1.206-13.144, p = 0.023, respectively). The multivariate analysis showed that RBV use was an independent predictor of Lp(a) increase (OR 3,982, 95% CI 1.206-13.144, p = 0.023) (Table 8).
Predictors of Lp(a) rise.
| Univariate OR (95% Cl)(95% CI) | P | Multivariate OR (95% Cl) l(t9iv5a%riaCteI) | P | |
|---|---|---|---|---|
| Male sex | 2,849 (0,944-8,602) | 0.063 | 2,457 (0,789-7,654) | 0.121 |
| Advanced fibrosis | 3,277 (1,015-10,581) | 0.047 | 2,036 (0,549-7,552) | 0.288 |
| RBV | 3,920 (1,206-13,144) | 0.023 | 3,982 (1,206-13,144) | 0.023 |
We reported only factors found to be significant at Univariate analysis (p value < 0.1). OR: Odds ratio. CI: Confidence interval. RBV: Ribavirin.
Patients with CHC show a reduction of total cholesterol, LDL and ApoB levels6 but also a worsening of glucose metabolism.7 Few studies described the impact of DAA on glucose and lipid metabolism, and available data are incomplete and contradictory.11,14–16 Notably, Hashimoto, et al.16 suggested that the rapid suppression of HCV core proteins due to DAA may lead to a deregulation of host lipid metabolism that manifests as a decrease of lipid droplet production in HCV-infected liver cells and a large rebound of circulating LDL.
This negative impact on lipid metabolism is either absent or underestimated in cases of IFN-based therapy probably due to the frequent presence of anorexia.27 In general, the well-known differences between IFN-based therapy and DAA make these approaches incomparable with regard to metabolic changes.
We proposed a real-life study with a complete analysis of glucose and lipid changes over a follow-up period through 24 weeks after the end of treatment. To estimate the apolipoprotein levels is the most appropriate way for studying the effect of DAA on lipid metabolism.19,20 Notably, we examined the Lp(a) that represents an independent drug-resistant marker of CV disease.22 Moreover, we evaluated other relevant patterns of the lipid profile such as the LDL/HDL ratio, the ApoB/ApoA1 ratio, and non-HDL cholesterol levels, and we recorded some potential confounding factors such as body mass index, lifestyle changes, drug modifications and liver function tests.
We demonstrated that viral clearance due to DAA led to significant decrease of HOMA-IR, rise of total cholesterol, LDL, LDL/HDL ratio and non-HDL cholesterol regardless of DAA regimen or fibrotic stage. Furthermore, patients achieving SVR showed a relevant decrease in the ApoA1 levels and an increase in the ApoB/ApoA1 ratio. Finally, Lp(a) was significantly elevated in patients who achieved SVR. All the changes in glucose and lipid metabolism occurred without modifications of body mass index, changes of metabolic drug regimens or variations of lifestyle. In particular, regarding lipid-lowering drugs, as expected, at the beginning of the study period only 2 patients were taking them (both rosuvastatin). The reported alterations of lipid profile were registered also in that two patients but dedicated larger studies will be necessary to analyze the possible specific role of statins during or after DAA therapy. Regarding anti-diabetic drugs, at the start of study period 21 patients were taking anti-diabetic medication (all metformin). The favorable modifications of the glucose metabolism in terms of insulin and HOMA were registered also in patients on anti-diabetic therapy. Notably, no patient changed his therapy during the study period neither as kind of drug nor as dosage.
Cholesterol levels can be considered an important index of liver synthesis, and viral clearance may lead to recovery of liver function.28 Indeed, we evaluated albumin, bilirubin, prothrombin time, Model for End-stage Liver Disease and Child-Turcotte-Pugh score, not recording any significant change. Remarkably, we demonstrated that the modifications of the glucose and lipid profile were absent in patients with virological relapse, thus suggesting a potential role of HCV clearance. Markedly, the few number of relapsers makes actually impossible to draw solid conclusions about this subgroups.
All HCV patients present a decrease of total cholesterol, LDL and ApoB, and these changes were more pronounced in GT3 subjects with respect to other GT.26 For this reason, we conducted a thorough analysis on this subgroup. Considering only patients with GT3, we found increases of total cholesterol, LDL and Lp(a) from baseline to week 24 of follow-up with significant p values. Other alterations of the lipid profile that were described among the whole cohort were present in the GT3 subpopulation but without statistical significance. Indeed, the worsening of the lipid profile due to DAA seemed to be less pronounced in the GT3 subgroup.
We demonstrated that the male gender represented an independent predictor of decreases in ApoA1, while the use of RBV could predict elevated Lp(a). It is well known that the male gender is a strong risk factor for both dyslipidemia and CV disease.29 In contrast, the effect of RBV on lipid alterations represents a partial novelty. In fact, Younossi, et al.23 reported that RBV use had an additive effect on ApoA1 and apolipoprotein E in comparison with RBV-free regimens. This decline in lipoprotein levels may cause an impairment of immune escape mechanism of HCV, which could clarify the advantage of DAA/RBV with respect to RBV-free regimen in difficult-to-treat patients.
According to our data, RBV seemed to determine a major deregulation of the balance between virus and host lipid metabolism but we have not elements to explain it. Further dedicated studies might investigate the possible molecular interaction between RBV and lipid metabolism.
This study has some limitations. The first is the relatively small number of patients included, but the size of this cohort is similar to others reported in previous studies.11,14–16,23 Another limitation is the retrospective design. On the other hand, to the best of our knowledge, this is the first study offering the following novelties regarding the effect of DAA on glucose and lipid metabolism:
- •
The first real-life study analyzing whole-body glucose, lipid and behavioral patterns.
- •
The first examining LDL/HDL ratio, ApoB/ApoA1 ratio, non-HDL cholesterol and mostly Lp(a) that is a strong drug-resistant predictor of CV events; and
- •
The first with a such long observation period.
In conclusion, since HCV positive patients show a major CV risk with respect to non-infected subjects30,31 and IFN-based therapy decreases that risk,13 we expected that DAA might also have a positive impact on the CV profile. In this context, we reported that the viral clearance due to DAA led to an improvement of glucose metabolism associated with a global worsening of lipid profile. Further prospective studies with long follow-up period and specific cardiological assessments are mandatory to verify if the modifications of lipid profile might be simply a return to a pre-virological state and to analyze the potential impact of those alterations on the CV risk. Notably, the negative effect on the lipid profile may be at least partially compensated by the decrease of IR, which itself should reduce the CV risk.32 Markedly, our data are not enough to establish any possible impact of DAA on the CV global risk. However, evaluating the whole lipid profile at baseline and after the end of DAA treatment would be informative. Patients who have one or more classical CV risk factors and are treated with DAA might be monitored for an accurate stratification of CV risk.
Abbreviations- •
ApoA1: apolipoprotein A1.
- •
ApoB: apolipoprotein B.
- •
CHC: chronic hepatitis C.
- •
CI: confidence interval.
- •
CV: cardiovascular.
- •
DAA: direct-acting antivirals.
- •
GT: genotype.
- •
HCV: hepatitis C virus.
- •
HDL: high-density lipoprotein.
- •
HOMA-IR: homeostatic model assessment of insulin resistance.
- •
IFN: interferon.
- •
IR: insulin resistance.
- •
LDL: low-density lipoprotein.
- •
Lp(a): lipoprotein (a).
- •
MS: metabolic syndrome.
- •
OR: Odds Ratio.
- •
RBV: ribavirin.
- •
sd: standard deviation.
- •
SOF: sofosbuvir.
- •
SVR: sustained virological response.
This research did not receive any specific grant from funding agencies in the public, commercial, or not-forprofit sectors.


