


Impact Factors (IF) are widely used surrogates to evaluate single articles, in spite of known shortcomings imposed by cite distribution skewness. We quantify this asymmetry and propose a simple computer-based procedure for evaluating individual articles.
METHOD:(a) Analysis of symmetry. Journals clustered around nine Impact Factor points were selected from the medical “Subject Categories” in Journal Citation Reports 2010. Citable items published in 2008 were retrieved and ranked by granted citations over the Jan/2008 - Jun/2011 period. Frequency distribution of cites, normalized cumulative cites and absolute cites/decile were determined for each journal cluster. (b) Positive Predictive Value. Three arbitrarily established evaluation classes were generated: LOW (1.3≤IF<2.6); MID: (2.6≤IF<3.9); HIGH: (IF≥3.9). Positive Predictive Value for journal clusters within each class range was estimated. (c) Continuously Variable Rating. An alternative evaluation procedure is proposed to allow the rating of individually published articles in comparison to all articles published in the same journal within the same year of publication. The general guiding lines for the construction of a totally dedicated software program are delineated.
RESULTS AND CONCLUSIONS:Skewness followed the Pareto Distribution for (1
It is universally acknowledged in the realm of Scientometrics that Impact Factors (IF) reflect, albeit imperfectly, the importance of scientific journals, but come nowhere near evaluating the individual research articles published therein. The discrepancy stems from a well-known fact: distribution of citations amongst authors is skewed for the vast majority of periodicals.1 At first sight, it might be tempting to suppose that peer review would be an antidote against asymmetry. A reasonable corollary would then follow: the higher and mightier the journal, the more stringently selected the published science, the less skewed the citation distribution might be. In other words, peer review and a high level of rejection might defeat the Pareto principle, also known as the 80/20 rule which states that for most human driven events, 80% of actions come from 20% of agents.2 If peer review and stringent selection were an effective antidote one might expect that articles published in the most prestigious journals would attain a more symmetrical distribution of citations.
To test these ideas, I collected data from 60 journals listed in the ISI Journal Citations Report 2010.3 All journals were retrieved from Subject Categories with a direct interest to Medicine, at nine different Impact Factor points. Medicine was chosen because of the direct interest to a medical journal, but also to ensure a homogeneous collection of journals from the point of view of inherent citation strength. The result of this analysis prompted me to define and launch a new concept of article evaluation which can be made effective through relatively simple arithmetic computer programs.
METHODThree separate procedures were performed.
(a) Analysis of symmetry. Journals classified under medically related “Subject Categories” clustered around nine different Impact Factor points were selected from the 2010 Journal Citation Reports. Figure 1 illustrates the general content of these groupings. The following exclusion criteria were adopted: (i) Review Journals; (ii) Journals with very small numbers of citable items, to reduce the chance of a deviant, extremely well cited individual article deforming the total result; (iii) Journals with very large numbers of citable items, to reduce potential mistakes associated with hand picking. All citable items (original research and review articles) published during the year 2008 were retrieved from the Tables provided under the Cited Reference Search heading of ISI-THOMSON Web of Sciences site posted during the first week of July, 2011.4 An excel table was compiled for each journal to include all the posted data. A “clean” excel spread sheet was derived therefrom as follows: (a) obviously identifiable duplicate citation entries were merged together, (b) doubtful entries (no Article ID, no “View Record”), editorial material and other non-citable items were excluded, (c) misquotes were discarded. This “clean” database for each journal contained all granted citations obtained by each article within the window stretching from Jan/2008 to Jun/2011. An estimate of citations/year was obtained based on the following assumptions:
- 1.
On harvest week, the “oldest” papers were 42 months old (01/01/2008 – dd/mm/yyyy - to 01/07/2011); the “newest” 30 months old (31/12/08 to 01/07/2011); assuming a steady flow of articles through the year, the average article “age” of each article is 36 months.
- 2.
A six months latency between publication and first cites was assumed, as suggested by Eugene Garfield is his classical 2004 lecture.1 Thus the collection had an average citation window of 30 months.
- 3.
The total number of cites/article was therefore divided by 2.5; this was assumed as a cites/year reading for the life of these articles.
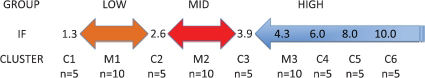
 of nine clusters containing 60 journals. Major clusters M1 and M2 are centrally placed with respect to groups LOW and MID, M3 adequately above the lower limit of group HIGH. Minor clusters C1, C2, C3 mark the limits of groups, whereas C4, C5 and C6 cover higher IF levels. In each cluster, “n” represents the number of included journals.")
Content of and mean Impact Factor (IF) of nine clusters containing 60 journals. Major clusters M1 and M2 are centrally placed with respect to groups LOW and MID, M3 adequately above the lower limit of group HIGH. Minor clusters C1, C2, C3 mark the limits of groups, whereas C4, C5 and C6 cover higher IF levels. In each cluster, “n” represents the number of included journals.
Each excel table was reordered by decreasing number of cites/year. Frequency distribution of cites per article, normalized cumulative cites and absolute cites/decile of distribution were determined for all articles within each Journal cluster.
(b) Determination of Positive Predictive Value. The use of the Impact Factor of a journal as a surrogate for evaluating the citability of articles published therein was evaluated by applying the concept of Positive Predictive Value to the procedure. The Positive Predictive Value of a diagnostic procedure, also known as its Precision Rate2 is given by the following relation

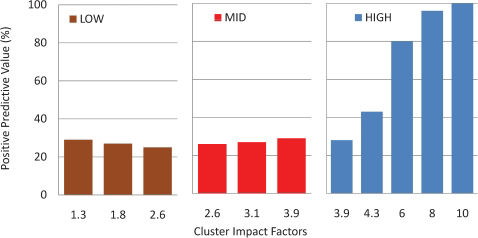
To determine PPV, three arbitrarily established journal classes were generated: a LOW class (IFLOW) comprising journals with an Impact Factor such that 1.3≤IFLOW<2.6; a MID class (IFMID) containing journals satisfying the relation 2.6≤IFMID<3.9; a HIGH class with IFHIGH≥3.9. Positive Predictive Value was determined for journal clusters within each classification class range as follows: an article published in a journal within a given classification class was deemed a True Positive if it was granted N cites/year, N being comprised within the class boundaries; it was deemed a False Positive if this condition was not met. To exemplify, an article published in a HIGH class journal is a true positive if it is granted 3.9 or more cited per year, whereas an article published in a mid class journal is a true positive if it is granted 2.6 or more AND less that 3.9 cites/year. Figure 1 illustrates the class boundaries and the positions of Journal Clusters with respect to class boundaries.
(c) Continuously Variable Rating (CVR). A new system is proposed that allows the rating of individually published articles in comparison to all articles published by the same journal within the same year. Data for calculating this parameter are readily available in the Half-life tables of ISI-THOMSON Journal Citations Report.3 Half-life Tables cover a ten year span.
Table 1 exhibits the data required for the calculation of CVR of an article published in journal “J”:
A modified version of half-life tables from ISI Journal Citations Report.
| Year | N = 0 | N = -1 | N = -2 | … N |
|---|---|---|---|---|
| Cites granted in Year Zero to articles published in Year “N” | ΣGC0 | ΣGC-1 | ΣGC-2 | ΣGCn |
| Number of articles published in Year “N” | ΣAA0 | ΣAA-1 | ΣAA-2 | ΣAAn |
| Cites/Article granted in Year Zero | ΣGC0/ΣAA0 | ΣGC-1/ΣAA-1 | ΣGC-2/ΣAA-2 | ΣGCn/ΣAAn |
If an article “A” was published in Year “n” its CVR for Year Zero is given by the relation:

Where
IFJ0 is the Impact Factor of Journal “J” in the Year Zero;
GCAn is the number of cites granted in year zero to article “A” (published in Year n).
ΣAAn and ΣGCn are defined in Table 2.
Two features of CVR should be noted:
- 1.
Year Zero is mobile, so that CVRA0 can be recalculated on a yearly basis;
- 2.
Year “n” can be any year from zero backwards to “-9”, so that articles published within a ten-year interval, including those published in Year Zero can be evaluated.
The general guiding lines for the construction of a totally dedicated software program may be deducted from the supplied algorithm.
RESULTS(a) Analysis of Symmetry. Table 2 compares the calculated cites/year parameter as described above for the three major journal clusters to their respective mean 2010 Impact Factors: no significant differences occur for any of the three levels. This result validates the use of this procedure to evaluate citations to articles over these first three years of their published life: consequently all data transformed in this manner shall be referred to as cites/year.
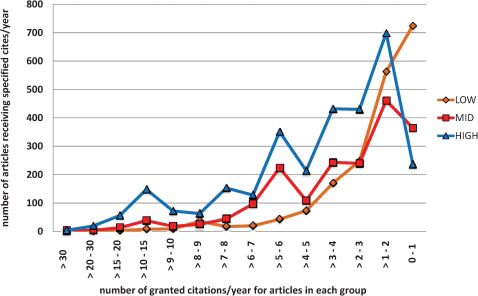
Figure 2 plots frequency distribution of cites/year for three journal clusters (impact factors 1.8, 3.1 and 4.3). As expected, distribution shifts gradually leftward as Impact Factor increases but no symmetry is apparent for any of the clusters.

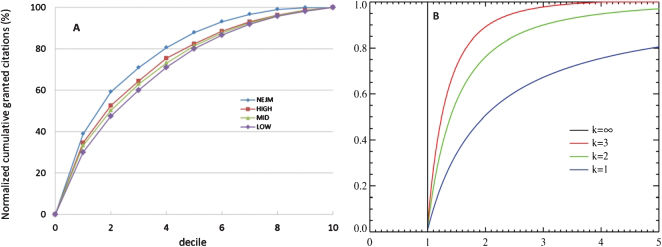
Figure 3A shows normalized cumulative citations for each decile, from one (highest) to ten for each of the three major clusters: the 20% most cited papers collect 50% of cites. In contrast, the bottom 50% are left with no more than 20% of cites. The lower 20% of papers add only 3% to the total. The same applies to smaller samples of higher impact and even to extremely high Impact Factor Journals such as the New England Journal of Medicine, with an Impact Factor of 53.49 in 2010. If anything, the distribution for the New England Journal of Medicine is slightly more skewed than the average. Figure 3B represents theoretical Pareto cumulative distributions for three different values of K.5 Cumulative citations lie between K1 and K2 values.
 Normalized cumulative frequency distribution of granted citations to articles in the three major clusters (HIGH, MID and LOW), and for the New England Journal Medicine (NEJM). The “New England Journal of Medicine” exhibits significantly higher values (p<0.01) for deciles 10 to 50. (B) Pareto cumulative distribution functions for various “k”.")
(A) Normalized cumulative frequency distribution of granted citations to articles in the three major clusters (HIGH, MID and LOW), and for the New England Journal Medicine (NEJM). The “New England Journal of Medicine” exhibits significantly higher values (p<0.01) for deciles 10 to 50. (B) Pareto cumulative distribution functions for various “k”.
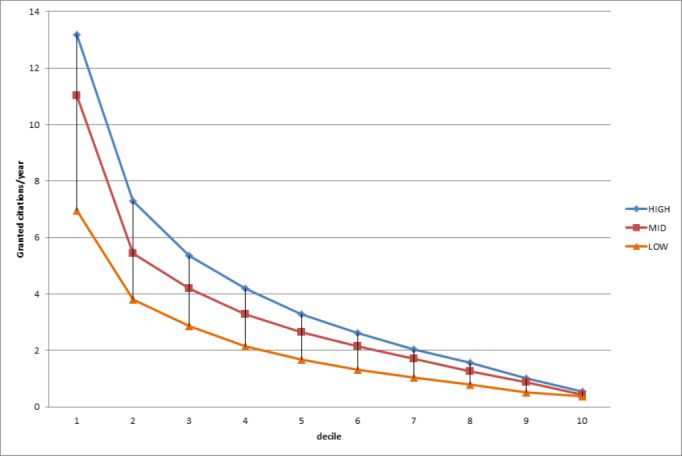
Figure 4 displays distributions of individual articles within the journals in the three major clusters. As expected, citations/year is a strict function of Impact Factor.
. Density is a highly significant (p<0.001) function of Impact Factor.")
(b)Positive Predictive Value (PPV). The use of the Impact Factor of journals as a surrogate measure of the impact Factor was tested for the three arbitrarily selected classification groups.
PPV for the HIGH Impact Factor Class (Fig. 5). For articles published in journals with IF≥3.9, a cutoff value of 3.9 cites/year was used to define PPV: true positives for the HIGH group are all articles with (cites/year≥3.9). Conversely, articles with (cites/year<3.9) are False Positives. When data from the Major Cluster IF = 4.3 are analyzed, True Positives represent 43% of the sample of 3,170 articles, 57% being False Positives. All False Positives are articles upgraded into this class. Thus for this cluster, PPV = 0.43; As might be logically expected, journals in cluster 3.9, have a lower PPV (0.28), while the three high clusters (IF 6.0, 8.0 and 10.0) exhibit progressively increasing PPVs, which tend to 1.00 in the latter group.
 for 8,273 articles published in 60 journals divided into nine Impact Factor clusters (classes LOW, MID, HIGH). Boundary clusters are repeated in each class. An article is deemed a “True Positive” if its cites/year is within its class, as a “False Positive")
Average Positive Predictive Value (PPV) for 8,273 articles published in 60 journals divided into nine Impact Factor clusters (classes LOW, MID, HIGH). Boundary clusters are repeated in each class. An article is deemed a “True Positive” if its cites/year is within its class, as a “False Positive'' if otherwise. PPVs are extremely low (23-27%) in all clusters of the “LOW” and “MID” groups, but rise progressively with IF in the HIGH group.
PPV for the MID Impact Factor Class (Fig. 5). The boundaries of this class are IF 2.6 (lower) and 3.9 (higher). Consequently articles published in Journals within this class exhibiting the adequate number of granted cites/year are True Positives, whereas all others are False Positives. At the mid-point of this class, (Major Cluster IF = 3.1) PPV equals 0.24. False Positives are (a) upgraded with cites/yr <2.6, representing 49% of the collection, (b) downgraded with cites/yr≥3.9, 27% of the articles. Sitting between LOW and HIGH, this group has very different properties from the HIGH group, as shown in Figure 5: moving from the lower to the higher boundary has very little effect on the PPV: at the lower boundary, upgraded False Positives are maximal, while downgraded ones are minimal; at the upper border, the opposite happens.
PPV for the LOW Impact Class (Fig. 5). Any journal within the boundaries Impact Factor 1.3 to 2.6 is a LOW journal. Articles published therein are True Positives with cites/year between 1.3 and 2.6, but False Positives otherwise. At the mid-point of this class (Cluster IF = 1.84) PPV = 0.28. False Positives come in three categories: (a) 39% of overrated articles, with less than 1.3 cites/year; (b) 18% underrated articles which truly belong in the MID class; (c): 15% underrated articles which truly belong in the HIGH class. As occurs with the MID class, and for the same reasons, PPV here is low and fairly constant throughout the class.
Continuously Variable Rating is best explained through an example. Data from the half-life tables published by Journal of Citations Report 2010 were used.3 For any journal, this table contains the total number of citations granted in the current year (2010 in the illustration) to articles published in that same year and in the nine preceding years. Table 3 reproduced and modified from ISI-THOMSON JCR refers to Journal “ISSN XXXX-X322” (Impact Factor2010 = 3.20). To the published data I have added one line for the number of citable items in every year, also obtained from the same source, and one for the corresponding average cites/article for each year.
Data derived from the Half-life table for Shock, 2010 (lines 1 & 2) to which lines 3 and 4 were added using data from the ISI JCR.1
| year | 2010 | 2009 | 2008 | 2007 | 2006 | 2005 | 2004 | 2003 | 2002 | 2001 |
|---|---|---|---|---|---|---|---|---|---|---|
| cites in 2010 | 302 | 588 | 703 | 684 | 675 | 647 | 439 | 373 | 391 | 288 |
| # articles | 184 | 177 | 226 | 199 | 174 | 195 | 170 | 183 | 105 | 164 |
| cites/article | 1.64 | 3.32 | 3.11 | 3.44 | 3.88 | 3.32 | 2.58 | 2.04 | 3.72 | 1.76 |
Three imaginary papers “published” in this journal, as shown in Table 4 were granted 3 citations each in 2010. The three papers can be matched to the corresponding average values in Table 3 (respectively 3.88, 3.11, and 1.64 citations in 2010) and their performance calculated as Observed/Expected ratios. Multiplied by the Journal's Impact Factor these ratios produce a corrected rating for each paper. This would be, per definition, the Continuously Variable Rating for each of these three articles in 2010.
DISCUSSIONThis digression relates to the manner in which scientific production is rated by many educational or grant distributing agencies which use the Impact Factor as a surrogate measure for the citation potential of articles published therein. This policy contradicts common sense and ignores the very well-known Garfield recommendation on the subject:
“The use of journal impact factors instead of actual article citation counts to evaluate individuals is a highly controversial issue. Granting and other policy agencies often wish to bypass the work involved in obtaining actual citation counts for individual articles and authors. … Thus, the impact factor is used to estimate the expected influence of individual papers, which is rather dubious considering the known skewness observed for most journals.”1
Maybe it would not be inappropriate to add here that after examining circa 60 journals (approximately 8,000 articles) with Impact Factors ranging from 1.3 to 55.0 I still have not encountered a single journal which does not very approximately follow a 50/20 distribution: 50% of citations come from the top 20% articles, 20% come from the 50% less cited items. This is obviously reminiscent of the Pareto rule (also known as the 80/20 rule – 80% of actions come from 20% of agents). Figure 3B represents the expanded Pareto distribution, which is a power law probability distribution, comprising a family of curves which are a function of K. Journal citations conform to the Pareto cumulative distribution function for k ∼2.
Generally used justifications for the “surrogate” policy are: (a) the acceptance of a paper for publication by a high impact journal is an implied indicator of prestige and (b) recently published articles may not have had enough time to be cited, so that journal impact factor is the only valid evaluation tool.
There can be no question that acceptance of a paper by a prestigious journal (and prestigious journals do have high impact factors – the two tend to go together) must be taken into consideration in any evaluation process worth its salt. However, it is definitely not synonymous with citations as demonstrated, by applying the concept of positive predictive value to the analysis. It is appropriate to remember that PPV is also known as the precision rate of a test. It is a critical measure of the performance of a diagnostic method, as it measures the probability of a “positive result” be the reflex of the underlying condition being tested.2
The second caveat alleged by supporters of the “surrogate” policy is that recently published papers cannot be properly evaluated. No evidence has ever been produced to support this concept, which has been qualitatively and quantitatively refuted elsewhere.1 I shall return to the point further along.
PPV cannot be calculated for a single journal if defined as the proportion of articles with cites >IF. The result would be absurd because IF is an average and thus represents the central tendency of cites/document/year. Even for a symmetrical distribution, this incongruous PPV might never exceed 0.5. The asymmetrical condition of this particular distribution guarantees that less that 30% of articles in any journal are cited in excess of its IF. This in itself exposes the flawed characteristics of “surrogate” evaluation.
In this study, I calculated PPV within the framework of classification classes. The best PPV is found for a top class (such as the HIGH class in this article), with no upper boundary. Journals above the class cutoff limit will necessarily exhibit progressively higher PPVs. Journals close to the cutoff point for this class will have low PPVs. All False Positives will actually be upgraded articles which do not make the expected cites/year. Thus, if an agency defines only one cutoff point it will create a system whereby publishing in a journal as close as possible to the cutoff is the most advantageous way of making the most of the system. Publishing in such a journal will be presumably easier than publishing further up the scale and maximizes the authors' chances of an upgrade. Publishing in journals with a much higher impact than the cutoff point virtually ensures that the publication will not be a False Positive. However, in the immortal words of the bard, “there needs no ghost, my Lord, come from his grave to tell us that”.
But the really critical problems occur when we look at agencies which define two or more classification classes. All but the highest class will necessarily have lower and upper boundaries, such as the MID and LOW classes of this simulation. PPVs are very low here. False positives mainly comprise upgraded articles, as a consequence of skewness. However, a substantial number of articles published in these journals are downgraded. Thus the surrogate procedure is great for lowly cited, but terrible for highly cited articles. If this sounds bad, it is definitely not all of the bad news. Because of the known tendency of citation granters to favor citing top, rather than not-quite-so-top journals, downgraded articles are suffering a double penalty for their infelicitous choice of a journal.
One might well inquire why such a system was ever put into practice. The answer probably lies in the utter convenience of a procedure that allows the rating of a very large number of articles through a computer-generated software command.
The essential concept behind CVR can be simply stated: how well does a paper published in any given journal perform in comparison to all other papers published in the same journal, within the same time frame?
Such an analysis can be attempted through several of the available metrics, such as Eigen Factor, Scimago Journal Ranking, or through simple citation readings. For the sake of simplicity I have decided to use citations. The described result, to the best of my knowledge, has never been spelt out in this detail, so I termed it CONTINUOUSLY VARIABLE RATING. When this procedure is adopted, as in the example of Table 3 and 4, a number of facts become immediately obvious:
- 1.
Granted Citations in themselves are not a good guide. In the imaginary series of Table 4, the three articles get identical numbers of citations, but the corrected ratings show how differently they performed.
- 2.
Data relating to real papers can be collected from applications submitted to the rating agency; all the examiner program requires is journal identification, and the year of publication.
- 3.
Cites accorded to the paper in the year of evaluation can be retrieved from the appropriate source.
- 4.
The method is simple enough to be handled by a relatively unsophisticated arithmetical program and yields CVRs for each paper submitted to evaluation. The entire system operates within the domain of rational numbers.
- 5.
CVR is dynamic, because it can be recalculated on a yearly basis, subject to the practical limitation mentioned below. An appropriate database can store such information and create a history for each published article.
- 6.
CVR takes into account the IF of the journal where the article is published. Articles with identical observed/expected ratios published in journals with different IF will reflect such differences in their CVRs.
- 7.
Last, but certainly not least, VERY RECENTLY PUBLISHED PAPERS can be accurately evaluated. I believe this will lay to rest the unsubstantiated claims of naysayers.
A final step might be for the agency to match corrected ratings to its standards.
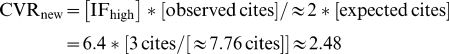
What if Imaginary #1 paper had been published in a journal with an impact factor say 6.4 (twice higher). Further, what if it had harvested the same 3 cites it got where it was published. What would its CVR be? Obviously there is no mathematically exact answer to this question. But because IFs are related to cites, it would not be far-fetched to suppose that the corresponding “expected cites” should also grow by a factor of approximately “2”. Consequently CVRnew of Imaginary #1 paper would be

In other words, duplication would cancel off in the “IF” and in the “expected” terms. Consequently, in this scenario, CVR would be relatively independent of Impact Factor. If this were to be the case (and only a thorough simulation might determine this), CVRs would be way ahead of the “surrogate” procedure in assessing published science.
It may certainly be argued that by being published in a higher IF journal Imaginary #1 would harvest more cites and that consequently its CVR would effectively grow. But here we go into a truly wild speculative world. Because no paper, whether real or imaginary can be ethically published in two different journals, all we can do is live with analogies. The laws of nature mercifully dictate that one cannot run a control experiment on one's own life.
A practical limitation is that half-life data change on a yearly basis, even though the basic pattern remains fairly constant for any journal over the years. A second limitation applies to journals in the Scimago-Scopus collection but not present in the ISI-JCR. Citation rates in the two collections are virtually identical, but data required for the calculation of CVR are not directly available in the SCIMAGO-SCOPUS site.6
In contrast with these limitations, the gains to be reaped in terms of coherence and simplification are enormous. CVR does away with the need of ranking journals, a cumbersome and awkward process. To illustrate this point suffice it to say that CAPES, the Brazilian Federal Agency in charge of rating Brazilian Graduate Courses lists and ranks over 3,000 journals for Medicine.7 Conversely, because different Areas of Evaluation have different inherent citation properties, any journal may be (and often is) rated differently in different Areas.
For CONTINUOUSLY VARIABLE RATING to be adopted a fair amount of groundwork must be performed, either directly by rating agencies, or by commission to the rating institutions. The final result however will be a fair, rational and transparent rating system where the plague of excessive false negatives may be truly minimized.
In summary a new evaluation system is proposed for published original research, CONTINUOUSLY VARIABLE RATING, which takes into account the citation potential of individual articles within the context of the periodical in which it is published and performance vis-à-vis the ensemble of articles published in the same journal. The system can be operated through totally dedicated relatively simple software.
No potential conflict of interest was reported.