


To establish whether alterations of brain structures in Alzheimer's disease are associated with executive dysfunction.
METHODS:Nineteen patients with Alzheimer's disease and 22 older control subjects underwent a comprehensive evaluation. The clock drawing test, digit span test, executive motor function test, Behavioral Assessment of the Dysexecutive Syndrome battery (Rule Shift Cards test), and Stroop test were used to evaluate executive dysfunction. A multiparametric approach using the FreeSurfer image analysis suite provided a description of volumetric and geometric features of the gray matter structures.
RESULTS:The cortical thickness maps showed a negative correlation between the Behavioral Assessment of the Dysexecutive Syndrome battery (Rule Shift Cards test) and the right middle frontal gyrus; a positive correlation between the executive motor function test and the left superior parietal gyrus, left middle temporal gyrus, bilateral supramarginal gyri, right middle frontal gyrus, and right precuneus; a negative correlation between the Stroop test (part III) and the right superior parietal gyrus; and a negative correlation between the Stroop test (part III) and the right middle temporal gyrus.
CONCLUSION:Executive dysfunction in Alzheimer's disease is correlated with alterations not only in the frontal areas but also within many temporal and parietal regions.
Although the prevailing concept of Alzheimer's disease (AD) as an episodic memory disorder is well supported, there are many examples of clinical heterogeneity (1). Several non-amnestic presentations of the pathophysiological process of AD exist, and probable AD is diagnosed even if executive function is the main cognitive deficit (2).
Executive function is a multidimensional cognitive domain that includes attention, sequencing, goal formation, planning, execution of goal-directed plans, effective performance, insight, will, abstraction, and judgment (3). Executive dysfunctions have heterogeneous manifestations, and they occur almost universally in all stages of dementia (4). Furthermore, these dysfunctions are associated with greater risk for the development of AD (5). Executive dysfunction is also associated with greater dementia severity, rapid disease progression, disability, behavioral disorders, and higher mortality (6–9).
Approaches that focus on the localization of executive abilities within the frontal lobe have often been criticized; critics have favored a perspective that emphasizes the connectivity between the frontal regions and the more posterior and subcortical brain areas (3). The prefrontal cortex receives inputs from higher-order association cortical areas such as the posterior parietal lobe, superior temporal lobe, and paralimbic regions (10).
Many studies have explored the neural basis of executive dysfunction in AD. Although most of these studies correlated changes in the frontal structures with executive performance impairment, many others correlated executive dysfunction with posterior cortical areas (11–15).
Automated magnetic resonance imaging (MRI) thickness measures of individual brain regions can identify mild cognitive impairment and AD with great accuracy, specificity, consistency, and reproducibility across multiple independent cohorts. These measures correlate strongly with clinical measures of cognitive decline as well as cellular biomarkers (16–18). Using software tools, a single volumetric T1-weighted MRI scan can be completely processed with little to no manual intervention in a relatively short amount of time. Evidence from the literature suggests that cortical thickness can predict the risk of conversion from mild cognitive impairment to AD with a higher degree of accuracy than clinical and neuropsychological assessments (19,20). Therefore, this automated measure provides a cost-effective and efficient method for the early diagnosis of AD and mild cognitive impairment. Furthermore, these measurements may serve as a quantitative and biologically meaningful endpoint in therapeutic trials.
The questionable description of executive functions as higher-level cognitive functions mediated primarily by the frontal lobes and the lack of a definitive role for specific brain structures in certain executive tasks should be better clarified. Moreover, the lack of a clear correlation between cortical thickness and executive function performance in healthy subjects and the limited number of studies assessing the correlation between the posterior associative cortical thickness and executive functions should be further evaluated.
The aim of this study was to establish whether alterations in gray matter volume and cortical thickness of brain structures are associated with executive dysfunction in patients with mild AD and healthy controls.
METHODSSubjectsNineteen patients with mild AD and 22 older control subjects were recruited from a multidisciplinary memory clinic. The control subjects did not have any cognitive complaints or functional impairment, and all of the participants in the patient group fulfilled the National Institute of Neurological and Communicative Disorders and Stroke and the AD and Related Disorders Association criteria for probable AD (2). Patients had Functional Assessment Staging (21) scores of 3 or 4 and had been receiving a stable dose of a cholinesterase inhibitor for at least 2 months. Controls had Functional Assessment Staging scores of 1 or 2.
Exclusion criteria included significant symptoms of depression (15-item Geriatric Depression Scale score ≥6) (22); significant radiological evidence of ischemic brain disease; a Modified Hachinski Ischemic score >4 (23); a previous cerebrovascular event, a Mini-Mental State Examination score <20 (24) or evidence of other degenerative or secondary dementias; end-stage chronic disease or an unstable medical condition; a psychiatric history; antipsychotic or psychoactive medication adjustments in the 2 months prior to study enrollment; significant visual or hearing impairment; age <60 years; schooling of less than 2 years; and any other condition that could prevent the patient from undergoing an MRI examination or cognitive assessment.
Patients with high levels of depressive symptoms were excluded to avoid bias in the cognitive evaluation because such symptoms strongly influence performance on cognitive assessments (25). Both groups were also paired according to educational level to reduce the effect of this variable on the cortical thickness results. A flow diagram of subject inclusion and exclusion is shown in Figure1.
 assessment. The images of three elderly controls were not included in the study because they were considered to be of low quality. Regarding the patient group, 46 AD patients were invited to participate in the study. Of these patients, 16 missed the clinical assessment or were not included due to their meeting clinical exclusion criteria. Of the 30 remaining subjects, seven were excluded because they missed the neuropsychological assessment. Of the 23 remaining subjects, two missed the MRI assessment. The images of two AD patients were not included in the study because they were considered to be of low quality.")
Flow diagram of the subject selection procedure. For the control group, 66 elderly individuals were invited to participate in the study. Of these individuals, 21 missed the clinical assessment or were not included due to their meeting clinical exclusion criteria. Of the 45 remaining subjects, 17 were excluded because they missed the neuropsychological assessment. Of the 28 remaining subjects, four missed the magnetic resonance imaging (MRI) assessment. The images of three elderly controls were not included in the study because they were considered to be of low quality. Regarding the patient group, 46 AD patients were invited to participate in the study. Of these patients, 16 missed the clinical assessment or were not included due to their meeting clinical exclusion criteria. Of the 30 remaining subjects, seven were excluded because they missed the neuropsychological assessment. Of the 23 remaining subjects, two missed the MRI assessment. The images of two AD patients were not included in the study because they were considered to be of low quality.
Each subject and the caregivers of the patients with AD underwent a complete interview with a consultant geriatrician. The physician collected demographic and medical information, including history of hypertension or diabetes mellitus, body mass index, and waist-to-hip ratio.
A functional status assessment was performed using the Functional Activities Questionnaire (23) and the Disability Assessment for Dementia (only in patients) (27). Neuropsychiatric symptoms were evaluated using the Neuropsychiatric Inventory (28). The comprehensive cognitive evaluation included executive tests, such as the clock drawing test (29), the digit span test, an executive motor function test (30), the Behavioral Assessment of the Dysexecutive Syndrome (BADS) (Rule Shift Cards subtest) (31), and the Stroop test. Each participant also underwent MRI.
To evaluate executive motor function, a modified version of the Neuropsi battery subtest was used (30). Each subject was asked to pay attention to a sequence of three hand positions, which was performed three times by the examiner. The subject was asked to reproduce the sequence in the correct order three times. No verbal cues were given, but the examiner did indicate whether the reproduction was correct or incorrect. To perform this task, the subject had to place his or her dominant hand in three different positions sequentially: a fist resting horizontally, a palm resting vertically, and a palm resting horizontally. If the subject was unable to reproduce the sequence after three attempts, the score was 1. If the subject was able to reproduce the sequence after two attempts, the score was 2. If the subject was able to reproduce the sequence in the first attempt, the score was 3.
MRI data acquisition, analysis, and post-processingMRI of the brain was obtained in all subjects using a 1.5-T scanner [Magnetom Sonata (Maestro Class) Siemens AG, Medical Solutions, Erlangen, Germany] with an eight-channel head coil. To minimize variation, a single investigator positioned all of the subjects using the orbitomeatal line as a landmark. Two conventional sequences were performed to exclude structural lesions: a) axial T2-weighted FLAIR (fluid-attenuated inversion recovery) in a plane parallel to the anterior commissure-posterior commissure (AC-PC) line [TR (repetition time) = 8500 ms, TE (echo time) = 107 ms, IT (inversion time) = 2500 ms, slice thickness = 5.0 mm, slice interval = 1.5 mm, FOV (field of view) = 240 mm, matrix size = 256×256, NEX = 1] and b) sagittal T1-gradient echo volumetric acquisition for multiplanar reconstruction (TR = 2000 ms, TE = 3.42 ms, flip angle = 15 degrees, FOV = 256 mm, 1.0-mm slice thickness with no gaps, total of 160 slices per slab, matrix size = 256×256, NEX = 1).
The quality of the structural MRI data was rated by two experienced neuroimaging researchers according to a three-point rating scale: 0 = no motion artifacts, excellent quality; 1 = a few motion artifacts, fair quality; and 2 = moderate/severe motion artifacts, poor quality. Only datasets with scores of 0 were considered to be of sufficient quality for research purposes. The criteria used to define quality were (a) signal-to-noise ratio; (b) tissue contrast; and (c) artifacts, including c1) motion artifacts (ghosting and smearing), c2) edge artifacts (ghosting, chemical shifts, and ringing), c3) distortions, and c4) aliasing (wrap-around) artifacts. All the MRI exams were performed between 1 (minimum) and 8 (maximum) weeks after the neuropsychological evaluation. The interval was not different between the AD and control subjects.
T1-weighted images were processed using the recon-all pipeline of the FreeSurfer package, which is documented and freely available for download online (32,33). A summary of the options used in the recon-all pipeline and a detailed description of this methodology are included in the supplementary material.
Statistical analysisDemographic, clinical, cognitive, functional, and behavioral data were analyzed with SPSS 18 (SPSS, Chicago, IL, USA). Prior to conducting the analyses, the measurements were tested for normality using the Shapiro-Wilk test.
Demographic, clinical, and neuropsychological data, as well as data on brain structure volumes (Table1, supplementary material), are presented as the mean ± standard deviation. Student's t-tests (at a significance level of p<0.05) were used to compare the data of AD patients and controls.
Demographic, medical, and cognitive data description.
| Variable | Controls (n = 22, 12 females): Mean (SD); range | Alzheimer's disease (n = 19, 10 females): Mean (SD); range | Differences between groups (t; p-value) |
|---|---|---|---|
| Age (years) | 70.14 (5.67); 60–80. | 75.42 (4.81); 66–86. | −3.187; 0.003* |
| Education (years) | 9.14 (5.26); 2–18. | 7.68 (4.42); 3–16. | 0.947; 0.349 |
| Diabetes (%) | 22 | 21 | 0.126; 0.900 |
| Hypertension (%) | 64 | 58 | 0.367; 0.715 |
| Waist-to-hip ratio | 0.94 (0.81); 0.7–1.1. | 0.92 (0.71); 0.8–1.1. | −1.037; 0.306 |
| Body mass index | 27.21 (3.71); 19– 32 | 26.10 (3.62); 21–36. | 0.965; 0.340 |
| Modified Hachinski scale | 0.95 (0.84); 0–3. | 0.68 (0.58); 0–2. | 1.175; 0.247 |
| Duration of cholinesterase inhibitor use (months) | NA | 42.63 (27.35); 4–106. | NA |
| Mini Mental State Examination | 28.82 (0.90); 27–30. | 24.00 (2.62); 20–29. | 8.083; 0.000* |
| Neuropsychiatric Inventory | NA | 20.36 (19.25); 0–77 | NA |
| Stroop test part III (time - seconds) | 48.77 (19.96); 25–103. | 67.63 (28.50); 35–155. | −2.480; 0.018* |
| Stroop test part III (errors) | 1.59 (2.30); 0–9. | 4.95 (4.50); 0–18. | −3.067; 0.004* |
| Digit Span Backwards | 3.86 (1.32); 0–6. | 3.00 (1.29); 0–4. | 2.110; 0.041* |
| Executive motor function test | 2.45 (0.67); 1–3. | 1.26 (1.14); 0–3. | 4.127; 0.000* |
| Behavioral Assessment of Dysexecutive Syndrome: Rule Shift Cards test - rule 2 (time - seconds) | 37.00 (8.25); 25–60. | 41.21 (12.70); 26–76. | −1.275; 0.210 |
| Behavioral Assessment of Dysexecutive Syndrome: Rule Shift Cards test - rule 2 (errors) | 3.32 (3.92); 0–10. | 7.05 (3.45); 0–11. | −3.211; 0.003* |
| Clock drawing test | 7.95 (2.36); 4–10. | 6.11 (2.74); 2–10. | 2.319; 0.026* |
NA: not available; * statistically significant difference.
Volumes [mm3] of different brain structures measured with an automated volumetric method (FreeSurfer).
| Brain structure volume (mm3) | Left hemisphere: mean (SD) | Differences between groups (t; p-value) | Right hemisphere: mean (SD) | Differences between groups (t; p-value) | |
|---|---|---|---|---|---|
| Caudal anterior cingulate | Control | 1685.23 (434.84) | −0.087; 0.931 | 2056.09 (506.72) | 1.513; 0.138 |
| Patient | 1697.74 (483.08) | 1832.26 (428.73) | |||
| Caudal middle frontal | Control | 5849.32 (980.91) | 2.902; 0.006*) | 5346.50 (1132.18) | 2.207; 0.033*) |
| Patient | 4940.79 (1021.33) | 4701.26 (626.98) | |||
| Isthmus cingulate | Control | 2509.59 (484.52) | 2.428; 0.020*) | 2379.59 (377.58) | 2.631; 0.012*) |
| Patient | 2181.74 (358.88) | 2083.11 (337.96) | |||
| Lateral orbitofrontal | Control | 7392.73 (883.47) | 1.797; 0.080 | 7416.23 (855.54) | 0.832; 0.411 |
| Patient | 6934.47 (724.62) | 7192.89 (859.13) | |||
| Medial orbitofrontal | Control | 5382.05 (898.86) | 1.527; 0.135 | 4976.59 (596.86) | 1.472; 0.149 |
| Patient | 4983.89 (747.20) | 4669.37 (739.16) | |||
| Paracentral | Control | 2938.86 (593.83) | 1.941; 0.059 | 3392.91 (579.42) | 1.523; 0.136 |
| Patient | 2609.79 (472.53) | 3139.37 (469.71) | |||
| Pars opercularis | Control | 4435.59 (851.00) | 2.521; 0.016*) | 3542.05 (717.96) | 1.844; 0.073 |
| Patient | 3853.21 (577.81) | 3196.21 (419.41) | |||
| Pars orbitalis | Control | 2007.95 (373.62) | 1.983; 0.054 | 2612.77 (373.91) | 2.893; 0.006*) |
| Patient | 1822.16 (175.96) | 2300.37 (307.44) | |||
| Pars triangularis | Control | 3307.91 (581.73) | 2.088; 0.043*) | 3917.32 (641.66) | 1.701; 0.097 |
| Patient | 2966.84 (441.38) | 3592.79 (568.64) | |||
| Rostral anterior cingulate | Control | 2720.32 (470.85) | 1.432; 0.160 | 2222.45 (465.68) | 1.498; 0.142 |
| Patient | 2513.68 (448.79) | 2042.42 (257.33) | |||
| Rostral middle frontal | Control | 14221.68 (1798.14) | 2.834; 0.007*) | 15501.50 (2029.12) | 2.794; 0.008*) |
| Patient | 12770.32 (1422.34) | 13800.11 (1840.23) | |||
| Superior frontal | Control | 19761.64 (2997.74) | 2.791; 0.008*) | 19168.27 (2624.50) | 3.779; 0.001*) |
| Patient | 17521.11 (1936.71) | 16500.89 (1722.51) | |||
| Frontal pole | Control | 713.41 (181.72) | 3.527; 0.001*) | 952.59 (178.94) | 5.105; 0.000*) |
| Patient | 542.89 (114.51) | 686.16 (151.06) | |||
| Superior temporal | Control | 11017.32 (1678.8) | 1.874; 0.68 | 10467.68 (1396.09) | 1.244; 0.221 |
| Patient | 10161.68 (1146.63) | 9937.89 (1326.80) | |||
| Middle temporal | Control | 9677.50 (1394.84) | 2.031; 049*) | 10797.59 (1296.25) | 4.130; 0.000*) |
| Patient | 8686.00 (1729.73) | 9025.37 (1451.89) | |||
| Inferior temporal | Control | 10044.91 (1718.88) | 1.843; 0.73 | 10144.77 (1779.39) | 1.631; 0.111 |
| Patient | 9104.84 (1515.960 | 9217.16 (1846.91) | |||
| Para- hippocampal | Control | 1984.68 (278.07) | 2.041; 0.48 | 1886.32 (351.04) | 1.441; 0.261 |
| Patient | 1804.53 (285.11) | 1763.37 (335.98) | |||
| Postcentral | Control | 8457.32 (1209.36) | 0.479; 0.634 | 8230.00 (1060.68) | 1.294; 0.203 |
| Patient | 8246.05 (1608.57) | 7789.89 (1115.48) | |||
| Precuneus | Control | 8381.86 (872.34) | 3.710; 0.001*) | 8882.95 (1015.76) | 3.900; 0.000*) |
| Patient | 7256.16 (1070.60) | 7612.00 (1068.80) | |||
| Superior parietal | Control | 11734.91 (1091.82) | 3.382; 0.002*) | 11404.82 (1242.52) | 3.439; 0.001*) |
| Patient | 10278.68 (1644.83) | 9844.47 (1657.50) | |||
| Inferior parietal | Control | 11814.50 (2018.33) | 2.267; 0.029*) | 137299.55 (20629.7) | 2.607; 0.013*) |
| Patient | 10474.37 (1722.94) | 121180.53 (18645.8) | |||
| Supramarginal | Control | 9614.05 (1476.46) | 2.575; 0.014*) | 9000.36 (1232.09) | 2.507; 0.016*) |
| Patient | 8496.47 (1272.31) | 8084.63 (1084.58) | |||
| Fusiform | Control | 9403.27 (1293.04) | 3.404; 0.002*) | 87853.64 (13171.89) | 1.750; 0.088 |
| Patient | 8161.11 (995.04) | 81200.00 (10807.03) | |||
| Intracranial | Control | 1520000.31 (167.94) | 0.354; 0.726 | ||
| Patient | 1501000.57 (170.88) |
* Statistically significant difference.
To evaluate whether there were correlations between executive functions and brain structures, the volumetric measures were first transformed to Z scores using the formula [(value - mean)/SD], and a stepwise backward linear regression was performed. Type I errors in the follow-up multiple comparisons were controlled via Bonferroni adjustment (at a significance level of 0.015). The scores on the executive function tests represented the independent variables used to predict alterations in brain structures.
The stepwise backward linear regression included the variables of both groups (n = 41) and a ‘dummy’ variable (elderly controls vs. AD subjects). All correlations were controlled for age, gender, and intracranial volume.
Ethics statementThis study was approved by the Joint Ethics Committee of the Universidade Federal de São Paulo, and participants (or the guardian or caregiver of the patients with AD) provided written informed consent in accordance with the Declaration of Helsinki.
RESULTSDemographic, clinical, cognitive, functional, and behavioral dataTable1 shows the baseline characteristics of the study population. The mean age of the total sample was 72.5 years (SD 5.8, range 60–86 years). The mean ages of the elderly controls (n = 22, 12 females) and the AD patients (n = 19, 10 females) were 70.14 years (SD 5.67, range 60–80 years) and 75.42 years (SD 4.81, range 66–86 years), respectively. The AD subjects were significantly older than the elderly controls (t −3.187; p = 0.003). The mean educational levels (years) of the elderly controls and AD patients were 9.14 years (SD 5.26, range 2–18 years) and 7.68 years (SD 4.42, range 3–16 years), respectively. No significant differences with respect to educational level were observed between the groups (t = 0.947; p = 0.349).
One patient scored 29 on the MMSE. This subject had been followed over the previous 2 years because of mild executive cognitive impairment. During the follow-up period, a progressive cognitive and functional decline was observed through neuropsychological and clinical evaluations. The patient developed dementia and was therefore included in the study.
The mean scores on the geriatric depression scale for patients and controls were 2 (range 0–5) and 1.3 (range 0–5), respectively. No significant differences with respect to prevalence of depressive symptoms were observed between the groups. The mean score of patients on the Functional Activities Questionnaire was 9.8 (SD 4.7, range 2–22). The control group did not show any functional impairment. The Disability Assessment for Dementia and the Neuropsychiatric Inventory were also administered to patients with AD to complete the functional and behavioral assessment. The mean scores were 87% (SD 11, range 60–100%) and 22 (SD 19, range 0–77), respectively.
Volumetric assessmentCompared with controls, patients with AD exhibited significantly smaller volumes of the bilateral caudal middle frontal gyri, isthmus of cingulate, left pars opercularis, right pars orbitalis, left pars triangularis, rostral middle frontal gyri bilaterally, superior frontal gyri bilaterally, frontal pole bilaterally, middle temporal gyri bilaterally, precuneus bilaterally, superior parietal gyri bilaterally, inferior parietal gyri bilaterally, supramarginal gyri bilaterally, and left fusiform gyrus. A detailed description of the volumetric neuroimaging data of the participants is provided in the supplementary material (Table1, Supplementary Material).
The volume of the right superior parietal gyrus correlated negatively with results on the Stroop test part III (errors) (beta = −0.093, t = −0.359, p = 0.012) and differentiated the AD group from the healthy controls (beta = −0.986, t = −3.071, p = 0.005).
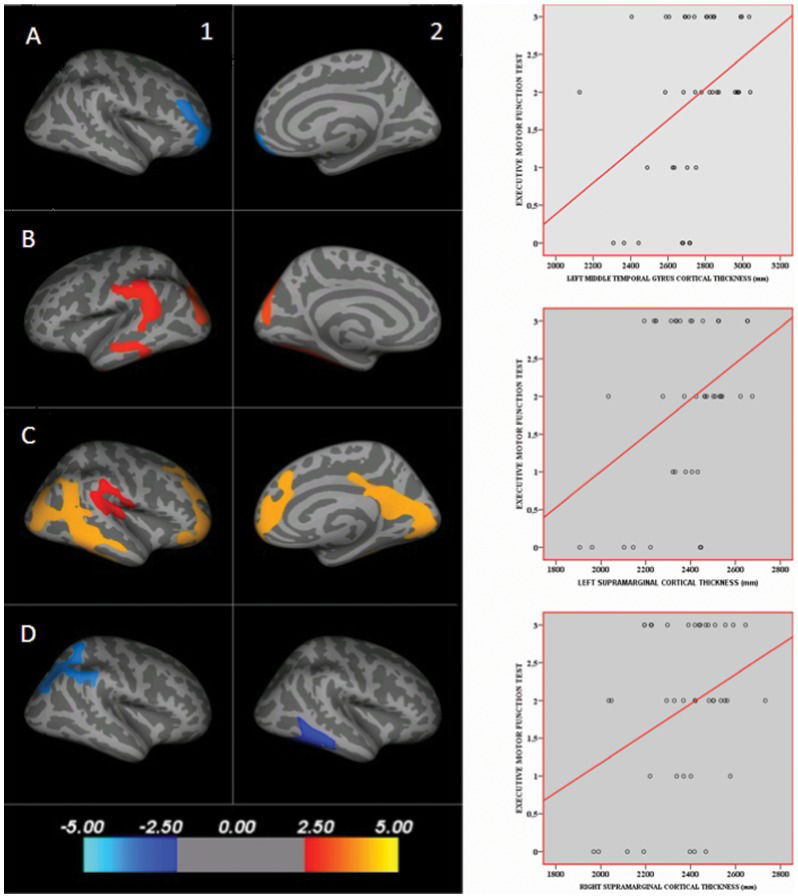
Cortical thickness mapsThe cortical thickness maps of the patients and control subjects showed a negative correlation between the BADS score (Rule Shift Cards test, rule 2, errors) and the thickness of the right rostral middle frontal gyrus; see Figure2, images 1A and 2A. A positive correlation between the executive motor function test and the left superior parietal gyrus, left middle temporal gyrus, bilateral supramarginal gyri, right caudal middle frontal gyrus, and right precuneus thickness was noted (see Figure2, images 1B, 2B, 1C, and 2C). There was a negative correlation between the results of the Stroop test part III (errors) and the right superior parietal gyrus (see Figure2, image 1D). There was a negative correlation between the results of the Stroop test part III (time) and the right middle temporal gyrus (see Figure2, image 2D). Table2 provides the parameters of the lesion extension and the location of the findings shown in Figure2. Scatterplot graphs of the correlations between the executive motor function test scores and the left middle temporal gyrus and bilateral supramarginal gyri cortical thickness are provided (Figure2).
 and the thickness of the right rostral middle frontal gyrus; 1B, 2B, 1C, and 2C illustrate the positive correlation between the executive motor function test and the left superior parietal gyrus, left middle temporal gyrus, bilateral supramarginal gyri, right caudal middle frontal gyrus, and right precuneus thickness; 1D illustrates the negative correlation between the results of the Stroop test part III (errors) and the right superior parietal gyrus; and 2D illustrates the negative correlation between the results of the Stroop test part III (time) and the right middle temporal gyrus. The scale indicates z-scores. Scatterplots of the correlations between the executive motor function test scores and the left middle temporal gyrus and bilateral supramarginal gyri cortical thickness are provided. Table2 provides the parameters of the lesion extension and the location of the findings shown in this figure.")
Cortical thickness maps of associations between brain regions and executive functions. Red, orange, and yellow colors represent positive correlations, and blue represents negative correlations. 1A and 2A illustrate the negative correlation between the BADS score (Rule Shift Cards test, rule 2, errors) and the thickness of the right rostral middle frontal gyrus; 1B, 2B, 1C, and 2C illustrate the positive correlation between the executive motor function test and the left superior parietal gyrus, left middle temporal gyrus, bilateral supramarginal gyri, right caudal middle frontal gyrus, and right precuneus thickness; 1D illustrates the negative correlation between the results of the Stroop test part III (errors) and the right superior parietal gyrus; and 2D illustrates the negative correlation between the results of the Stroop test part III (time) and the right middle temporal gyrus. The scale indicates z-scores. Scatterplots of the correlations between the executive motor function test scores and the left middle temporal gyrus and bilateral supramarginal gyri cortical thickness are provided. Table2 provides the parameters of the lesion extension and the location of the findings shown in this figure.
Correlations between executive function tests and cortical thickness of brain structures: parameters of lesion extension and location of the findings shown in Figure2.
| Executive function tests | Brain structure | Size (mm2) | Talairach coordinates |
|---|---|---|---|
| BADS score (Rule Shift Cards test, rule 2, errors) | Right rostral middle frontal gyrus | 1658.60 | 12.31 107.15–21.49 |
| Executive motor function test | Left superior parietal gyrus | 42.99 | −26.70 −53.4 40.6 |
| Left middle temporal gyrus | 35.31 | −57.8 −58.6 0.2 | |
| Left supramarginal gyrus | 925.10 | 31.82 −11.13 3.09 | |
| Right supramarginal gyrus | 823.56 | 61.6 −39.5 27.0 | |
| Right caudal middle frontal gyrus | 8783.39 | 28.7 18.7 43.6 | |
| Right precuneus | 1616.14 | 27.73 −52.84 −0.06 | |
| Stroop test part III (errors) | Right superior parietal gyrus | 530.65 | 30.6 −45.3 61.5 |
| Stroop test part III (time) | Right middle temporal gyrus | 4467.34 | 39.93 −26.11 −41.86 |
Analysis by group of the cortical thickness maps showed that the main differences between elderly controls and AD patients were in structures of the frontal, parietal, and temporal lobes; the fusiform bilaterally; and a few areas of the occipital lobe. A detailed description of the related brain structures, parameters of lesion extension, and location of cortical thickness differences is provided in the supplementary material (Table2).
Differences in brain structures, lesion extension parameters, and locations of cortical thickness between elderly control subjects and Alzheimer's disease patients.
| Brain structure | Size (mm2) | Talairach Coordinates |
|---|---|---|
| Left hemisphere | ||
| Caudal middle frontal | 65.72 | −38.1 19.9 29.7 |
| Caudal middle frontal | 1626.04 | −32.7 −3.0 44.2 |
| Superior frontal | 1076.06 | −9.6 20.1 59.6 |
| Pars opercularis | 96.65 | −48.4 22.1 18.2 |
| Pars triangularis | 491.21 | −46.9 25.9 5.7 |
| Precentral | 11.08 | −47.7 0.2 8.8 |
| Isthmus cingulate | 232.86 | −15.8 −49.0 0.9 |
| Posterior cingulate | 164.68 | −4.1 −12.1 37.7 |
| Lateral orbitofrontal | 77.61 | −33.6 24.3 −19.0 |
| Precuneus | 794.88 | −4.8 −58.3 13.6 |
| Precuneus | 364.24 | −9.2 −50.6 65.3 |
| Superior parietal | 42.99 | −26.7 −53.4 40.6 |
| Inferior parietal | 499.03 | −36.6 −70.8 45.8 |
| Superior temporal | 941.20 | −47.6 −10.6 −11.5 |
| Superior temporal | 43.42 | −49.5 −12.6 −15.3 |
| Middle temporal | 35.31 | −57.8 −58.6 0.2 |
| Lateral occipital | 58.40 | −34.1 −82.0 8.4 |
| Cuneus | 114.62 | −4.5 −83.2 17.4 |
| Fusiform | 2617.10 | −28.9 −45.6 −19.0 |
| Insula | 13.64 | −30.9 −29.4 15.3 |
| Right hemisphere | ||
| Caudal middle frontal | 8783.39 | 28.7 18.7 43.6 |
| Parsopercularis | 300.05 | 45.7 14.4 21.0 |
| Precentral | 541.95 | 15.3 −26.8 59.1 |
| Medial orbitofrontal | 20.53 | 7.0 19.4 −11.9 |
| Precentral | 494.04 | 45.5 −8.5 37.7 |
| Precentral | 16.44 | 30.5 −14.5 59.2 |
| Superior parietal | 530.65 | 30.6 −45.3 61.5 |
| Superior parietal | 180.71 | 22.7 −85.8 26.2 |
| Superior parietal | 87.87 | 19.4 −72.5 44.2 |
| Inferior parietal | 615.15 | 38.1 −71.7 42.3 |
| Inferior parietal | 203.37 | 43.2 −45.2 35.5 |
| Postcentral | 112.83 | 49.8 −21.5 54.3 |
| Supramarginal | 823.56 | 61.6 −39.5 27.0 |
| Superior temporal | 606.90 | 63.2 −11.7 1.0 |
| Superior temporal | 98.88 | 55.7 −30.0 1.5 |
| Entorhinal | 4813.42 | 23.7 −7.0 −32.7 |
| Lateral occipital | 926.51 | 33.0 −89.5 −3.1 |
| Lateral occipital | 24.98 | 14.4 −91.9 14.7 |
| Lingual | 538.99 | 20.2 −73.9 −7.0 |
| Fusiform | 21.84 | 41.2 −47.3 −18.3 |
Our results showed that executive dysfunctions in mild AD may be correlated with the thinning of the parietal and temporal cortices.
A correlation between the volume and cortical thickness of the right superior parietal gyrus and scores on executive function tests was observed. The volumetric correlation could be used to differentiate AD patients from controls.
The cortical thickness of the left superior parietal gyrus, bilateral supramarginal gyri, right precuneus, and left middle temporal gyrus correlated positively with performance on the executive motor function test. The executive functions assessed by this cognitive test, such as working memory, planning, and praxis, did not correlate with the structures mentioned in previous studies.
The right superior parietal gyrus and the right middle temporal gyrus correlated negatively with the scores of the Stroop test part III, supporting the role of these structures in inhibitory control. Similar results are not found in the literature, although one study correlated response inhibition with the right parietal cortices in bipolar disorder type 1 patients (34).
The anatomical correlations of the Stroop test and the executive motor function test occurred predominantly and with higher intensity in the right hemisphere, confirming previous studies (34,35). These findings highlight the capacity of the practical cognitive tests (mentioned above) to detect executive dysfunction in patients with mild AD.
Many other studies using different neuroimaging methods have correlated parietal and temporal structures with executive functions. Few of these studies used cortical thickness as a variable (11,15). Voxel-based morphometry studies revealed that patients with AD without the epsilon 4 allele of apolipoprotein had poorer executive task performance and greater frontoparietal atrophy (11) and that grey matter reduction of the bilateral insula and left lateral temporal lobe was a predictor of clinical progression of dysexecutive mild cognitive impairment (36). Radionuclide studies have revealed correlations between executive functions and the parietal and temporal regions (12,37). Functional MRI studies have correlated the right frontal regions and the associative parietotemporal areas with executive deficits in patients with AD (13,38).
The relationship between cortical thickness and performance on cognitive tests has not been fully elucidated and warrants further investigation. We found positive correlations between cortical thickness and cognitive test performance, both in controls and patients. However, previous studies have yielded different results that showed an inverse relationship between cortical thickness and performance on executive function tests in control subjects (39,40).
The differential aspects of this study should be mentioned. The selective pathological involvement of some neocortical areas and temporal lobe structures, which is common in AD (41), was also observed in our neuroimaging findings and correlated with executive dysfunction. Previous studies based on analysis of the cortical surface have also shown that AD patients present cortical thinning in the various areas of the frontal, parietal, and temporal lobes (42,43). Cardiovascular risk, an important factor in cognitive decline and executive impairment and a possible confounder in AD studies, was considered in this investigation (44,45).
The populations in developing countries are exposed to various adverse conditions. A combined disadvantage in education, income, wealth, and occupation was associated with poor cognitive function in late life (46). Education has been found to be the most consistent socioeconomic factor associated with cognitive dysfunction (47). Our sample had a mean education level of 8 years, higher than the average years of schooling of the adult Brazilian population, which is estimated at 7.4 years (48). Most of the studies in this field were performed in developed countries with more highly educated individuals than our sample (11,15,18,36). Although our study population had a higher education level than most of the country, our sample is more representative of the local population than those used in other studies, and our results could be used as a reference for future studies evaluating the cortical thickness of AD patients with a low education level.
The results of this study should be interpreted with caution because our study presents a few limitations. The main limitations include the small sample size and the age difference between patients and control subjects. Other possible sources of bias could be 1) the use of age as a covariate and the omission of education level as a covariate in the stepwise backward linear regression; 2) the MRI contraindications; 3) spurious correlations due to the large amount of data used in the neuroimaging analysis; 4) restriction to subjects with a high burden of cerebrovascular disease; and 5) use of the FreeSurfer package template, which is based on MRI scans of young, healthy subjects.
The poor ecological validity of some executive tests and the complex interdependence of the executive functions in other cognitive domains should be mentioned as a potential problem in the assessment of the executive functions of AD patients (3).
Cholinesterase inhibitors have been shown to decrease hippocampal and cortical atrophy (49,50) and improve cognitive performance in AD patients (51). Although the treatment time varied between the patients (4–107 months), the patients had similar clinical staging (Functional Assessment Staging score of 3 or 4). To the best of our knowledge, no studies have assessed the effects of cholinesterase inhibitors on cortical thickness.
In the early phases of AD, before the intense period of neuronal loss, synaptic reorganization changes to compensate for the degenerative effects of brain damage are usually observed (52). The differences between groups observed in this study could also be a result of this process and not only a direct effect of AD neuropathology.
This study has implications for our understanding of how functional deficits in patients are associated with their underlying structural basis. Neuroimaging techniques have demonstrated that executive abilities are not confined to the frontal area of the brain but instead consist of complex interactions among different brain regions (53). Our results are consistent with those of other AD studies, which have suggested that executive function may not depend entirely on the prefrontal cortex but on other posterior cortical areas as well.
The association between modern neuroimaging methods and practical tests, such as the Stroop test and the executive motor function test, could be very useful for identifying executive dysfunction in patients with AD. Future neuroimaging studies addressing the connection between these posterior cortical areas and the relationships between cortical thickness and education level would add to the understanding of the neural basis of AD.
Executive dysfunction in mild AD is associated with abnormalities not only with the frontal areas but also with many temporal and parietal regions. The pathophysiology of executive dysfunction is complex and includes abnormalities in multiple brain regions and, most likely, the connections between them.
ACKNOWLEDGMENTSThis study was supported by the Associação Fundo de Incentivo à Pesquisa (AFIP), Fundação de Amparo à Pesquisa do Estado de São Paulo (FAPESP #2008/11282-9), and Conselho Nacional de Desenvolvimento Científico e Tecnológico (CNPq).
APPENDIXSUPPLEMENTARY MATERIALCortical thickness surface-based analysis: FreeSurfer softwareThe FreeSurfer package is software used for the assessment and visualization of structural and functional brain imaging data. It is fully automated structural imaging software for processing neuroimaging data.
The FreeSurfer package is documented and freely available for download online (https://surfer.nmr.mgh.harvard.edu/fswiki/FreeSurferWiki).
The software employs a method that is reproducible, consistent, and precise.
The main steps of this approach are gray/white matter segmentation, pial and white matter surface modeling, transformation of the cortical surface to spherical coordinates, nonlinear surface registration based on curvature (gyrus and sulcus), analysis of multiple subjects, and automated parcellation of cortical areas. A set of five morphometric parameters per vertex is used as an input to the multimodal classifier: average convexity or concavity, mean radial curvature, metric distortion, cortical thickness, and surface area. The average convexity or concavity is used to quantify the primary folding pattern of a surface. This parameter can capture large-scale geometric features, indicating the depth-height above the template surface of the FreeSurfer and the sulcal depth or gyral height. The mean radial curvature is used to assess folding of the cortical surface. Metric distortion is calculated as the degree of displacement of the cortical surface when registered to the FreeSurfer template.
The FreeSurfer uses as a template the MNI 305 atlas. It is a template based on an average of 305 T1-weighted MRI scans of young, healthy subjects, linearly transformed to Talairach space. All the images assessed in the study were fitted to this template to enable comparison between them.
Cortical thickness and surface area were used to quantify volumetric differences. Significant difference maps were constructed using a general linear model, assuming a significance level of 5%, corrected for multiple comparisons using the false discovery rate.
Summary of the Recon-all of the FreeSurfer software- •
Step 1:
- •
Motion correction
- •
Intensity normalization
- •
Talairach transformation: Transformation from the original volume to the MNI305 atlas
- •
Removal of the skull
- •
Step 2
- •
Topological normalization
- •
Topological correction
- •
Gaussian atlas classification
- •
Subcortical segmentation
- •
White matter segmentation
- •
Surface smoothing
- •
Surface inflation
- •
Cortical parcellation
- •
Step 3
- •
Spherical registration
- •
Cortical spherical parcellation
- •
Parcellation statistics: Summary of cortical parcellation statistics for each structure, including: 1. structure name; 2. number of vertices; 3. total surface area (mm2); 4. total gray matter volume (mm3); 5. average cortical thickness (mm); 6. standard error of cortical thickness (mm); 7. integrated rectified mean curvature; 8. integrated rectified Gaussian curvature; 9. folding index; and 10. intrinsic curvature index.
- •
Jackowski AP, Brucki SM, and Bueno OF designed the study, supervised the data collection, analyzed the data, and reviewed the paper. Vasconcelos LG collected and analyzed the data and wrote the paper. Oliveira MO and Flor YM collected and analyzed the data. Souza AA analyzed the data and wrote part of the results section.
No potential conflict of interest was reported.