


Redistricting is the redrawing of the boundaries of legislative districts for electoral purposes in such a way that the generated districts fulfill federal and state requirements such as contiguity, population equality and compactness. In this paper we solve the problem by means of a single objective and a multiobjective simulated annealing algorithm. These algorithms were applied in two real examples in Mexico. The results show that the performance of the multiobjective approach is better, leading to higher quality zones.
La distritación consiste en modificar los límites de zonas electorales de tal forma que se cumplan los requerimientos federales y estatales tales como conexidad, compacidad y equilibrio poblacional. En este trabajo se utiliza un algoritmo basado en recocido simulado y un algoritmo multiobjetivo basado en recocido simulado para diseñar zonas con dichas características. Ambos algoritmos fueron aplicados a dos estados de México. Los resultados muestran que la técnica multiobjetivo es superior, obteniéndose soluciones de mayor calidad.
The zone design occurs when small geographical units (GU) are aggregated into regions in such a way that an objective function is optimized and some constraints are satisfied. This problem has been applied in different areas such as sales zone design [1]. The design of electoral zones, or redistricting, is one of the most known cases because of its influence in the results of electoral processes and by its computational complexity which has been proved to be NP-Hard [2, 3]. For this problem, there are different principles to control the construction of electoral districts, which promote fair elections. In particular, the criteria of population equality, to ensure the principle “one man one vote”; compactness, to avoid any unfair manipulation of the border or form of electoral zones for political purposes; and contiguity, to prevent the design of fragmented districts, are regarded as essential in any democratic electoral process [4, 5]. In Mexico the last redistricting was done by the Federal Electoral Institute (IFE), for the electoral process in 2006, by means of a single-objective simulated annealing (SA) algorithm with an aggregation function, a weighted sum of the objectives. In this paper, we introduce a multiobjective simulated annealing (MOSA) algorithm to solve the problem of electoral districts design, and the obtained solutions are compared with those of a SA similar to the algorithm used by IFE. The resulting algorithms were applied to the Mexican states of Chiapas and Mexico; the obtained results show that the quality and diversification of Pareto-optimal solutions generated by MOSA algorithm are better than those of SA.
The remainder of this paper is organized as follows. In Section 2 the criteria constituting the objective functions of the model are cast in mathematical terms. In Section 3, a brief overview of the inner working mode of SA is given. Section 4 presents the proposed MOSA algorithm. Two real world problems and the computational results are presented in Section 5. Finally, in Section 6 some conclusions are drawn.
2Objective functionPopulation equality and compactness are important guiding principles that should be promoted in the design of electoral districts. For this reason, the objective function should lead the search towards regular shape districts with approximately the same amount of population. To measure population equality we used the definition given by IFE used in Mexico’s redistricting process in 2006:
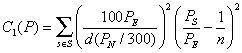
Where P={Z1, Z2,…, Zn} is a districting plan, Zs is the set of GU’s in district s ∈ S, PN is the population of Mexico, PE is the population of the state, Ps is the electoral population of the district s, d is the maximum percentage of deviation allowed for the state, n is the number of electoral districts that must be generated in the state and S={1, 2, 3,…, n}. The total number of electoral districts that must be generated in Mexico is 300. Thus, the lower the cost C1 of a solution, the better the population equality. In fact, the perfect population equality is achieved when all districts have the same number of inhabitants, and in this case the measure assigns a value of zero to C1.
There are several measures to evaluate the compactness of a district, as observed by Young [6] and Niemi [7], but none is perfect. Thus, we decided to use a measure that can be easily computed. After some experimentation we opted for a compactness measure that compares the perimeter of each district to that of a square that has the same area:
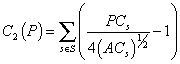
Where PCs is the perimeter of the district s, ACs is the area of the district s. Thus, districts with a good compactness will have a C2 value close to 0.
Finally the objective function is

Where P={Z1, Z2,…, Zn}, is a districting plan, Zs is the set of GU’s in district s ∈S, C1(P) is the equality population cost for plan P, C2(P) is the compactness cost for plan P, α1, α2 are weighting factors that measure the relative importance of equality population and compactness in a districting plan.
Thus, the objective function seeks a districting plan that has the best balance between population equality and compactness. A balance that, obviously, is biased by the weighting factors. In addition, the minimization is subject to constraints that guarantee (i) the contiguity of the built districts, (ii) the number of districts set to n, and (iii) that each GU is assigned to exactly one zone.
3Simulated annealingPopulation simulated annealing is a metaheuristic which has become a popular tool because of its simplicity and good results in different problems and areas of optimization. SA was introduced by Kirkpatrick [8]. The name and inspiration come from the physical process of cooling molten materials down to the solid state. To end up with the best final product, the steel must be cooled slowly to an optimal state of low energy.
By analogy with this process, the SA algorithm starts with an initial solution and generates, in each iteration, a random neighbor solution. If this neighbor improves, the current value of the objective function, i.e., the one that reaches a lower energy state, is accepted as the current solution. If the neighbor solution does not improve the objective value, then it is accepted as the current solution according to a probability ρ based on the Metropolis criterion:
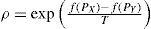
Where, f(PX) is the objective value of the current solution, f(PY) is the objective value of the neighbor solution and T is a control parameter called temperature. These parameters are combined in a cooling schedule that specifies a decrement of the temperature and a finite number of iterations at each value of the temperature.
At large values of the temperature, virtually all proposed solutions are accepted and the algorithm can explore the space of solutions without a premature convergence. However, as the algorithm progresses, the temperature and the chance that an inferior solution replaces the current one gradually decreases, and a local search begins to find a superior solution in the neighborhood of the current solution.
4Simulated annealing based multiobjective algorithmMany simulated annealing based multiobjective optimization algorithms have been proposed by [9], [10], and [11]. In this work we developed a variant of the algorithm proposed by Ulungu et al. in [10]. For this method Ulungu et al. considered that three cases can occur when comparing a solution U with another one V, according to K criteria Ci(U); i=1, 2,…, K. Case a: The move from U to V is improving with respect to all the objectives. Case b: An improvement and deterioration can be simultaneously observed on different criteria. Case c: All the objectives are deteriorated.
In order to maintain intensification and diversity, the authors proposed two strategies (“criterion scalarizing approaches”) for the computation of each solution’s fitness, namely, a classical aggregation function and the Chebyshev’s L1 norm. However, given that the effect of using different scalarizing functions is small because of the stochastic character of the method, we decided to use in this paper the easiest scalarizing function, a weighted sum of the objectives. In this approach the new move is accepted with the probability:
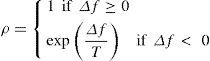
Where Δf can be defined by
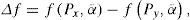
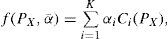
Nevertheless, our implementation with this algorithm had a poor performance in some preliminary experiments; hence, we proposed some modifications by combining the concepts of interacting solutions, the SA algorithm and using a predefined diversified set Λ of normalized weight vectors. We assigned a weight vector αi¯ to each solution in the Pareto set so that each solution used the same weight vector during the whole procedure. If the current solution is replaced by another (dominating) solution, the new one will still be using the same weight vector. When a new solution enters the Pareto set, two cases may be observed:
- •
If the new solution does not dominate and is not dominated by any solution in the Pareto set, the solution is added to the archive and is assigned a weight vector from Λ;
- •
If the new solution dominates one or several solution(s) in the Pareto set, the new solution replaces only one randomly chosen solution among them and inherits the weight vector from the former solution that it replaces.
The basic steps involved in the proposed algorithm for a problem having K objective functions are as follows:
- 1
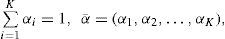
Generate a wide diversified set Λ of normalized weight vectors αi¯=(αi,1,αi,2,⃛,αi,K)
- 2
Start with a randomly generated initial solution,U, evaluate all the objective functions, save the solution into an archive (set of Pareto solutions) and assign it a weight vector αi¯ from Λ.
- 3
Apply a random perturbation and generate a new solution,V, in the neighborhood of the current solution,U, and revaluate all the objective functions.
- 4
Compare the generated solution with all solutions in the Pareto set and update if necessary.
- 5
If the generated solution is archived, make it the current solution and assign it a weight vector αi¯ (either that of the solution it replaces or a new one drawn from Λ).
- 6
Else, the current solution is updated to the generated solution according to the probability described in Equation 5 and using the corresponding weight vector.
- 7
If the generated solution is not accepted, retain the earlier solution as the current solution.
- 8
Reduce the temperature using an annealing schedule.
- 9
Restart with a solution randomly selected from the Pareto set.
- 10
Repeat steps 3-9, until the frozen temperature is reached.
Thus, an execution of this algorithm produces, at least, one nondominated solution for each weighting factor of Λ.
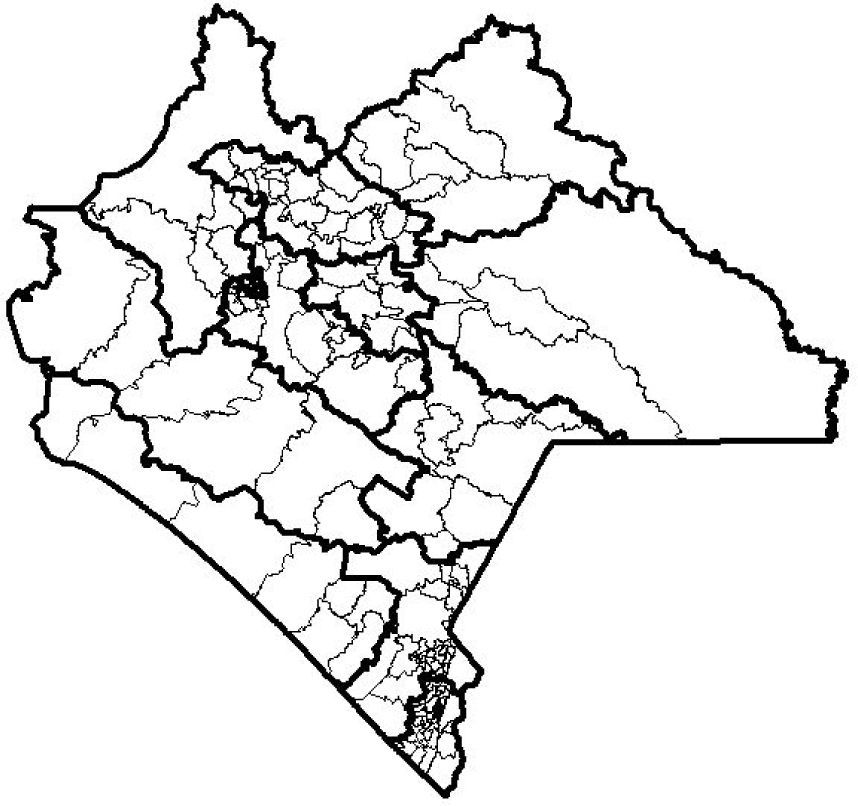
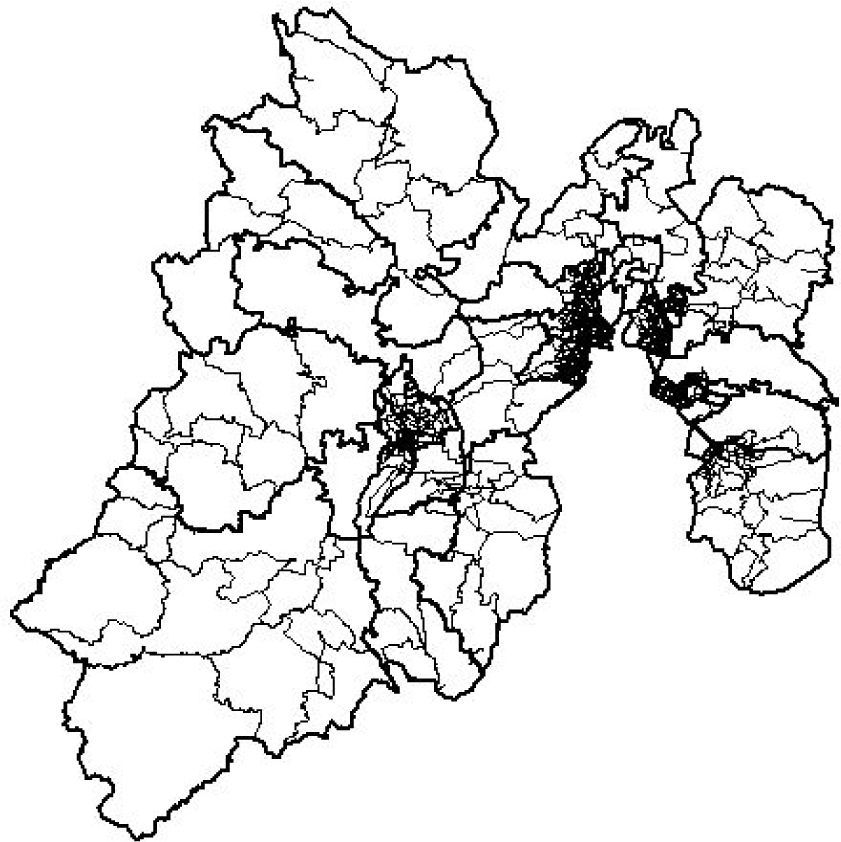
5Computational experimentsThe SA and MOSA algorithms described in the previous sections were tested in the Mexican states of Chiapas and Mexico. Chiapas is a state with 3,920,892 inhabitants and 229 GUs constructed by IFE (see Figure 1), from which 12 districts must be created, whereas the state of Mexico has 13,096,686 inhabitants and 836 GUs (see Figure 2), from which 40 districts must be created. In agreement with the federal requirements stipulated in Mexico’s 2006 elections, a maximum percentage of deviation (in terms of population in each district) d=15% was considered, whereas, according to the national population census carried out in 2000, the total population of Mexico is 97,483,412 inhabitants.


In order to deal with the stochastic effect inherent to heuristic techniques, several independent executions were performed for each algorithm on the abovementioned instances: the number of runs was chosen in such a way that each algorithm provided 100 solutions. These solutions were subsecuently filtered through a Pareto sorting procedure, which identified the final nondominated solutions.
For the SA algorithm, 100 runs were performed (10 for each weighting factor vector), producing each one a single solution. For MOSA, 5 runs were performed producing 20 solutions each one. In all cases, the set Λ of weighting factors was defined as follows: Λ={(0.9, 0.1), (0.8, 0.2),…, (0.1, 0.9), (0.01, 0.99)}. The other working parameters (dynamic cooling schedule with reduction factor α=0.99, initial temperature Ti=5, final temperature Tf=0.001, 1500 iterations for each temperature) were set to equal values for all techniques so that fair comparison basis were guaranteed.
Because of the multiobjective nature of the problem, the numerical results obtained by each algorithm were evaluated in terms of quality of the produced set of nondominated solutions and of the associated approximation of the Pareto front. This quality of the Pareto front commonly includes not only the number of nondominated solutions, but also convergence (the obtained solutions should lay close to the real front) and distribution concepts (the obtained solutions should be evenly distributed over the front width). Therefore, the following criteria were used in this study to evaluate and compare the Pareto sets obtained by the two tackled methods: the number of nondominated solutions in the set, the efficient set spacing (ESS) and the set coverage metric. Obviously, the first criterion should be as high as possible because the aim is to provide the decision-maker with a sufficient number of efficient, non-dominated solutions.
The unary ESS metric measures the dispersion of the solutions over the front width as the variance of distances between adjacent solutions. For a biobjective problem such as ours, the ESS is computed according to the following equation:
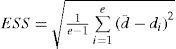
Where e is the number of nondominated solutions in the approximated front PF obtained by an algorithm A, d¯ is the average of all di, and
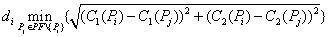
The lower the value of ESS, the better the evaluated approximated front is in terms of distribution of the solutions.
Finally, the front coverage C(A1, A2) is a binary metric that computes the ratio of efficient solutions produced by an algorithm A2 dominated by or equal to at least one efficient solution produced by another competing algorithm A1. Note that, commonly, C(A1, A2) ≠ C(A2, A1) so that both values must be computed. The expression of C(A1, A2) is:
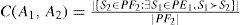
Where PF1 and PF2 are the approximated Pareto sets obtained by algorithms A1 and A2, respectively, and s1 ≻ s2 means that solution s1 dominates solution s2. If C(A1, A2) is equal to 1, then all the efficient solutions produced by A2 are dominated by efficient solutions produced by A1. Note, moreover, that in addition to the abovementioned metrics, a global approximated Pareto set can be defined as the combination of the Pareto sets provided by all the tested algorithms. The proportion in which each algorithm participates to this global set is also used to assess for the performance of each technique.
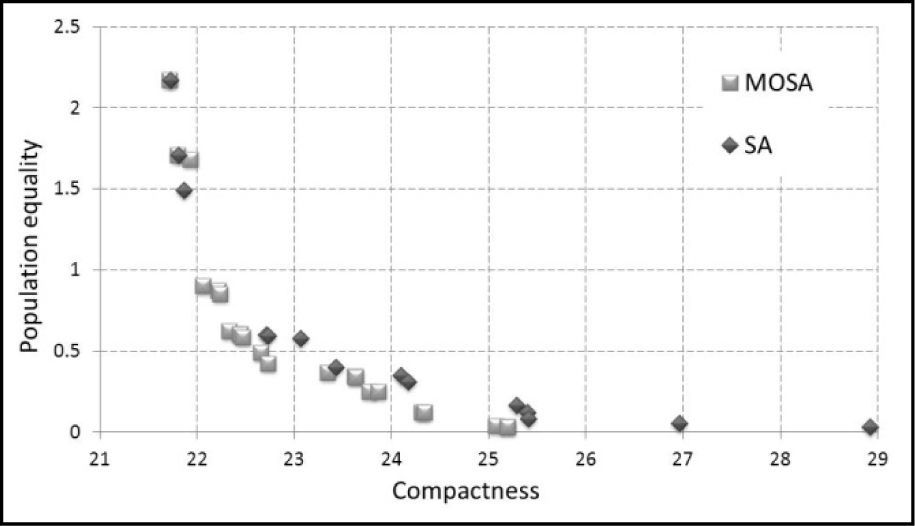
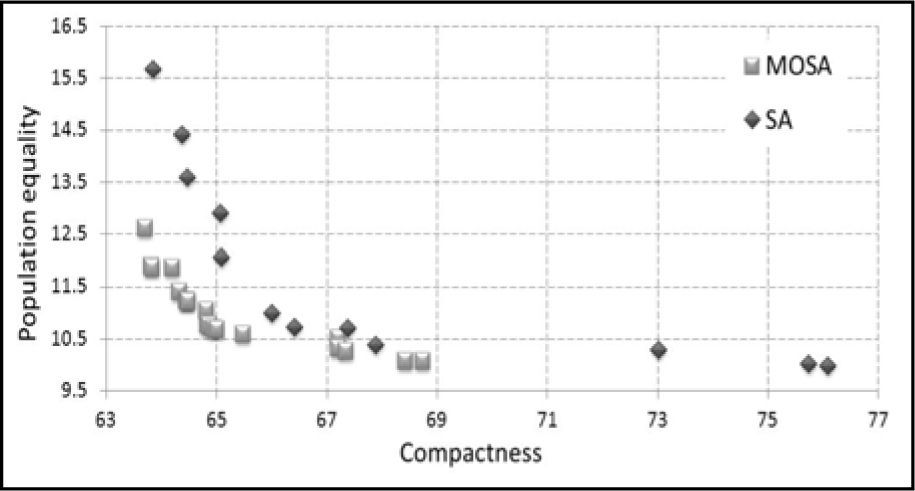
5.1ResultsThe approximated Pareto fronts obtained with SA and the multiobjective version developed in this study for the states of Chiapas and Mexico are illustrated in Figures 3 and 4, respectively; the vertical axe is for population deviation, whereas the horizontal one is for compactness. These fronts were obtained combining the solutions produced by the various executions of each algorithm. It is clear, from the graphical observation of the Pareto sets, that MOSA provided the best results, in terms of convergence (most of the MOSA solutions are “under” the SA ones).


These first trends are confirmed when observing the results for the above-described performance metrics. First, the number of identified nondominated solutions clearly highlights the superiority of MOSA because this latter produces twenty two and nineteen nondominated solutions for Chiapas and Mexico, respectively, whereas the single-objective SA finds fourteen and twelve nondominated solutions in the same order. Then, combining the two fronts obtained for each state, a global approximation of the Pareto front is built. For Chiapas, the global front has twenty two nondominated solutions and is composed of twenty MOSA solutions and four SA solutions (two solutions in the Pareto front were simultaneously found by both algorithms).
For Mexico, the global front has twenty one nondominated solutions and is composed of nineteen MOSA solutions and two SA solutions.
The set coverage metric (presented in %), provides a confirmation of these observations: the Pareto front approximated by SA covers 4.54% and 0% of the Pareto fronts approximated by MOSA for Chiapas and Mexico, respectively. On the other hand, the Pareto front approximated by MOSA covers 71.43% and 83.33% of the Pareto fronts approximated by SA, in the same order. Hence, in terms of convergence to an ideal front (obtained here as the combination of the three approximated fronts), MOSA proves clearly that it obtains better solutions. Regarding the distribution of the solutions over the approximated front width, the obtained ESS are equal to 0.5992 and 0.1096 for SA and MOSA in Chiapas, and 0.6518 and 0.1923 for SA and MOSA in Mexico. The dispersion of the Pareto front achieved by MOSA is thus much better than that of SA.
Therefore, the proposed MOSA algorithm provides the best approximation of the Parteo set, in terms of number of identified solutions as well as in terms of convergence and of distribution of the front. Finally, the computational times used by both algorithms run are the following. For SA, for 100 performed executions, the total computational time is 125minutes for Chiapas and 550minutes for Mexico. For MOSA, for 5 performed executions, the total computational time is 95minutes for Chiapas and 425minutes for Mexico.
6ConclusionsWe presented in this study a novel multiobjective simulated annealing (MOSA) algorithm for the solution of a NP-hard combinatorial biobjective optimization problem: the electoral zone redistricting. This algorithm and a classical simulated annealing procedure were tested on two instances drawn from the Mexican electoral institute database. Their respective performances were evaluated in terms of convergence and dispersion of the resulting approximation of the Pareto front: the computational experiments proved that the proposed MOSA algorithm produces better quality efficient solutions than the classical SA algorithm, with lower running times.