


This study aims to fill the gap in estimating the Green Country Brand Strength Index and its convergence among EU countries and Ukraine (as a potential EU candidate) from 2006 to 2020. Drawing upon data from the World Data Bank, Eurostat, and The Food and Agriculture Organization, the study employs various analytical tools including principal component analysis, the global Malmquist‒Luenberger productivity index, the entropy method, and σ- and β-convergence theories. The findings suggest a notable increase in the green brand values of the analyzed countries from 2006 to 2020, with a significant expansion of the measurement scale. Notably, France, Germany, Spain, the Netherlands, and Sweden emerged as leaders in the Green Country Brand Strength Index by 2020. Furthermore, the study uncovers convergent policies among EU countries aimed at fostering green brands aligned with the Sustainable Development Goals, as evidenced by a decline in σ- and β-convergences. This research provides valuable insights into the dynamics of green branding and policy convergence within the EU and prospective candidate countries. It introduces a distinctive approach to assessing and analyzing green brand strength, emphasizing its critical importance to the formulation of sustainable development policies and strategies.
The intensification of the globalization process, alongside escalating ecological concerns and the commitment to the Sustainable Development Goals 2030 (SDGS 2022;Titko et al., 2023a), highlight the necessity for a transition from resource-based development to sustainable and green development. At the same time, this transition should be within the framework of adaptation to rapid scientific and technical progress, the internationalization of economic cooperation, and the exacerbation of common socio-ecological and economic challenges. The core concept of the European Union (EU) revolves around forming a unified common market that facilitates the free movement of labor, capital, knowledge, goods, services, and people. Bekun et al. (2019) highlighted that EU members have narrowed gaps and inequalities across a broad spectrum of sustainable developmental parameters. This could enhance social cohesion among EU members and ensure a high convergence of development. Concurrently, an analysis of changes in the global market justifies the need for countries to consider new factors and mechanisms to achieve desired targets. The findings corroborate the claim that countries must adopt new factors and mechanisms to realize these targets (Lyulyov et al., 2018; Simao & Lisboa, 2017). Moreover, increased competitiveness in the global market has led to the emergence of new intangible factors influencing a country's development. In studies conducted by the American Marketing Association (2022), Kotler et al. (2002), Mikhnevych et al. (2020), and Lyulyov et al. (2018), a country's brand is analyzed as a core competitive resource that could underpin sustainable development. A country's brand and image have become critical factors in determining its desirability for residence and business operations. Highly qualified human capital is drawn to countries offering happiness, well-being, clean air, and social inclusion. The concept of a brand is multifaceted and challenging to measure empirically. Experts from the American Marketing Association define a brand as symbols, terms, words, designs, and features that distinguish a product from its competitors. Kotler et al. (2002) suggest that a country's brand reflects people's perceptions and beliefs about that country. Mikhnevych et al. (2020) and Lyulyov et al. (2018) demonstrate that a country's brand encompasses national, political, economic, and social aspects of its development.
Simultaneously, the green transformation process (Miskiewicz, 2020) has led to the integration of green factors into investment decisions, migration policies, education, property acquisition, and more. Consequently, a country's green brand becomes a cornerstone in shaping its competitiveness and attractiveness for capital and human resources—both of which are fundamental to its growth. In this scenario, countries must consider ecological factors in their development strategies and establish policies to enhance their green brand.
Despite recognizing a country's brand as a crucial asset for competitiveness and sustainable development, the literature reveals a significant research gap in the comprehensive assessment of a country's green brand. This gap is particularly pronounced in the context of the green transformation process, which necessitates the integration of ecological considerations into various aspects of national development strategies. This paper aims to bridge this gap by estimating countries’ green brands. To achieve this, a given country's green brand will be evaluated based on parameters such as green growth, immigrant numbers, arrivals, green investment, governance efficiency, and the human development index. Furthermore, considering the theory that convergence occurs during decline, the gaps in economic, social, and financial resources and a country's brand depend on the supply of and demand for these resources. Therefore, this paper also seeks to estimate the convergence of the Green Country Brand Strength Index based on σ- and β-convergence theory.
The study focuses on EU countries and Ukraine (a potential EU candidate) from 2005 to 2020 to assess the Green Country Brand Strength Index within a shared regulatory and policy context, particularly concerning sustainability. This timeframe facilitates a comparative analysis of the green branding efforts of current and aspiring EU members, reflecting significant policy developments and global sustainability trends.
The structure of this paper is as follows: literature review—an analysis of the theoretical background in assessing a country's green brand to justify the aim of the investigation; materials and methods—an explanation of the variables and methods used to assess a country's green brand; results—a description of the core findings obtained from the applied methodology to estimate a country's green brand; discussion and conclusions—key results of the investigation, comparative analysis with previous research, limitations, and further directions for the investigation.
Literature reviewApproach to defining a green brandThe analysis of previous studies (American Marketing Association, 2022; Fan, 2010; Fetscherin, 2010; Kohli et al., 2002; Kotler et al., 2002; Lyulyov et al., 2018; Mikhnevych et al., 2020; Miskiewicz, 2020; Us et al., 2022; Wee, 2004) indicates that experts have not universally embraced a standardized approach to defining a green brand. Traditionally, scholars and experts have elucidated brands as encompassing symbols, signs, logos, music, types of endorsers, images, layouts, or the utilization of provocation and humor (American Marketing Association, 2022; Kotler et al., 2002; Lyulyov et al., 2018; Mikhnevych et al., 2020; Miskiewicz, 2020; Us et al., 2022; Wee, 2004). Kohli et al. (2002) characterized a brand as symbols, signs, or words that mold perceptions of objects among stakeholders. Simao and Lisboa (2017) examined a brand as a framework of values, ideas, associations, feelings, and emotions contributing to a company's distinctiveness. Drawing upon the methodologies of the FutureBrand Country Brand Index (2019), a country brand represents the global perception of a country's image. Kaneva and Popescu (2011) delineated a country brand as a reflection of national identity. Expanding on the works of Fan (2010) and Fetscherin (2010)), a country's brand encompasses its historical heritage, culture, economy, social governance, and environmental context. Similarly, Ribeiro (2012) posited that a country brand mirrors the nation's worldview and its standing on the implicit reputation scale.
Ziabina and Dzwigol-Barosz (2022) and Us et al. (2020) have verified that the number of papers in Scopus and Web of Science addressing the green brand at the micro level (company, product, city, etc.) has been on the rise since 2013. Concurrently, inquiries into countries’ green brands gained traction in 2015. Importantly, customer searches on Google concerning green brands, country brands, green images, and country green brands began to surge in 2013 (see Fig. 1).

The visualization of customers' inquiries in Google on green brands, country brands, green images and country green brands using Google Trends
Note: Interest over time is the popularity of a search term relative to the highest point on the graph for a specific region and time. 100 is the peak of the term's popularity. 50 means that the popularity of the term is half as much.
Meanwhile, searches for "country brands" and "country green brands" surfaced in 2020 and 2021 (see Fig. 1). These findings affirm the present relevance of countries’ green brands, which is actively being examined by both society and researchers.
Simao and Lisboa (2017) defined a green brand as the manifestation of a green image resulting from the adoption of eco-friendly technologies which facilitate a reduction in negative environmental impacts. Experts from Green Brands Organization GmbH (2022) characterized a green brand as one that significantly contributes to mitigating climate change and reducing negative environmental impacts. Chen (2010) and Mourad et al. (2012) conceptualized green brands in terms of green image, awareness, trust, consciousness, and satisfaction. Bashir et al. (2020) analyzed green brands as a combination of functional and emotional beliefs, preferences, loyalty, and trust. Lee (2020) demonstrated that a country's green image influences consumers' intentions to purchase products from countries such as Vietnam and Korea. Renko et al. (2017) found that Croatians associate a positive green image with nature and eco-friendly food. Similarly, Chan and Marafa (2014) observed that the city brand of Hong Kong benefits from green resources, parks, and relaxation zones. However, Renko et al. (2017) highlighted Croatia's low green consciousness and business responsibility, negatively impacting the country's image and hindering the promotion of green technologies for sustainable growth. They also emphasized that developing green zones alone is insufficient; relevant green policies are essential to strengthening a country's green brand, as noted by Chan and Marafa (2014). Khan et al. (2020) used structural modeling to demonstrate that expanding renewable resources enhances a country's environmental performance and green image, particularly among green investors. Furthermore, Chan (2000) concluded that a country's green brand is influenced by societal green awareness and behavior, with greenwashing undermining its credibility. Saura et al. (2022) provided insights into the challenges governments face in implementing technology-driven environmental initiatives, emphasizing the importance of addressing privacy concerns to maintain trust and credibility in green branding efforts.
The analysis suggests that a country's brand incorporates governance efficiency (Lyulyov et al., 2018). Furthermore, research by Chygryn and Krasniak (2015) emphasizes the importance of implementing effective communication mechanisms across government, society, and the business sector to achieve sustainable development goals. Additionally, establishing a strong green brand for a country depends on effective policies in healthcare, education, and the preservation of the nation's cultural heritage. Thus, effective public governance is essential for achieving a high level of the country's capital.
Considering the findings of Anholt (2008; 2002), a country's green brand should be analyzed through the prism of perception of the country under the following dimensions: export, capital, human, investment and migration, culture and heritage, tourism, external and internal policy, climate policy, and green growth.
Approaches to the assessment of countries’ green brandsThe complexity of the definition of a country's green brand and the existence of numerous factors that influence it have prompted numerous approaches to estimating countries’ green brands. The core methods by means of which to estimate country brands were developed by experts from the GFK company Nation Brand Index (Anholt, 2008, 2002), the FutureBrand Country Index (2019), and the Good Country Index (2022). Thus, the Nation Brand Index is based on the questionnaire of respondents aged over 18, considering age and gender under the following dimensions: 1) people (the friendliness and hospitality of the population, social progress in the country, education, qualifications of the workforce, etc.); 2) governance (openness and transparency of the country's authorities, efficiency, etc.); 3) voice and accountability, trust in the country's authorities; export (attitude to the export product of the country); 4) tourism (perception of the historical and cultural heritage of the country among tourists); 5) historical and cultural heritage (impact of cinematography, music, visual arts, literature, and sports on the development of world culture); 6) investments and migration (country's attractiveness to foreign direct investment, high-quality labor resources, students’ destination country). These dimensions are grouped in Anholt's Pentagon (Anholt, 2008, 2002). FutureBrand lists 102 countries, twice as many as the Nation Brand Index list. A FutureBrand expert highlighted that the value of a country's brand is orienteer for analyzing a country's position compared with the leader and defining the bottlenecks in the policy of the country's development. The methodology of the FutureBrand Country Index (2019) is based on hierarchical decisions. It allows us to determine the perception of the target audience (residents, investors, governments of other countries, tourists) pertaining to the brand of the analyzed country. The core dimensions are quality of life, values, business climate, heritage and culture, and tourism.
The Good Country Index is also based on the Anholt methodology. The Good Country Index (2022) measures countries under their contribution to the common good of humanity, considering the countries' size. The results of the analysis allow one to identify the core disadvantages of the abovementioned approaches: 1) a lack of transparency – agencies do not show the mechanisms for calculating the indexes; 2) subjectivity – ratings are based on the results of surveys of different target groups); 3) dependence of the country's place in the rating on the number of countries accepted as evaluation objects (only in a few countries are such surveys conducted according to a single methodology); 4) disregarding the economic effectiveness of the country's use of its brand (Good Country Index, 2022).
Fetcherin (2010)) estimated country brand (Country Brand Strength Index, CBSI) based on economic indicators such as exports, tourism, direct foreign investment, immigration, and governance efficiency. All indicators (excluding governance efficiency) were divided by the size of the population. This allows for the elimination of the issue of the country's size. A study by Lahrech et al. (2020) summarized the approaches to measuring a country's brand. Based on the findings, the study allocated the following parameters of the brand: export, tourism, foreign direct investment, immigration, World Government Indicators and the Human Development Index. Lahrech et al. (2020) confirmed that CBSI is the most objective approach, which is an alternative to the subjective assessment of a country's perception by the target audience. Considering the studies of Sapountzaki (2007) and Acosta et al. (2020), each country held five types of capital (natural, financial, human, social, and physical), which formed competitive advantages as the basis of the country's brand. At the same time, the abovementioned approaches suggest a compromise between the development of certain areas of capital and ecology. Thus, the high added value of the financial market allows for compensation for the negative ecological impact (increasing CO2 emissions). However, under the Sustainable Development Goals, green factors (climate changes, CO2 emissions, renewable energy, etc.) should be an integral component of a country's green brand. The vast range of investigations is based on the data collected from surveys (tourists, consumers, investors, and other stakeholders) to evaluate the country's green image (Chan, 2000; Chan & Marafa, 2018; Lee, 2020; Renko et al., 2017). A study by Chan et al. (2018) applied the Green Brand Hexagon (similar to Anholt's Pentagon) to estimate the green brands of Copenhagen and Hong Kong. In addition, the study defined green brands through urban green resources and spaces for leisure activities. The Green Brand Hexagon was developed by Chan and Marafa (2014) and contains six dimensions: green status, green space, green potential, green pulse, green society, and green quality. Studies by Pappu et al. (2007), Barua and Ioanid (2020), Herrero-Crespo et al. (2016), and Zeugner Roth et al. (2008) evaluated a country's brand based on brand equity theory. Barua and Ioanid (2020) highlighted micro- and macrolevel approaches to determining country brand equity. Microlevel approaches are based on the analysis of green products, business, awareness, trust, and consciousness in the country. The macrolevel approach focuses on the assessment of macroeconomic indicators. Furthermore, Barua and Ioanid (2020) used a customer survey to measure country brand equity under the following dimensions: innovation, quality, trust, and prestige. Considering the findings of Barua and Ioanid (2020), country brand equity significantly impacted the companies' reputations and their merger and acquisition processes.
Another group of scientists associated a country's green brand with green growth and estimated it from the macroeconomic point of view based on the methodology of the Green Growth Index (2020), the Sustainable Development Goal Index (Sachs et al., 2022), the Global Sustainable Competitiveness Index (2021), and the Global Green Economy Index (2022). All these indexes partially merge the targets of sustainable development and core dimensions of the country's growth: economic, social, political, governance, and ecological.
Chen et al. (2023) outlined that the Global Malmquist‒Luenberger productivity index allows for the simultaneous consideration of natural, financial, human, social, and physical capitals under the Sustainable Development Goals. In addition, it allows us to estimate the green development of the countries. The Global Malmquist‒Luenberger productivity index assumes that economic growth cannot be analyzed without relevant indicators that reveal their negative impact on the environment. Furthermore, the desired outputs (product production and service, measured by gross domestic product) achieve declining undesirable production outputs (CO2 emissions) simultaneously due to production factors: capital, labor, and energy. It should be noted that, as shown in the studies by Chen et al. (2023) and Chygryn and Krasniak (2015), green investment plays a significant role in a country's green growth and the achievement of sustainable development goals. This indicator and immigration reveal the demand for a country's capital (how real or potential foreign investors and citizens of other countries estimate the country's quality of life and business climate).
It should be noted that the Human Development Index is one of the indicators that shows the efficiency of using the intangible assets in the country under the assessment of its brand (Lahrech et al., 2020). This index characterizes the country's achievements in the framework of three dimensions of human capital: a long and healthy life, knowledge, and a decent standard of living. Furthermore, it considers the supply and demand of a country's social capital.
The analysis presented above highlights two primary methods for evaluating a country's green brand: questionnaires and composite indexes. A significant limitation of questionnaires lies in their subjective nature. This subjectivity can lead to assessments that may not fully capture the nuanced and multifaceted aspects of a country's green brand. Furthermore, earlier methodologies often concentrated on single dimensions such as economic performance, public perception, or environmental policies, without considering how these elements interact within the broader context of a green economy. This isolated approach can result in a skewed or partial understanding of a country's green brand. Additionally, previous research has not consistently aligned with global sustainability initiatives and goals. This lack of direct correlation poses a challenge in accurately assessing a country's green brand in relation to broader global environmental objectives. Moreover, earlier studies did not adequately reflect the evolving dynamics of green branding. Modern green branding increasingly focuses on sustainable development, advanced green technologies, and responsible governance. This evolving nature necessitates an assessment approach that is adaptive and comprehensive, accounting for contemporary trends and priorities in sustainability. In this case, the paper aims to estimate a country's green brand considering the asynchrony of the country's policy on achieving sustainable development goals.
The paper aims to redefine the estimation of a country's green brand by adopting a more inclusive and multi-faceted approach. This approach will not only cover traditional metrics of economic performance, public perception, and environmental policy, but will also integrate key factors that resonate with global sustainability goals.
MethodologyTheoretical background and model specification for the assessment of a country's green brandThe literature review highlights the importance of a multi-dimensional approach to effectively assessing a country's green brand, encompassing sustainable development indicators to measure green growth and commitment to sustainable practices, social and demographic factors such as immigration rates that reflect the country's appeal as a sustainable environment, and tourism metrics indicating global attractiveness and commitment to sustainable tourism. Additionally, the analysis of Green Foreign Direct Investment (GFDI) evaluates the country's eco-friendly economic development efforts, while governance efficiency, measured by World Governance Indicators (WGI), assesses the effectiveness of governance in promoting green initiatives. The Human Development Index (HDI) is also considered, ensuring that economic growth aligns with social and human welfare, highlighting a holistic approach to sustainability that integrates environmental, economic, and social dimensions. Building upon the methodology outlined by Fetcherin (2010)), the assessment of a country's green brand is conceptualized as a function that integrates these components:
where GCBSIi,t – the Green Country Brand Strength Index of country i at time t; GDi,t – the green growth of country i at time t; Immigrationi,t – the number of immigrants that live in country i at time t; Tourismi,t – the number of arrivals in country i at time t; GFDIi,t – green investment in country i at time t; WGIi,t – the efficiency of governance in country i at time t; and HDIi,t – the human development index in country i at time t.
This integrative approach aims to provide a nuanced and comprehensive framework for evaluating a country's position in terms of its green brand. The goal of this methodology is not only to accurately reflect the current state of green branding but also to ensure flexibility in adapting to future sustainability trends and shifts. This methodology aims to offer a detailed and holistic view of a country's green branding efforts, aligning closely with the initial insights garnered from the literature review.
From an economic standpoint, GCBSIi,t incorporates indicators that demonstrate a nation's dedication to eco-friendly economic development. This alignment not only ensures relevance to current environmental goals but also looks ahead, which is vital in the constantly changing world of global sustainability. Socially, it uses the Human Development Index (HDI) to assess social welfare and well-being within the framework of green branding. Environmentally, it zeroes in on green growth, providing a clear measure of a country's sustainable development efforts. Additionally, the CBSI considers governance efficiency, reflecting a country's ability to implement sustainable initiatives effectively. It also evaluates tourism, an important gauge of a country's international appeal and its commitment to sustainable tourism practices. Together, these components paint a comprehensive picture, not just of a country's economic strength but also of its commitment to environmental responsibility, social well-being, and efficient governance. A key advantage of the CBSI lies in its reliance on measurable and objective metrics, ensuring a more precise assessment of a country's green reputation.
The Green Country Brand Strength Index measures its indicators in various ways. Normalizing the data helps eliminate the impact of a country's size, which could otherwise result in inaccurate rankings. In this situation, Formula (1) can be written as follows:
where Maxt is the maximum value of indicators of relevant dimensions of the Green Country Brand Strength Index at time t.
Moreover, employing standardized, globally recognized metrics enables consistent comparisons across countries. This consistency is crucial for different stakeholders, such as investors, policymakers, and international organizations, as it empowers them to make informed decisions using dependable and comparable data.
Estimation method of a country's green brandTo calculate the Green Country Brand Strength Index (GCBSI), principal component analysis with VARIMAX rotation was utilized:
where w1…w6 – weight coefficients of indicators of the Green Country Brand Strength Index, which is estimated by the principal component analysis with VARIMAX rotation (Fetcherin, 2010; OECD, 2008).
Using Principal Component Analysis (PCA) with VARIMAX rotation to compute the Green Country Brand Strength Index (GCBSI) is a suitable approach for several reasons. Firstly, PCA effectively reduces the dataset's complexity, allowing for a focus on the most important brand strength indicators. Secondly, VARIMAX rotation enhances interpretability by ensuring that the resulting components are independent and maximize the variance of the original variables, making it easier to extract meaningful insights. Additionally, it helps address issues related to multicollinearity often found in brand strength indicators. This method provides transparency, consistency, and objectivity, removing subjectivity in variable selection and weighting. Moreover, it ensures computational efficiency and robustness, even when data diverge from traditional statistical assumptions. Collectively, these factors make it a robust and appropriate approach for calculating the GCBSI.
Variables for the assessment of a country's green brandGreen growthGreen growth is a fundamental concept in sustainable development. It reflects a country's ability to achieve economic development while minimizing its negative impact on the environment. In the context of CBSI, it indicates the country's commitment to striking a balance between economic and ecological goals. Furthermore, sustainable economic development, as represented by green growth, is essential for the long-term viability of a country's brand image. A country that focuses solely on short-term economic gains at the expense of the environment may face reputational damage and economic challenges in the future. In contrast, a commitment to green growth enhances a country's brand as a responsible and forward-thinking global citizen. The study calculated the ratio between the Global Malmquist‒Luenberger productivity index (Gedtt+1) (Chen et al., 2023; Du et al., 2018; Guo et al., 2021; Tao et al., 2017; Xia & Xu, 2020) and global Malmquist productivity growth (GMtt+1) to measure the efficiency of a country's green growth (Oh, 2010):
where xt is the set of input and output indicators (capital, labour, and energy), yt is the desired output indicator (product production and service, measured by gross domestic product (GDP)), bt is the undesirable production output (the ratio of carbon dioxide (CO2) emissions to population, excluding agriculture, forestry, and other land use (AFOLU); the ratio of non-CO2 emissions (CH4, N2O) to population, excluding agriculture, forestry, and other land use (AFOLU); and the ratio of non-CO2 emissions (CH4, N2O) agriculture to population), and Dit(xt,yt,bt), Dit+1(xt+1,yt+1,bt+1)Dit(xt,yt)Dit+1(xt+1,yt+1) is the distance function of the decision-making units (DMUs) in t and t + 1.

If the values of Gedtt+1 and GMtt+1 are less than 1, the economic goals are higher priorities than the ecological goals (reducing the eco-destructive impact on the environment) in the country. The type of variable (input, desirable and undesirable outputs) and the descriptive statistics are shown in Table 1.
Variables of the analysis of the efficiency of green economic development.
| Symbol | Meaning | Sources | Mean | Std. dev. |
|---|---|---|---|---|
| Inputs | ||||
| L | Labor force, total | World Data Bank (2022) | 8,772,342 | 1.12×10^7 |
| K | Gross capital formation (current US$) | 1.29×10^11 | 1.89×10^11 | |
| E | Use of renewables for electricity (Gigawatt-hour) | Eurostat (2022) | 28,503.65 | 40,536.91 |
| Desirable output | ||||
| GDP | Gross Domestic Product | World Data Bank (2022) | 33,099.04 | 22,036.23 |
| Undesirable output | ||||
| Em | Integrated index pollution of Natural Capital | Eurostat (2022), the Food and Agriculture Organization (2022), World Data Bank (2022) | 0.834 | 0.119 |
The integrated index pollution of natural capital is used to compare the undesirable outputs of production in countries:
where Em – Integrated index pollution of natural capital; E1m – Ratio of carbon dioxide (CO2) emissions to population, excluding agriculture, forestry, and other land use (AFOLU); E2m – Ratio of non-CO2 emissions (CH4, N2O) to population, excluding agriculture, forestry, and other land use; E3m – Ratio of non-CO2 emissions (CH4, N2O) agriculture to population; and φ1,φ2,φ3 – weight coefficients of indicators of Integrated index pollution of natural capital. The exclusion of Agriculture, Forestry, and Other Land Use (AFOLU) allows for a more specific focus on emissions associated with energy consumption, industrial processes, and other non-land-use-related sources.
The study applied the entropy method to estimate the eco-destructive impact (Gu et al. 2023; Moskalenko et al., 2022). It allows one to consider the etalon of maximum/minimum values of the indicators and eliminating the subjectivism under the estimation. The first stage is the calculation of the weight of j-indicators of і-countries:
where Iij – the weight of j-indicators of the i countries in t time; Hij – the normalized j-indicators of i countries in t time; and m – the analysis period.
At the second stage, the calculation of the entropy of j-indicators is as follows:
where ej is the entropy of j-indicators; n is the number of investigations.
At the third stage, the weight of the i-indicator φj is:
where φj – the weight coefficients of indicators of the integrated index pollution of natural capital.
The empirical results of the weight coefficient for the integrated index pollution of natural capital are shown in Table 2.
The empirical results of the assessment of the efficiency of green economic development are shown in Fig. A1 (Appendix A).
The effectiveness of governanceEffective governance directly impacts a country's reputation and appeal on the global platform. A nation known for robust governance is likely to have a higher CBSI because of enhanced stability, transparency, and reliability. Foreign investors, tourists, and partners prefer to interact with countries exhibiting effective governance, underscoring its significance as a key metric for evaluating a country's brand strength internationally. Similar to the study by Moskalenko et al. (2022), an integrated indicator was employed to evaluate governance efficiency. This indicator encompasses several dimensions, including the voice of society and accountability of government authorities (WGIViA), political stability and the likelihood of unconstitutional political destabilization (WGIPS), efficiency of government management (WGIGE), the rule of law (WGIRL), control of corruption (WGICC), and quality of regulation (WGIRQ). The study applied the entropy methods for integrated assessment considering the weight coefficients (formulas (7)-9):
where WGIi,t – efficiency of governance in country i at time t; τ1…τ6 – weight coefficients of indicators of efficiency of governance; WGIViA – the voice of society and accountability of government authorities; WGIPS – political stability and the probability of unconstitutional political destabilization; WGIGE – efficiency of government management; WGICC – control of corruption; WGIRL – the rule of law; and WGIRQ – quality of regulation.
Following the World Bank methodology, all indicators' values range from –2.5 to 2.5 points. The entropy method eliminates the negative value of the integrated index of governance efficiency during the calculation of weight indicators of their indicators. In this case, the values of WGIi,t will be in the range from 0 to 1. In addition, high values indicate better results. This makes it possible to apply the developed indicator for comparative analysis of countries as the other indicators of green brands (Table 3). The empirical results of the weight coefficient for the efficiency of governance are shown in Table 3.
Variables of the analysis of the efficiency of governance.
| Indicator | WGIViA | WGIPS | WGIGE | WGIRL | WGICC | WGIRQ |
|---|---|---|---|---|---|---|
| Weight | 14.53 % | 6.78 % | 17.60 % | 21.65 % | 23.81 % | 15.63 % |
Note: WGIViA – the voice of society and accountability of government authorities; WGIPS – political stability and the probability of unconstitutional political destabilization; WGIGE – efficiency of government management; WGICC – control of corruption; WGIRL – the rule of law; WGIRQ – quality of regulation.
The number of immigrants is a crucial component of the Country Brand Strength Index (CBSI) due to its broad significance. It indicates a country's allure and standard of living, demonstrating its appeal as a destination for individuals seeking better prospects and security (Titko et al., 2023a). Additionally, a significant influx of immigrants fosters cultural diversity, economic advancement, and innovation, bolstering the country's international reputation as an open and inclusive society. This metric reflects a nation's long-term sustainability, competitive edge, and favorable global perception, underscoring its importance in assessing a country's brand strength and its capacity to thrive in a globalized environment.
Tourism numbersTourism offers a glimpse into a country's global appeal and cultural wealth, showcasing its ability to draw visitors from around the world (Huang et al., 2018; Matzler et al., 2016). High tourist numbers not only reflect a nation's natural beauty, cultural heritage, and hospitality, but also make significant contributions to its economy by generating revenue, creating jobs, and developing infrastructure. Moreover, a thriving tourism sector can enhance a country's soft power, positively shaping its global image and promoting international collaboration. Therefore, tourism numbers serve as a gauge of a nation's attractiveness, economic vitality, and cultural importance, making them a vital factor in evaluating its overall brand strength.
Green foreign direct investmentForeign direct investments, particularly those focused on green initiatives, bring capital, technology, and expertise into the country (Kosova et al., 2023; Kryvda et al., 2022; Pineiro-Chousa et al., 2019). This can lead to job creation, innovation, and increased economic stability, which are key elements of a strong country brand. Furthermore, nations that successfully attract GFDI gain a competitive advantage in the global marketplace. They are seen as forward-thinking and environmentally responsible, which can enhance their overall brand image. Investors are more likely to choose countries with a track record of supporting green investments, boosting their CBSI score. Encouraging GFDI fosters international collaboration in addressing climate change and environmental degradation. It signifies a country's willingness to work with global partners to tackle shared challenges, which can enhance its reputation on the international stage.
Human development indexHDI evaluates vital dimensions such as life expectancy, education, and per capita income, offering a holistic view of a country's overall well-being (De Neve & Sachs, 2020). This multifaceted indicator signifies a nation's commitment to enhancing the quality of life of its citizens, fostering human capital development, and addressing social inequalities. A strong HDI score not only enhances global competitiveness but also underscores a country's long-term resilience and alignment with international development goals, making it an indispensable factor in assessing its brand strength, sustainability, and appeal on the global stage.
Sample and data sources for the assessment of a country's green brandThis study focuses on analyzing both the EU countries and Ukraine, as a potential future member of the EU. Understanding the green brands in these countries is particularly significant for several reasons. Firstly, aligning with the EU's environmental policies, such as the European Green Deal, is crucial for any country aspiring to join the EU. This alignment ensures that potential members meet the stringent environmental standards set by the EU, which are essential for fostering sustainability and environmental protection. Secondly, analyzing the green brands in both the EU countries and Ukraine allows for a comprehensive assessment of environmental efforts and policies across a diverse range of regions. It provides insights into how different countries, including those at different stages of development and integration with the EU, are approaching environmental sustainability and addressing global climate challenges. Moreover, understanding the green brand in Ukraine, as a potential EU candidate, holds strategic importance for both Ukraine and the EU. For Ukraine, aligning with EU environmental standards not only demonstrates commitment to sustainability, but also enhances its prospects for EU membership by meeting the criteria set forth by the EU. For the EU, assessing the green brands in potential member states such as Ukraine is essential for ensuring that future expansions maintain the EU's environmental integrity and commitment to sustainability. It allows the EU to support and guide aspiring members in implementing environmental policies and practices that align with EU standards, thereby contributing to the overall sustainability goals of the EU.
The descriptions and definitions of the indicators of the Green Country Brand Strength Index are shown in Table 4. The missing data were estimated by the linear interpolation method.
The explanation of the indicators of the Green Country Brand Strength Index.
| Symbol | Meaning | Sources | Mean | Std. dev. |
|---|---|---|---|---|
| Immigrationi,t | Number of immigrants, total | Eurostat (2022), The State Statistics Service of Ukraine (2022) | 140,289.5 | 207,051.1 |
| Tourismi,t | Number of arrivals, total | World Data Bank (2022) | 2.84×10^7 | 4.14×10^7 |
| GFDIi,t | Green investment (current US$) | UNCTAD (2022) | 8923.503 | 15,486.36 |
| HDIi,t | Human development index | Global Data Lab (2022) | 0.875 | 0.046 |
As demonstrated in research by Blampied (2021), Gao et al. (2021), and Haller et al. (2021), the concept of convergence can be examined from two perspectives: real and nominal convergences. Convergence represents an approximation of the economy or a group of economies towards equilibrium. This equilibrium may change over time due to variations in exogenous parameters, but it consistently serves as a development attractor for countries (Blampied, 2021; Gao et al., 2021; Haller et al., 2021). Based on the hypothesis of nominal convergence, the growth potential of less affluent countries surpasses that of wealthier ones, leading the former to catch up with the latter (Blampied, 2021; Gao et al., 2021; Haller et al., 2021). The most commonly used method to assess these types of convergence is σ-convergence, which involves the reduction of the dispersion of the i th indicator in the analyzed group of economies, and β-convergence, where countries with lower initial levels of the i th indicator exhibit higher growth rates than successful countries and eventually reach a stable state, achieving the same level. Therefore, σ-convergence can be evaluated using formula (11):
where GCBSIi,t‾is the average value of the country's green brand in year t and n is the number of countries for convergence assessment.
The following formula was applied to estimate the β-convergence:
where β – convergence speed (β > 0 – divergent process; β ≤ 0 – convergent process); Fit – a control variable that determines the long-term equilibrium; C,δ – searching indicators of the model; ɛit – statistical error; and GCBSIi,t−1 – the value of the Green Country Brand Strength Index at time t-1 in country i.
Incorporating the open economy as a control variable is essential for accurately discerning the true convergence or divergence in nations' green branding efforts, ensuring a more comprehensive and precise assessment of each country's genuine commitment to sustainable development (Johnson & Papageorgiou, 2020; Kwilinski et al., 2023). Based on previous studies by Udeagha et al. (2022) and Dalaseng et al. (2022), the open economy, fueled by the globalization process, presents new opportunities for countries worldwide through capital exchange. However, it also increases the risks of adverse impacts on the external environment (Giri & Mohapatra, 2022; Mohsin et al., 2022). A strong brand for a country, provided it remains open, enables the attainment of additional economic, financial, labor, and other competitive advantages. It facilitates the accumulation of resources for the country's growth and the achievement of long-term equilibrium. Considering the findings of Dalaseng et al. (2022), Giri and Mohapatra (2022), Udeagha et al. (2022), and Mohsin et al. (2022), trade openness serves as an indicator of a country's openness. Trade openness data were sourced from the World Bank (2022). Thus, formula (12) can be expressed as follows:
where Openit – country's openness in country i at time t; GCBSI – green country brand; ɛit – statistical error; C,δ – searching indicators of the model; β – convergence speed.Analysis of results
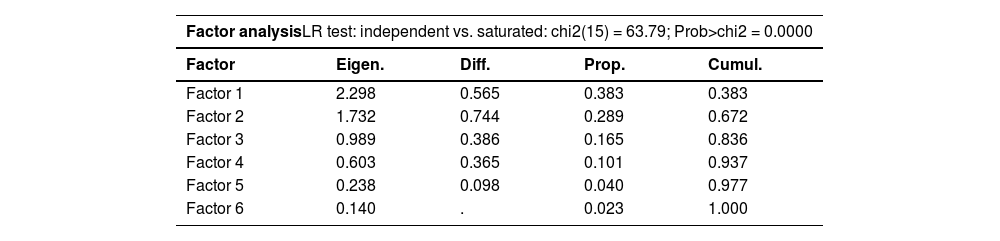
The findings of the principal component (eigenvector) outputs for the Green Country Brand Strength Index for 2006 are shown in Table 5. Considering the empirical results, the two factors explain more than 67 % of the total variance. Factor 1 explains 38 %, and Factor 2 explains 29 %. In addition, the eigenvalue values for both factors are higher than 1. Considering the Kaiser criterion, the results for two factors were sufficient to explain the entire variance of the variables.
The results of principal components (eigenvectors) outputs for the Green Country Brand Strength Index for 2006.
| Factor analysisLR test: independent vs. saturated: chi2(15) = 63.79; Prob>chi2 = 0.0000 | ||||
|---|---|---|---|---|
| Factor | Eigen. | Diff. | Prop. | Cumul. |
| Factor 1 | 2.298 | 0.565 | 0.383 | 0.383 |
| Factor 2 | 1.732 | 0.744 | 0.289 | 0.672 |
| Factor 3 | 0.989 | 0.386 | 0.165 | 0.836 |
| Factor 4 | 0.603 | 0.365 | 0.101 | 0.937 |
| Factor 5 | 0.238 | 0.098 | 0.040 | 0.977 |
| Factor 6 | 0.140 | . | 0.023 | 1.000 |
Note: Eigen. – eigenvalue; Diff. – difference; Prop. – proportion value; Cumul. – cumulative value.
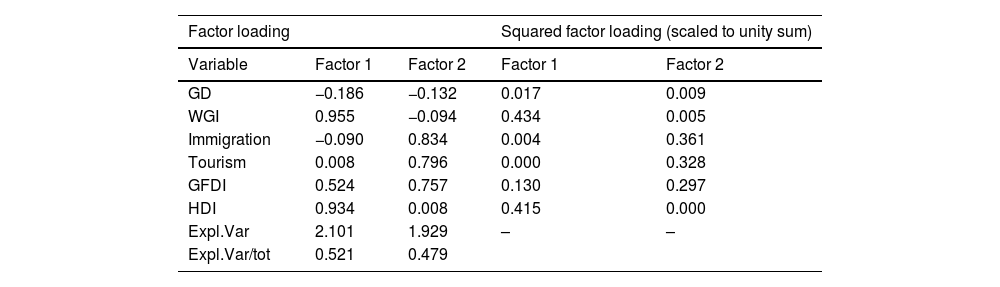
The results in Table 6 allow for the allocation of two factors. Factor 1 includes GD, WGI, and HDI with explained variances of 2.101 and a proportion of variance of 0.521. Factor 2 includes immigration, tourism and GFDI. The empirical results show that for Factor 2, the value of explained variances is 1.929, and the proportion of variance is 0.479.
Factor loadings of the Green Country Brand Strength Index based on principal components (the varimax rotation) for 2006.
| Factor loading | Squared factor loading (scaled to unity sum) | |||
|---|---|---|---|---|
| Variable | Factor 1 | Factor 2 | Factor 1 | Factor 2 |
| GD | −0.186 | −0.132 | 0.017 | 0.009 |
| WGI | 0.955 | −0.094 | 0.434 | 0.005 |
| Immigration | −0.090 | 0.834 | 0.004 | 0.361 |
| Tourism | 0.008 | 0.796 | 0.000 | 0.328 |
| GFDI | 0.524 | 0.757 | 0.130 | 0.297 |
| HDI | 0.934 | 0.008 | 0.415 | 0.000 |
| Expl.Var | 2.101 | 1.929 | – | – |
| Expl.Var/tot | 0.521 | 0.479 | ||
Note: GD – the green growth of the country; Immigration – the number of immigrants that live in the country; Tourism – the number of arrivals; GFDI – green investment; WGI – efficiency of governance; HDI– human development index in the country; Expl. Var/tot – ratio between the explained variance of each factor (Expl. Var) and the total sum thereof.
The findings of the weights for factor loadings (wi) of the Green Country Brand Strength Index are shown in Table 7.
Factor loadings of the Green Country Brand Strength Index based on consideration of the weights of factors for 2006.
| Variable | (А): Squared factor loading (scaled to unity sum) | (B): Weight of respective factor | (C): Resulting weightCi=Ai×Bi | (wi): Resulting weight scaled to sum to 1wi=Ci∑i=1nCi |
|---|---|---|---|---|
| GD | 0.017 | 0.521419 | 0.009 | 0.010 |
| WGI | 0.434 | 0.521419 | 0.226 | 0.245 |
| Immigration | 0.361 | 0.478581 | 0.173 | 0.187 |
| Tourism | 0.328 | 0.478581 | 0.157 | 0.170 |
| GFDI | 0.297 | 0.478581 | 0.142 | 0.154 |
| HDI | 0.415 | 0.521419 | 0.216 | 0.234 |
Note: GD – the green growth of the country; Immigration – the number of immigrants that live in the country; Tourism – the number of arrivals; GFDI – green investment; WGI – efficiency of governance; HDI– human development index in the country.
Steps similar to those in Tables 5-7 were applied to calculate the weights of the factor loadings of the Green Country Brand Strength Index for 2007–2020. The empirical results of weights are shown in Table 8. Considering the findings, quality of governance (WGI) and HDI had the highest weight during the analyzed period. However, the weights of green economic development and green investment increased after 2013 and 2015 (the period for updating the Agenda on Sustainable Development Goals). Thus, in 2020, the weights of green economic development and green investment were 0.191 and 0.177, respectively. However, in 2006, the similar weights were 0.01 (green economic development) and 0.154 (green investment).
The weight of factor loadings of the Green Country Brand Strength Index for 2006–2020.
| Variable | 2006 | 2007 | 2008 | 2009 | 2010 | 2011 | 2012 | 2013 | 2014 | 2015 | 2016 | 2017 | 2018 | 2019 | 2020 |
|---|---|---|---|---|---|---|---|---|---|---|---|---|---|---|---|
| GD | 0.010 | 0.026 | 0.020 | 0.056 | 0.064 | 0.007 | 0.203 | 0.011 | 0.190 | 0.048 | 0.093 | 0.018 | 0.022 | 0.200 | 0.191 |
| WGI | 0.245 | 0.238 | 0.224 | 0.232 | 0.227 | 0.235 | 0.186 | 0.229 | 0.206 | 0.213 | 0.189 | 0.229 | 0.234 | 0.188 | 0.205 |
| Immigration | 0.187 | 0.186 | 0.162 | 0.170 | 0.179 | 0.183 | 0.151 | 0.182 | 0.138 | 0.164 | 0.180 | 0.208 | 0.197 | 0.165 | 0.174 |
| Tourism | 0.170 | 0.169 | 0.171 | 0.170 | 0.148 | 0.162 | 0.126 | 0.146 | 0.121 | 0.137 | 0.141 | 0.136 | 0.156 | 0.122 | 0.054 |
| GFDI | 0.154 | 0.164 | 0.202 | 0.162 | 0.165 | 0.192 | 0.146 | 0.203 | 0.168 | 0.222 | 0.201 | 0.189 | 0.160 | 0.145 | 0.177 |
| HDI | 0.234 | 0.218 | 0.221 | 0.209 | 0.216 | 0.222 | 0.187 | 0.228 | 0.178 | 0.215 | 0.196 | 0.221 | 0.232 | 0.180 | 0.198 |
Note: GD – the green growth of the country; Immigration – the number of immigrants that live in the country; Tourism – the number of arrivals; GFDI – green investment; WGI – efficiency of governance; HDI– human development index in the country.
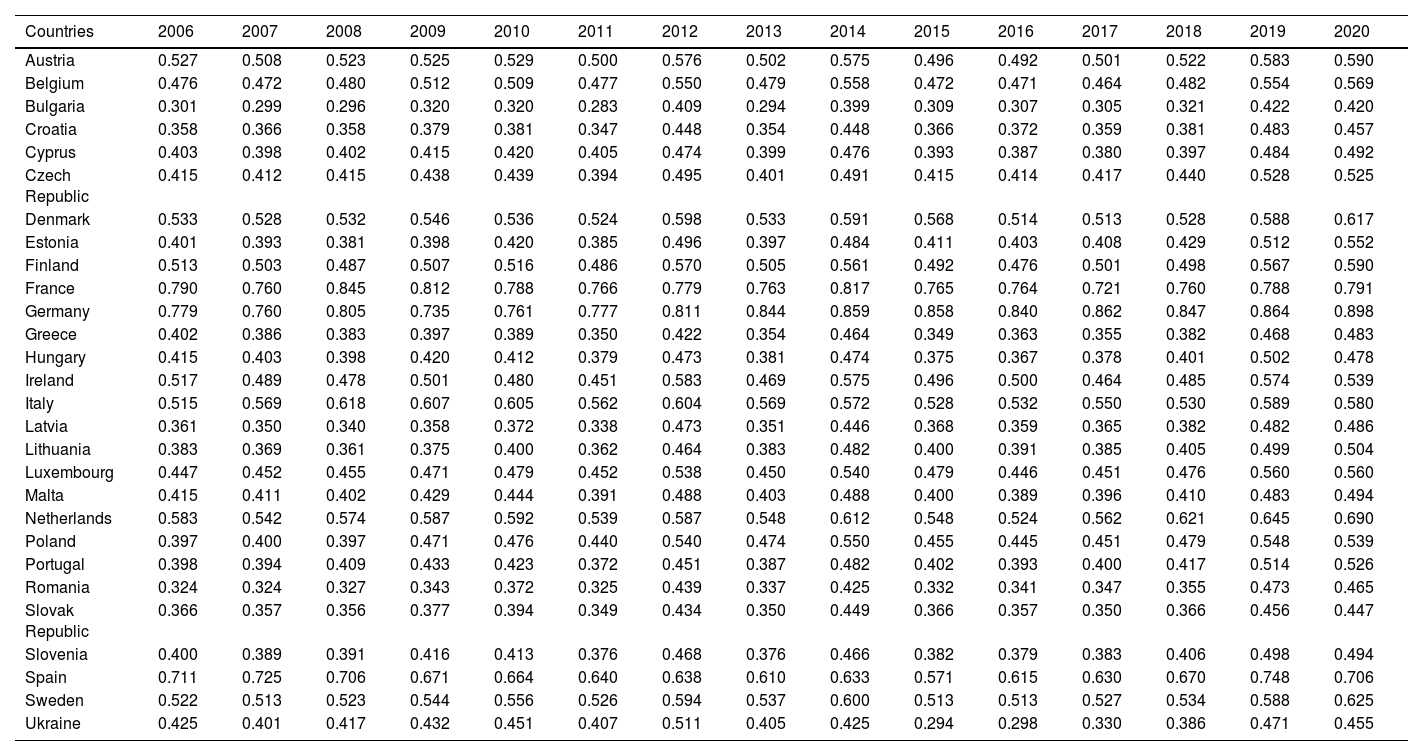
The visualization map of the Green Country Brand Strength Index is shown in Fig. 2 for 2006 and 2020. It should be noted that the maximum value of the Green Country Brand Strength Index in 2020 is higher than that in 2006 (0.9 and 0.79, respectively). A similar tendency was observed for the minimum values. In 2006, the minimum value of the Green Country Brand Strength Index was 0.3, and in 2020, it was 0.42 (Fig. 2). This confirms that the green brands have increased since 2015 among all analyzed countries.
 and 2020 (b).")
The findings show that the list of the top five countries on the Green Country Brand Strength Index did not change in 2020 compared to 2006. Thus, the following countries occupied the first five places in 2006: France, Germany, Spain, the Netherlands, and Denmark. In 2020, Denmark moved to sixth place from fifth in 2006, and Sweden rose to fifth place in 2020 compared to seventh in 2006. It should be noted that by 2020 Poland, Estonia, and Portugal had the highest increases, by eight, seven, and six places, respectively, compared to 2006.
Furthermore, compared to 2006, Ukraine had the largest decline in 2020, by 13 places (from 13th in 2006 to 26th in 2020). However, the values of the Green Country Brand Strength Index did not change cardinally, even slightly increasing from 0.425 in 2006 to 0.455 in 2020. This means that other EU countries have already provided an efficacy policy on green growth and strengthened countries' green brands. In this case, Ukraine should accept a proactive policy based on the EU experience in promoting the country's green brand.
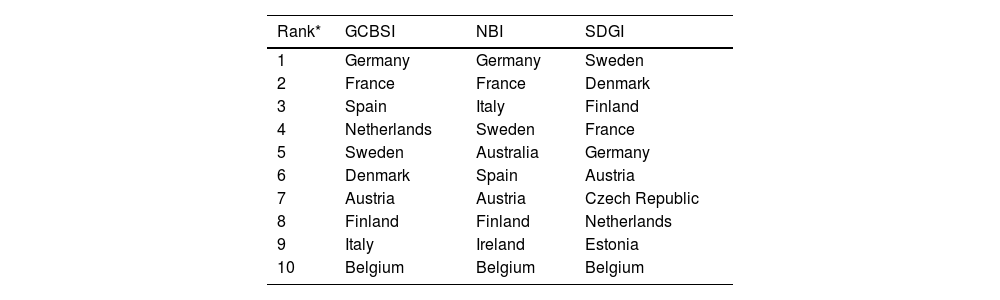
The findings in Table 9 allow us to conclude that the developed rating in the study corresponds to the rankings under Anholt-Ipsos Nation Brands (2020) and SDG Indexes (2020). In general, the rankings contain a similar range of countries. However, the countries occupy different places. Germany is a leader in GCBSI and NBI. However, on the SDG Index, Germany occupied fifth place. In addition, among all selected indexes, Belgium occupied 10th place (Table 9). The empirical results of the comparative analysis allow us to conclude that the developed Green Country Brand Strength Index is relevant and adequate.
Comparison of the ranking of the top 10 countries on the Green Country Brand Strength Index, Anholt-Ipsos Nation Brands Index and SDG Indexes among the analyzed countries for 2020.
| Rank* | GCBSI | NBI | SDGI |
|---|---|---|---|
| 1 | Germany | Germany | Sweden |
| 2 | France | France | Denmark |
| 3 | Spain | Italy | Finland |
| 4 | Netherlands | Sweden | France |
| 5 | Sweden | Australia | Germany |
| 6 | Denmark | Spain | Austria |
| 7 | Austria | Austria | Czech Republic |
| 8 | Finland | Finland | Netherlands |
| 9 | Italy | Ireland | Estonia |
| 10 | Belgium | Belgium | Belgium |
Note: * – ranking of selected countries for analysis; GCBSI – Green Country Brand Strength Index; NBI – Anholt-Ipsos Nation Brands Index; SDG Index – SDG Index.
The values of σ-convergence among EU countries show the tendency for imbalances to decline. The coefficient of σ-convergence decreased from 0.266 in 2006 to 0.195 in 2020 (Fig. 3). This may be due to new members of the EU attempting to catch up with more developed EU countries. At the same time, the pic values confirmed that regional gaps are declining if the EU is analyzed as a whole. However, it does not eliminate the increasing gaps in a number of member states, including those that have recently joined the EU or are only trying to become EU members (Table A1 in Appendix A).

The findings of β-convergence are shown in Table 10. The value of the β-coefficients for formula (13) is negative and statistically significant at the 1 % level. This allows unconditional β-convergence to be confirmed. In addition, considering the explanatory variable Open does not change the direction and statistical significance of the β-coefficients. However, the convergence speed is higher with the explanatory variable Open, and its value is 0.326 (Table 10).
The values of β-convergence.
| Independent variable | Model 1 (OLS) | Model 2 (GLS) | Model 3 (OLS) | Model 4 (GLS) | ||||
|---|---|---|---|---|---|---|---|---|
| Coef. | p value | Coef. | p value | Coef. | p value | Coef. | p value | |
| GCBSIt−1 | −0.182 | 0.000 | −0.315 | 0.000 | −0.187 | 0.000 | −0.326 | 0.000 |
| Opent | – | – | – | – | 0.000 | 0.480 | 0.000 | 0.379 |
| Const | −0.137 | 0.000 | 1.162 | 0.000 | −0.131 | 0.000 | 1.179 | 0.000 |
| R-squared | 0.091 | 0.351 | 0.094 | 0.395 | ||||
Note: GCBSI,t−1 – the value of the Green Country Brand Strength Index at time t-1; Opent – a country's openness at time t; Const – constant; R-squared – coefficient of determination; Coef. – coefficient; Model 1, Model 2 – the values of β-convergence without Open applying OLS and GLS methods, respectively; Model 3, Model 4 – the values of β-convergence with Open applying OLS and GLS methods, respectively; OLS – the findings of the Ordinary Least Squares model; GLS – the findings of the General Least Squares model.
The existence of unconditional β-convergence was justified by the absence of a statistically significant influence of Open with a consistently negative and statistically significant value of β (Model 2 and Model 4). Such conclusions are coherent with those drawn by researchers (Borsi & Metiu, 2015; Mirović et al., 2021), who confirm that such convergence could be only among the homogeneous economies (in particular, the countries of the EU) but not among those lists containing very diverse economies. In this case, the EU policies aim to preserve the environment without reducing economic growth and people-centrism. Therefore, the policy of a country's green brand is approaching the same or at least similar stable states.
DiscussionThe assessment of the Green Country Brand Strength Index from 2005 to 2020 unveiled significant advancements in the realm of green branding among the countries analyzed. Throughout this period, the Green Country Brand Strength Index observed a notable upswing, with its metrics increasing from a minimum of 0.3 and a maximum of 0.79 in 2005, to a more expanded range of 0.42 to 0.9 by the year 2020. This indicates not only an overall growth in the index values but also a widening in the variance among the countries assessed, reflecting a diversification in the efforts and achievements of different nations in the domain of green branding. Among these countries, several leading European Union (EU) nations such as France, Germany, Spain, the Netherlands, and Sweden stood out as pioneers in cultivating strong green brand identities. These countries have been at the forefront of integrating sustainable practices into their national brands, demonstrating leadership in environmental sustainability, innovation in green technologies, and the promotion of sustainable tourism and products. Their high rankings in the Green Country Brand Strength Index can be attributed to concerted efforts in policy-making, investment in green technologies, and public awareness campaigns about sustainability. Despite these positive trends, the case of Ukraine highlights a nuanced challenge in the green branding arena. Although Ukraine maintained a consistent Green Country Brand Strength Index value from 2006 to 2020, it experienced a significant decline in its ranking, falling from 13th to 24th place. This decline in ranking, despite stable index values, suggests that other countries have accelerated their green branding efforts at a faster pace than Ukraine. Said phenomenon indicates that maintaining a static position in the realm of green branding is insufficient in a rapidly evolving global context where environmental sustainability is becoming increasingly central to national identities and international perceptions. This serves as a crucial reminder of the dynamic nature of green branding and the need for continuous improvement and innovation to keep pace with global trends and expectations.
The alignment of the Green Country Brand Strength Index with the Anholt Nation Brands Index (Anholt, 2020) and the SDG Indexes (2020) underlines the growing importance of sustainability and environmental considerations in shaping national brand images and reputations on a global scale. It reflects a broader recognition that the commitment of countries to sustainable development goals and green practices plays a significant role in their international standing and attractiveness as places to live, work, and invest in. This consistency across different indices is particularly significant because it indicates that countries recognized for their strong national brands are also those that are leading in terms of sustainability and the achievement of SDGs. This correlation suggests that sustainable development and environmental stewardship are becoming integral to the concept of nation branding, transcending traditional factors such as economic power or cultural influence.
The analysis of σ-convergence trends in the Green Country Brand Strength Index among EU countries revealed a downward trend, from 0.266 in 2006 to 0.195 in 2020. This trend indicates a decrease in the disparity of green brand strength among EU countries, suggesting that countries are becoming more homogeneous in their green branding efforts over time. The examination of β-convergence supported this finding, with β-coefficients showing a negative and statistically significant trend at the 1 % level across all tested models. These results are in line with previous research by Lyulyov et al. (2018), reinforcing the effectiveness of the EU's unified approach in advancing green brand strategies. This coordinated effort highlights the importance of collective action in moving towards sustainable development goals with greater harmony.
The emphasis on governance efficiency, highlighted by Chygryn and Krasniak (2015), points to the recognition that a strong green brand emerges not from isolated actions but from a comprehensive, systemic approach that includes healthcare, education, and the preservation of cultural heritage. This integrated perspective on green branding, which encompasses policy, governance, and public perception, is crucial for a nation's advancement in the Green Country Brand Strength Index.
ConclusionsTheoretical implicationsThe positive trajectory of the Green Country Brand Strength Index underscores the growing integration of sustainability into the fabric of national brands. This trend challenges traditional branding theories that have predominantly focused on economic, cultural, or political factors, suggesting that environmental sustainability is becoming a core component of national identity and international prestige. The alignment of the Green Country Brand Strength Index with established indices such as the Anholt Nation Brands Index and the SDG Indexes further validates the premise that sustainability efforts are increasingly being recognized and rewarded in the global arena. This indicates a paradigm shift in the concept of nation branding, where sustainable development and green practices are not only auxiliary but central to shaping a country's image and appeal.
The success of countries such as France, Germany, and Sweden highlights the efficacy of cohesive and strategic approaches to green branding, involving policy initiatives, investments in green technology, and public engagement. Conversely, Ukraine's stagnation, despite stable index values, illustrates the competitive and dynamic nature of global green branding. This contrast underscores the necessity for continuous innovation and adaptation in green branding strategies, emphasizing that a static approach may lead to declines in international standing, even if absolute performance remains unchanged.
The analysis of σ-convergence and β-convergence trends among EU countries presents a significant theoretical contribution to the understanding of the evolution of green branding. The findings suggest a harmonizing effect of green branding efforts within the EU, with disparities in green brand strength diminishing over time. This supports the theory that integrated and collective actions, facilitated by regional alliances such as the EU, can lead to a more unified progression towards sustainable development goals. It challenges the notion of green branding as a purely competitive field, proposing instead that collaborative and synergistic approaches can yield substantial benefits for all involved.
Practical implicationsBased on the results of the Green Country Brand Strength Index analysis, several policy implications emerge that are crucial for nations, particularly within the European Union, to enhance their green branding efforts and align with sustainable development goals:
- 1.
Emphasis on Green Economic Development and Investment. The increasing importance of green economic development and green investment in the index highlights the need for governments to prioritize and incentivize sustainable economic practices. Policies that encourage green innovation, renewable energy adoption, and sustainable infrastructure development significantly improve a nation's green brand. Investment in green technologies and businesses should be seen as a strategic priority, with potential benefits for long-term economic growth and environmental sustainability. Besides, it is crucial to invest in digital technologies which simplify the vast range of economic processes and increase loyalty to countries’ brands within the framework of transparency and trust (Kwilinski et al., 2023a; 2023b; Skvarciany & Jurevičienë, 2021)
- 2.
Strengthening Governance and Human Development. The analysis underscores the significance of governance quality and human development in shaping a country's green brand. Policymakers should focus on enhancing transparency, efficiency, and accountability in governance, along with investing in education (Polcyn et al., 2023), healthcare (Us & Gerulaitiene, 2023), and social welfare. Strong governance coupled with high human development indices can create a conducive environment for sustainable practices and elevate the perception of a nation's global green brand.
- 3.
Targeted Strategies for Countries Lagging Behind. For countries such as Ukraine, which showed a decline in their green brand ranking, targeted strategies are essential. These may include adopting best practices from leading countries, investing in sectors with high green potential, and creating a regulatory environment that promotes sustainability. Learning from the experiences of countries that have successfully enhanced their green brand can provide valuable insights for policy formulation.
- 4.
Harmonizing Policies with Global Sustainability Goals. The alignment of national policies with global sustainability goals, particularly the Agenda on Sustainable Development Goals, is crucial. Policies should not only focus on domestic priorities but also consider global environmental challenges. This approach will not only improve a country's green brand but also contribute to global efforts in combating climate change and promoting sustainable development. Aligning national policies with global sustainability goals, such as the Agenda on Sustainable Development Goals, is imperative for nations striving to enhance their green brands and address broader environmental challenges. By synchronizing domestic policies with international sustainability frameworks, countries can ensure that their national strategies not only serve local interests but also contribute to the global agenda of mitigating climate change and fostering sustainable development. This holistic approach transcends borders, acknowledging that environmental issues are global in nature and require concerted international efforts. Furthermore, integrating global sustainability goals into national policies enables countries to tap into international resources, expertise, and networks, facilitating the adoption of innovative solutions and technologies. Saura et al. (2023a) delve into the concept of open innovation and its relevance in the context of green branding for countries. It also positions countries favorably in the international community, attracting foreign investment, partnerships, and collaborations aimed at sustainability projects. By showcasing their commitment to global sustainability standards, nations can enhance their green brands, gaining recognition as responsible and proactive global citizens. Moreover, this alignment encourages the exchange of best practices and success stories, creating a rich tapestry of knowledge and experience that can inspire and guide policy formulation and implementation. It fosters a sense of shared responsibility and collective action, which is vital to addressing the multifaceted challenges of climate change, resource depletion, and environmental degradation. In essence, by ensuring that national policies resonate with global sustainability goals, countries not only elevate their green brands but also play an active role in shaping a sustainable future. This commitment to both local and global objectives exemplifies a forward-thinking approach, which is crucial for driving meaningful change and achieving long-term sustainability for the planet.
- 5.
Encouraging Regional Cooperation and Knowledge Sharing. The observed trends of σ-convergence and β-convergence within the EU underscore the pivotal role of regional cooperation and knowledge sharing in bolstering green branding initiatives. By actively engaging in collaborative projects, nations within the EU can leverage their collective expertise, resources, and experiences to drive sustainable practices and enhance the overall green brand strength of the region. Sharing best practices not only fosters innovation but also ensures that successful strategies are replicated and adapted across different national contexts, leading to a more efficient and impactful implementation of green initiatives (Saura et al., 2023b). Furthermore, the development of regional policies that prioritize sustainability is crucial in cementing a unified approach towards green branding. Such policies establish common standards, provide a framework for joint action, and create mechanisms for accountability and progress monitoring (Nyenno et al., 2023; Titko et al., 2023b). By aligning their sustainability efforts, EU countries presents a united front in the global arena, demonstrating their commitment to environmental stewardship and sustainable development. Moreover, fostering a culture of cooperation and collective action catalyzes a broader paradigm shift, where green branding is not just an individual country's pursuit but a regional imperative. This significantly amplifies the impact of green branding efforts, making the EU a formidable leader in advocating for and actualizing sustainable practices on the global stage. In this way, the σ-convergence and β-convergence trends observed within the EU not only highlight the current state of green branding but also pave the way for a more integrated, cooperative, and impactful approach to sustainability in the future.
6.3. Limitations and Future Research
Despite the up-to-date and adequate findings, this research has a few limitations. Thus, a brand is a complex definition and, based on classical theory (American Marketing Association, 2022; Kotler & Gertner, 2002), should consider the awareness and loyalty of customers to the brand. In this case, in further investigations, it is necessary to consider the awareness and loyalty of a country's targeted audience (investors, labor resources, residents, tourists, etc.) under the assessment of the country's green brand. Furthermore, it is necessary to identify the core dimensions affecting a country's green brand to allocate the relevant incentives and mechanisms to strengthen it. At the same time, σ- and β-convergence do not allow one to determine the convergence in individual economies, but only assess this phenomenon within the EU countries as a whole. This justified the necessity of developing an approach for assessing internal convergence among countries’ development policies.
Research fundingThe research was funded by a grant from the Ministry of Education and Science of Ukraine, 0121U100468, "Green investing: cointegration model of transmission ESG effects in the chain "green brand of Ukraine - social responsibility of business."
CRediT authorship contribution statementOleksii Lyulyov: Writing – review & editing, Writing – original draft, Visualization, Methodology, Investigation, Formal analysis, Data curation, Conceptualization. Tetyana Pimonenko: Writing – review & editing, Writing – original draft, Visualization, Methodology, Investigation, Formal analysis, Data curation, Conceptualization. Yang Chen: Writing – review & editing, Writing – original draft, Investigation, Formal analysis, Data curation, Conceptualization. Aleksy Kwilinski: Writing – review & editing, Writing – original draft, Visualization, Investigation, Formal analysis, Data curation, Conceptualization. Us Yana: Writing – review & editing, Writing – original draft, Visualization, Resources, Methodology, Investigation, Formal analysis, Data curation, Conceptualization.

The values of the Green Country Brand Strength Index for 2006–2020.
| Countries | 2006 | 2007 | 2008 | 2009 | 2010 | 2011 | 2012 | 2013 | 2014 | 2015 | 2016 | 2017 | 2018 | 2019 | 2020 |
|---|---|---|---|---|---|---|---|---|---|---|---|---|---|---|---|
| Austria | 0.527 | 0.508 | 0.523 | 0.525 | 0.529 | 0.500 | 0.576 | 0.502 | 0.575 | 0.496 | 0.492 | 0.501 | 0.522 | 0.583 | 0.590 |
| Belgium | 0.476 | 0.472 | 0.480 | 0.512 | 0.509 | 0.477 | 0.550 | 0.479 | 0.558 | 0.472 | 0.471 | 0.464 | 0.482 | 0.554 | 0.569 |
| Bulgaria | 0.301 | 0.299 | 0.296 | 0.320 | 0.320 | 0.283 | 0.409 | 0.294 | 0.399 | 0.309 | 0.307 | 0.305 | 0.321 | 0.422 | 0.420 |
| Croatia | 0.358 | 0.366 | 0.358 | 0.379 | 0.381 | 0.347 | 0.448 | 0.354 | 0.448 | 0.366 | 0.372 | 0.359 | 0.381 | 0.483 | 0.457 |
| Cyprus | 0.403 | 0.398 | 0.402 | 0.415 | 0.420 | 0.405 | 0.474 | 0.399 | 0.476 | 0.393 | 0.387 | 0.380 | 0.397 | 0.484 | 0.492 |
| Czech Republic | 0.415 | 0.412 | 0.415 | 0.438 | 0.439 | 0.394 | 0.495 | 0.401 | 0.491 | 0.415 | 0.414 | 0.417 | 0.440 | 0.528 | 0.525 |
| Denmark | 0.533 | 0.528 | 0.532 | 0.546 | 0.536 | 0.524 | 0.598 | 0.533 | 0.591 | 0.568 | 0.514 | 0.513 | 0.528 | 0.588 | 0.617 |
| Estonia | 0.401 | 0.393 | 0.381 | 0.398 | 0.420 | 0.385 | 0.496 | 0.397 | 0.484 | 0.411 | 0.403 | 0.408 | 0.429 | 0.512 | 0.552 |
| Finland | 0.513 | 0.503 | 0.487 | 0.507 | 0.516 | 0.486 | 0.570 | 0.505 | 0.561 | 0.492 | 0.476 | 0.501 | 0.498 | 0.567 | 0.590 |
| France | 0.790 | 0.760 | 0.845 | 0.812 | 0.788 | 0.766 | 0.779 | 0.763 | 0.817 | 0.765 | 0.764 | 0.721 | 0.760 | 0.788 | 0.791 |
| Germany | 0.779 | 0.760 | 0.805 | 0.735 | 0.761 | 0.777 | 0.811 | 0.844 | 0.859 | 0.858 | 0.840 | 0.862 | 0.847 | 0.864 | 0.898 |
| Greece | 0.402 | 0.386 | 0.383 | 0.397 | 0.389 | 0.350 | 0.422 | 0.354 | 0.464 | 0.349 | 0.363 | 0.355 | 0.382 | 0.468 | 0.483 |
| Hungary | 0.415 | 0.403 | 0.398 | 0.420 | 0.412 | 0.379 | 0.473 | 0.381 | 0.474 | 0.375 | 0.367 | 0.378 | 0.401 | 0.502 | 0.478 |
| Ireland | 0.517 | 0.489 | 0.478 | 0.501 | 0.480 | 0.451 | 0.583 | 0.469 | 0.575 | 0.496 | 0.500 | 0.464 | 0.485 | 0.574 | 0.539 |
| Italy | 0.515 | 0.569 | 0.618 | 0.607 | 0.605 | 0.562 | 0.604 | 0.569 | 0.572 | 0.528 | 0.532 | 0.550 | 0.530 | 0.589 | 0.580 |
| Latvia | 0.361 | 0.350 | 0.340 | 0.358 | 0.372 | 0.338 | 0.473 | 0.351 | 0.446 | 0.368 | 0.359 | 0.365 | 0.382 | 0.482 | 0.486 |
| Lithuania | 0.383 | 0.369 | 0.361 | 0.375 | 0.400 | 0.362 | 0.464 | 0.383 | 0.482 | 0.400 | 0.391 | 0.385 | 0.405 | 0.499 | 0.504 |
| Luxembourg | 0.447 | 0.452 | 0.455 | 0.471 | 0.479 | 0.452 | 0.538 | 0.450 | 0.540 | 0.479 | 0.446 | 0.451 | 0.476 | 0.560 | 0.560 |
| Malta | 0.415 | 0.411 | 0.402 | 0.429 | 0.444 | 0.391 | 0.488 | 0.403 | 0.488 | 0.400 | 0.389 | 0.396 | 0.410 | 0.483 | 0.494 |
| Netherlands | 0.583 | 0.542 | 0.574 | 0.587 | 0.592 | 0.539 | 0.587 | 0.548 | 0.612 | 0.548 | 0.524 | 0.562 | 0.621 | 0.645 | 0.690 |
| Poland | 0.397 | 0.400 | 0.397 | 0.471 | 0.476 | 0.440 | 0.540 | 0.474 | 0.550 | 0.455 | 0.445 | 0.451 | 0.479 | 0.548 | 0.539 |
| Portugal | 0.398 | 0.394 | 0.409 | 0.433 | 0.423 | 0.372 | 0.451 | 0.387 | 0.482 | 0.402 | 0.393 | 0.400 | 0.417 | 0.514 | 0.526 |
| Romania | 0.324 | 0.324 | 0.327 | 0.343 | 0.372 | 0.325 | 0.439 | 0.337 | 0.425 | 0.332 | 0.341 | 0.347 | 0.355 | 0.473 | 0.465 |
| Slovak Republic | 0.366 | 0.357 | 0.356 | 0.377 | 0.394 | 0.349 | 0.434 | 0.350 | 0.449 | 0.366 | 0.357 | 0.350 | 0.366 | 0.456 | 0.447 |
| Slovenia | 0.400 | 0.389 | 0.391 | 0.416 | 0.413 | 0.376 | 0.468 | 0.376 | 0.466 | 0.382 | 0.379 | 0.383 | 0.406 | 0.498 | 0.494 |
| Spain | 0.711 | 0.725 | 0.706 | 0.671 | 0.664 | 0.640 | 0.638 | 0.610 | 0.633 | 0.571 | 0.615 | 0.630 | 0.670 | 0.748 | 0.706 |
| Sweden | 0.522 | 0.513 | 0.523 | 0.544 | 0.556 | 0.526 | 0.594 | 0.537 | 0.600 | 0.513 | 0.513 | 0.527 | 0.534 | 0.588 | 0.625 |
| Ukraine | 0.425 | 0.401 | 0.417 | 0.432 | 0.451 | 0.407 | 0.511 | 0.405 | 0.425 | 0.294 | 0.298 | 0.330 | 0.386 | 0.471 | 0.455 |