


The essence of the evolution of the green innovation ecosystem is the process by which the positive strategy of green innovation spreads in a complex network. In this study, the "Object-Technology-Environment-Management-Culture (OETMC)" structure paradigm of innovation ecosystems is presented, and a causal analysis framework of green innovation ecosystem evolution based on green innovation behavior strategy, supported by green innovation efficiency and focused on green innovation ecosystems is developed. Based on this framework, the structure of the green innovation ecosystem and the diffusion process of positive green innovation in the network are discussed. The results reveal the following. (1) The complexity of the green innovation ecological network has visibly improved, but numerous blank connections remain. These are the key constraints that hinder structural evolution. (2) The appearance of a large number of long-range connections weakens the constraint of geographical distance but also hinders edge nodes from joining the network. (3) The existence of preference attachment and power law distribution of the green innovation ecological network leads to the incomplete convergence of positive green innovation strategy at any initial strategy ratio. (4) Default cost and pollution tax rate ensure the enthusiasm of green innovation actors to seek innovation cooperation by increasing opportunity costs, thus accelerating the formation and reconstruction of the green innovation ecological network. These conclusions provide a decision-making reference for governments to encourage green innovation subjects to formulate targeted policies.
Green innovation provides a feasible scheme for reducing the negative externalities resulting from traditional economic growth and the additional costs of environmental pollution and has become an important means for countries worldwide to pursue sustainable development (Zhang et al., 2023; Satrovic et al., 2024). Green innovation, also known as ecological innovation, environmental innovation, and sustainable innovation, expands and supplements the concept of innovation adding the influence of economic, social, ecological, and other factors, and has richer theoretical connotations and practical significance (Fan et al., 2022; Zhao et al., 2021). In essence, it is an innovative activity aimed at reducing pollution outputs of production processes and enhancing the ecological environment's carrying capacity and sustainability. These goals embody the organic integration of social value, economic value, humanistic value, and technical value (Huang et al., 2022). Green innovation has become a key measure of how developing countries deal with international sustainable governance trends such as carbon taxes on trade and carbon trading. How to build and improve a green innovation system and lead in gaining core technological advantages in global sustainable development governance has also become a focus of attention around the world (Zhang et al., 2022a).
The wide application of next-generation information technologies such as 5 G and AI in various fields not only provides strong support for the transformation of the green innovation paradigm but also intensifies the reshaping of international green technology competition patterns. As the largest developing country, China faces greater challenges in green innovation (Zhang et al., 2022b; Xu et al., 2021). On the one hand, the spatial imbalance of the allocation of innovative elements leads to significant gaps between regions. Compared with China's eastern coastal areas, the central and western regions have weaker innovation foundations and insufficient supplies of innovative elements, which results in them being marginal regions in the overall green innovation spatial layout (Han et al., 2022; Ye et al., 2020; Zhang et al., 2022a); On the other hand, China has yet to form a complete green innovation system. Although the innovation agglomeration mode with provincial capital cities (or central cities) as the core plays a vital role in improving the efficiency of cooperative innovation, some problems remain, such as inaccurate policies, weak initiatives related to innovation subjects, and an imperfect innovation environment (Han et al., 2024). Targeting these problems, how to promote the transformation of China's linear green innovation to nonlinear, from innovation organization to innovation network, and from innovation cluster to innovation ecosystem has become unavoidable and realistic problems within the current international competition for green technology innovation (Jin et al., 2024).
A similar concept of innovation ecosystems can be traced to the commercial ecosystem described by James Morre in 1993, which was first formally presented in the research report of the American Competitiveness Council in 2004. It was not until 2013, when the European Union proposed the "Innovation 3.0″ paradigm, with the innovation ecosystem at its core, that this concept gained widespread attention in all social sectors (Lian et al., 2022). With increased research, the definition of an innovation ecosystem has tended to diversify. It is generally believed that the innovation ecosystem is a network structure formed by a series of stakeholders participating in value-creation activities around core enterprises. There is a strong technical dependence among stakeholders, and they can capture, integrate, innovate, diffuse, and increase the value of complementary knowledge with and among other stakeholders by exerting their unique advantages. This definition emphasizes the relationship between innovation subjects but ignores the guiding role of the external environment in the formation and evolution of innovation ecosystems. (Li et al., 2022a, 2022b).Therefore, innovation ecosystems are also described as a functional complex with a specific scale and structure formed by the interdependence of innovation subjects and environments through knowledge, technology, culture, etc., within a certain time and space, or as an industrial cluster "innovation habitat" with diversified cooperation and unified action standards (Zhou et al., 2022). Furthermore, from the perspective of composition and system structure, the innovation ecosystem is also an organizational community that includes several layers, including core, extension, outer, and derivative layers. Each layer is connected by the value chain, industrial chain, knowledge chain, and trust relationship, which form an internal mechanism to promote the evolution of an innovation ecosystem (Liu & Liang, 2024). Similar to natural ecosystems, the driving force of self-organization evolution in innovation ecosystems primarily comes from the interaction and transformation of information, knowledge, and resources among internal populations and the external environment (Irfan et al., 2022; Bohn & Rogge, 2022; Abid et al., 2022). Thus, the strategic selection of an innovative population in response to external environmental changes is a direct inducement for the evolution of innovation ecosystems. This is because the nonlinear effect of an innovation ecosystem will lead to some strategic behavior of the innovation subject not being locally limited, but spreading to other species or populations unpredictably. Additionally, the evolutionary direction of innovation ecosystems will be determined by the law of natural selection.
In summary, prior research has primarily focused on examining the concepts of discrimination, structural characteristics, and evolutionary mechanisms of innovation ecosystems, which have certain supplementary effects on enriching and perfecting the theory of innovation ecosystems. However, there the following problems still deserve further consideration.
- (1)
The deconstruction of the innovation ecosystem from a comprehensive perspective. Previously, evolutionary economic geography was used to explain the structural composition, community characteristics, and evolutionary trends of innovation ecosystems. Although effective, this is insufficient to fully explain the ecological and systematic characteristics of innovation ecosystems.
- (2)
Innovate the complexity of ecological network topology. Innovation ecological networks play key roles in promoting the formation and evolution of innovation ecosystems. Their structural complexity reflects the flow state of elements among innovation subjects and also provides a search path for the diffusion of game strategies among innovation subjects. Nevertheless, the morphological evolution and structural characteristics of innovation ecological networks still have attracted insufficient attention.
- (3)
The essential law and underlying logic of innovation ecosystem evolution, a logical population growth model, and a Lotka-Volterra competition analysis model are often used to examine interactions between innovation groups and to explain the evolutionary choices of innovation ecosystems, but these methods cannot explain strategic choice mechanisms of innovation subjects and their influence on the whole ecosystem (Zhou et al., 2022; Zhang et al., 2022a).
The evolution law of the innovation ecosystem discussed in this study is based on the strategic choice of the innovation subject. Compared with prior studies, the main contributions of this study are as follows.
- (1)
It explains the characteristics and formation mechanism of a green innovation ecosystem from the comprehensive perspectives of ecology, innovation, and system, and attempts to summarize the basic paradigm structure of an innovation ecosystem based on comparing different types of green innovation ecosystems with different spatial scales to provide theoretical support for the discussion of operation mechanisms.
- (2)
It uses cities as the basic communities in innovative ecosystems to construct a green innovation ecological network based on the efficiency of urban green innovation, examines the morphological evolution and structural characteristics of the innovation ecological network in geographical space, and identifies the diversified ecological network structure formed locally by the innovation community.
- (3)
It establishes a causal analysis framework for green innovation ecosystem evolution based on the behavior of green innovation agents, supported by green innovation efficiency, and focused on green innovation ecological networks. Based on this framework, the complex network evolution game model is used to simulate the diffusion mechanism of a green innovation agent strategy within an ecological network and its sensitivity to external factors.
The marginal contributions of this study lie in presenting a causal analysis framework that spans micro (the primary strategy of green innovation) to macro (innovation ecological network), expounding the underlying logical law of the evolution of green innovation ecosystem, and considering the influence of geographic space on the evolution and strategic diffusion of innovation ecological networks. This presents a new research paradigm for related research which not only highlights the ecological and systematic nature of green innovation activities, but is also generalizable to other countries or regions, and can provide a decision-making reference for promoting the construction of a green innovation ecosystem.
Mechanisms and characteristics of green ecosystem formationParadigm structure of green innovation ecosystemAccording to various research scales, innovation ecosystems can be divided into five levels: industrial innovation ecosystems, urban innovation ecosystems, regional innovation ecosystems, national innovation ecosystems, and global innovation ecosystems (Yang et al., 2022; Xu et al., 2022; Ramkumar et al., 2022). Despite the concept of enterprise innovation ecosystems presented in some studies, we believe that enterprise innovation activities do not meet the basic characteristics of innovation ecosystems. On the one hand, it is usually difficult for enterprises to possess all the resources necessary for innovation activities, which requires cooperation with other innovation subjects and access to their superior resources. Additionally, the innovation ecosystem should have all the elements that can meet the innovation needs of internal communities. On the other hand, the internal relationship of an enterprise is simple, it cannot form standardized industrial technical standards, and the degree of external influence is far greater than the degree of transformation of the external environment; thus, it lacks ecological characteristics. The innovation activities of enterprises belong to an innovation system, not an innovation ecosystem. Therefore, it is necessary to discuss the basic structure of innovation ecosystems using different research scales. Innovatively, we summarize the paradigm structure of an innovative ecosystem, which includes objects, environment, technology, management, and culture (the OETMC paradigm).
Governments, enterprises, universities, research institutes, financial institutions, intermediaries, and users are the most active elements in innovation ecosystems. The enterprise is a key part directly involved in green innovation activities and is also an important carrier in promoting the marketization and industrialization of green innovation achievements. Its advantage is its high sensitivity to market demand. Rich R&D investment provides more trial and error costs for the enterprise's green innovation activities and also provides guarantees for improving the efficiency of green innovation and shortening the innovation cycle (Pushapananthan & Elmquist, 2022; Nylund et al., 2021). Universities and research institutes are primarily responsible for exploring the frontier of green innovation technology and knowledge, and promoting it while providing corresponding talent support for green innovation activities. As the "adhesive" to ensure the coordinated and efficient operation of all innovation subjects, the government intends to develop incentives such as reducing the risks associated with green innovation, building an innovation platform to provide a harmonious innovation environment for innovators, and guiding or cultivating the independent innovation ability of participants through management system innovation. Thus, the government can also be considered among the direct participants in green innovation. Financial institutions fund R&D for innovative subjects and green finance and innovation subsidies lower the risk of green innovation, increasing participation and enthusiasm in innovative green innovation subjects (Wu et al., 2022). Intermediary service organizations include public organizations and professional organizations. The former primarily provides consultation, legal protection, and technology trading services for innovation actors, while the latter is composed of clusters that provide professional support services such as industrial alliances and trade associations. Users are both the source of green innovation demand and the users of green innovation products or services. Their green demand and information feedback somewhat guide the research and development direction of innovation.
The market, technical, institutional, financial, and ecological environments all provide carrier support for green innovation activities. The market environment reflects the needs of current users and niche market space and can provide research and development direction for green innovation subjects. Technology environments can help innovation subjects quickly locate their technology niche within a green innovation ecosystem and formulate appropriate innovation strategies based on the state of their own technology (Min et al., 2020; Melander & Arvidsson, 2022). Institutional and financial environments are usually the focus of a series of measures taken by the government to promote green innovation. For small and medium-sized enterprises or start-ups, they can quickly improve their innovation capability and reduce innovation risks and costs. The natural environment is the fundamental source of various elements in green innovation activities and is also the basic space where the green innovation ecosystem is located.
Technology is the initial driving force for the formation of the relationship between innovation subjects. The diversity of green technology stock, standardization of green technology norms, and trading volume of the green technology market reflect the activity of the green innovation ecosystem. In this ecosystem, management is represented by heteronomy management and self-organization management. Heteronomy management refers to the macro-control mechanism with the government as its core and is the external factor that determines the evolutionary direction of the green innovation ecosystem. Self-organization refers to the system evolution mechanism formed by a long-term strategy game with the relationships among innovation subjects as the main line. This includes the internal factors that affect the evolutionary direction of a green innovation ecosystem (Wang et al., 2022a; Liu et al., 2021). The culture is primarily reflected in that the main body of green innovation has the same or similar value orientation. Additionally, religious beliefs, behavioral habits, aesthetic concepts, and corporate cultures will also affect the formation of a green innovation ecosystem.
With the guidance of the OETMC paradigm and considering the following advantages, we chose to investigate the characteristics and evolutionary mechanisms of green innovation ecosystems at the city scale. (1) As an independent and complete administrative unit, a city's internal elements should be based on the overall city's goals regarding strategic planning and scheme implementation. Additionally, (2) a city contains all the elements of the OTEMC paradigm and can be regarded as a community or subsystem in the innovation ecosystem. Furthermore, (3) the urban green innovation ecosystem not only includes the micro-scale industrial green innovation ecosystem but also belongs to the regional green innovation ecosystem as a green innovation community. Therefore, the city scale will become a bridge to realize the unity of opposites from micro (strategic choice) to macro (system evolution).
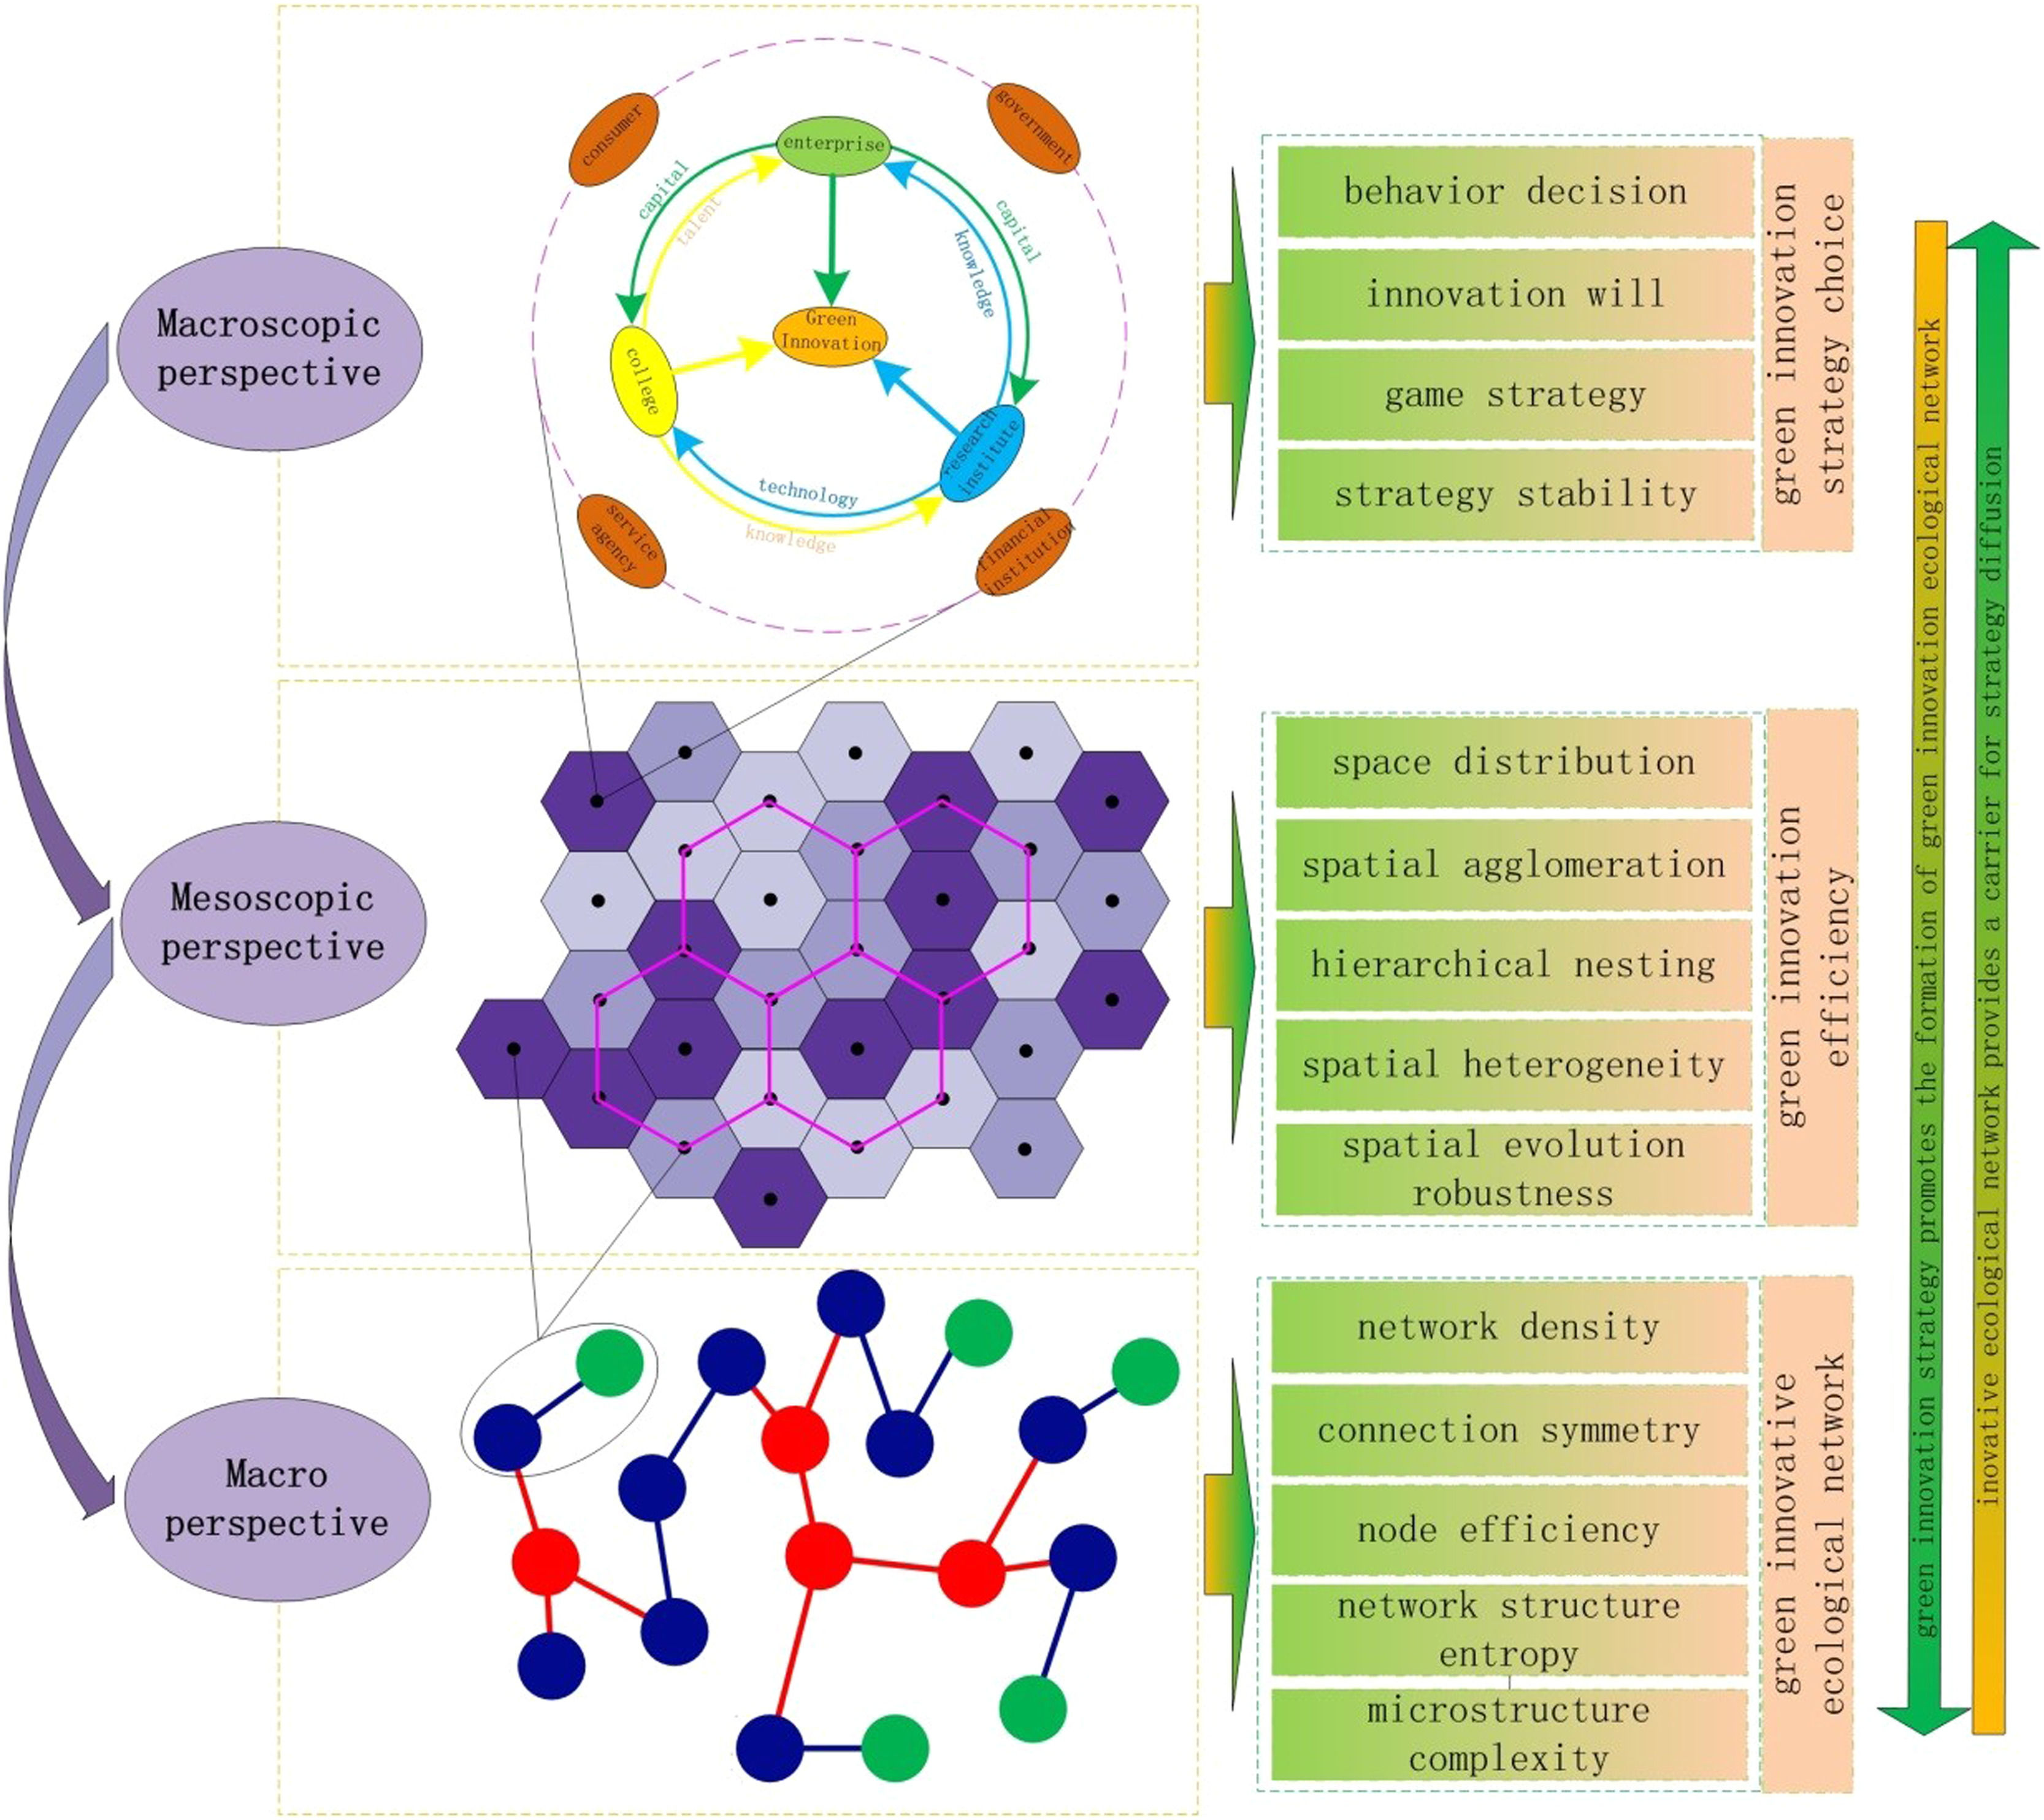
Formation mechanism of the green innovation ecosystemAs described earlier, the evolution of a green innovation ecosystem is the result of the strategic game between green innovation subjects relying on the green innovation ecological network. Here, we present a causal analysis framework from micro to macro to explain this perspective (Fig. 1).

Research institutes, universities, and innovative enterprises have become the backbone of green innovation. Although they differ greatly in organizational structures, technology preferences, and management systems, they are very complementary in resource endowment, knowledge structure, and platform carrier, which makes their deep coupling constitute the core kinetic energy of green innovation (Zhang et al., 2021; Li et al., 2022c). The innovation subject invests in green innovation elements such as human resources, infrastructure, and R&D funding, and produces academic papers, technical patents, and new theoretical knowledge through cooperation or competition with others. The relative value of input and output reflects the green innovation performance of the participants. Therefore, the input and output of all innovation subjects reflect the comprehensive level of urban green innovation—that is, the efficiency of green innovation. However, the spatial distribution of urban green innovation efficiency is usually unbalanced. The combined actions of the spillover effect and the siphon effect result in the formation of a hierarchical nested spatial pattern with administrative divisions as the boundary which evolves into diverse agglomeration areas (Li et al., 2022d; Satrovic et al., 2024). The elements of green innovation in the surrounding areas of the agglomeration rely on value, industrial, innovation, and element chains to flow to high-efficiency areas, thus promoting the formation of a green innovation ecological chain among cities, and forming a green innovation ecological network with complex structure and diverse forms in certain areas (Li & Sun, 2021; Fang et al., 2022).
A green innovation ecological network is an abstract expression of the internal relationships within a green innovation ecosystem. It provides a search path for innovation subjects to choose game objects and also provides carrier support for the strategy diffusion of green innovation subjects (Jin et al., 2022; Javanmardi, 2022). Therefore, we will utilize the morphological characteristics and structural complexity of a green innovation ecological network as the fundamental starting point to examine the evolution of a green innovation ecological system (Jin et al., 2024). The evolution of green innovation ecosystems is primarily reflected in four aspects: system structure, subsystem behavior, system state, and environmental adaptability. The purpose of its evolution is to improve the green innovation ability of innovation subjects and gradually clarify their niche within the entire system. Especially for new enterprises, this can help them quickly develop various resources and accelerate their embedding into the entire ecosystem. Therefore, system evolution is the process of differentiation and optimization in the green innovation ecosystem.
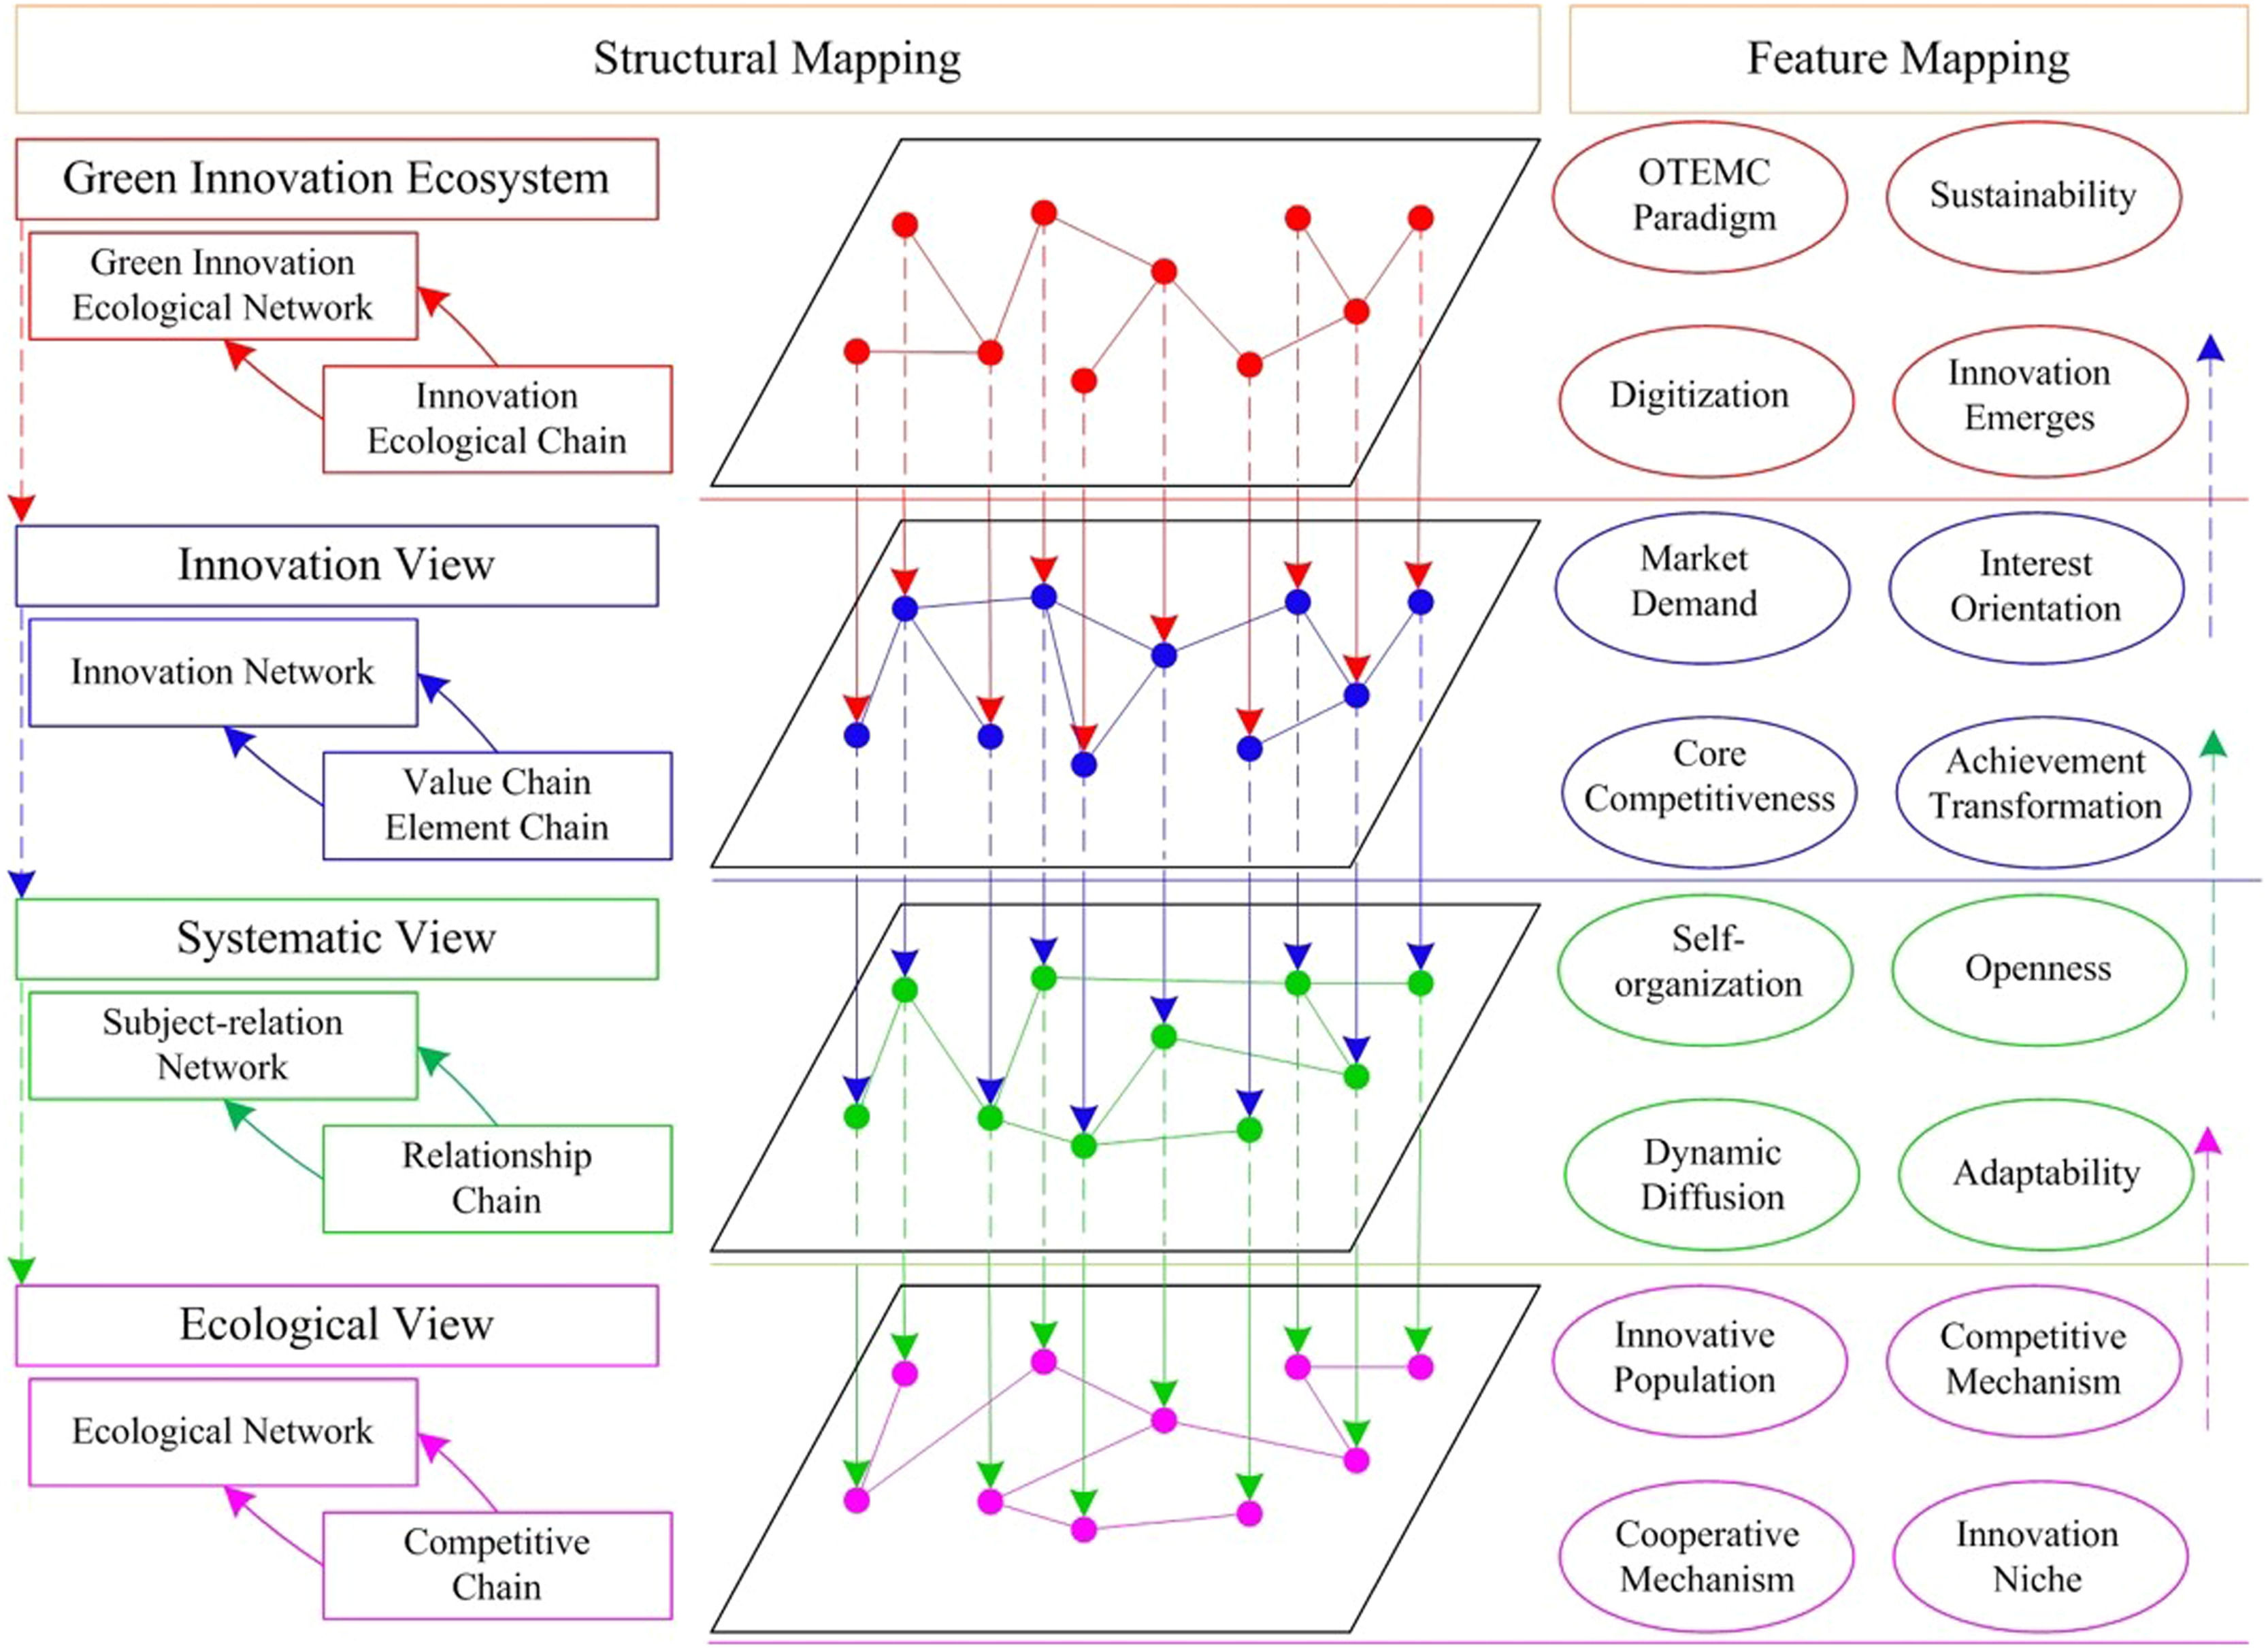
Multidimensional mapping of the green innovation ecosystemEvolutionary economic geography theory has difficulty effectively explaining the complexity of the green innovation ecosystem. This motivates us to try to analyze the mapping characteristics of the green innovation ecosystem from the comprehensive perspectives of innovation, systematics, and ecology (Fig.2). Fig. 2 shows the structural mapping and feature mapping of the green innovation ecosystem in different dimensions. Structural mapping explains the green innovation ecosystem according to the OTEMC structural paradigm and thus obtains its innovation view as an innovation network composed of the value chain, factor chain, and industrial chain. Similarly, the system view presents a loose subject-relationship network with characteristics including the socialized division of labor, and an ecological view, and reveals an ecological network formed by the interaction of the competition and cooperation chains. Therefore, we believe that the green innovation ecosystem can be understood as a composite network formed by the superposition and coupling of the innovation network, the subject-relationship network, and the ecological network, which is the key carrier of the operation and evolution of the innovation ecosystem. Feature mapping not only sums up all types of mapping network features but also includes new features emerging from the interaction between networks, as shown in Fig. 2.

In the context of innovation, green innovation activities are profit-oriented, and to maintain their core competitiveness, enterprises will give priority to green technology development and green product production, and obtain surplus profits in niche markets (Yao et al., 2020; Farooq et al., 2024). Due to the constraints of enterprise scale and superior resources, a linear cooperation model has been formed among enterprises and has evolved into a green innovation cooperation network with core enterprises forming the mainstay and supplemented by non-core enterprises. Research institutions focus on national strategic needs and key funding projects to conduct strategic integrated innovation and focus more on improving original innovation ability and frontier theory breakthroughs. Universities serve as green innovation knowledge transmitters while also producing elements of green innovative talent (Wang et al., 2022a).
From a systematic perspective, the green innovation ecosystem is a subsystem embedded in the economic-social-ecological system and has a typical dissipative structure (Yang et al., 2021). That is, the green innovation ecosystem must continuously input outside materials and energy to ensure normal system operations. If inputs cease, the system will no longer exist. This feature reflects the dynamic and stable nature of the green innovation ecosystem. Furthermore, it also meets the characteristics of synergy, hierarchy, and nonlinearity. However, we believe that the emergent properties of the green innovation ecosystem are the most noteworthy, as they describe characteristics that individual elements of the ecosystem lack. Generally, the structure of a green innovation ecological network is considered the emergence of the complexity of a green innovation ecosystem and reflects the sum of complex relationships among green innovation subjects (Xu et al., 2018; Wang & Yang, 2022b).
Ecological features are important distinctions between the green innovation system and the green innovation ecosystem. The ecology of the green innovation ecosystem is primarily reflected in the close cooperation and well-defined competition and cooperation relationships among innovation subjects, which are win-win and can be adaptively adjusted according to external environment changes to maintain the system's stability. From the ecological perspective, various types of green innovation subjects represent species in the ecosystem, and each green innovation species is in specific technical, social, and economic niches. Its cooperation scope with other green innovation subjects constitutes the niche space of this species. All the innovative species and innovative environments in a given space-time range constitute an innovative community (the urban community is the research object in this study), and the innovative community belongs to a larger green innovation ecosystem (Lian et al., 2022).
The innovation ecosystem also follows the evolutionary law of "natural selection." Its genetic mechanism is reflected in the green innovation subject's imitation behavior. For the innovation subject, this can directly obtain the existing innovation results through "genetic factors." Genetic factors include a mature green innovation management system, green innovation technology, theoretical knowledge, etc., which strongly support the promotion of green innovation ability in new innovative subjects. However, to maintain the core competitiveness of its own products or services, the imitated innovation subject will launch new innovations in combination with market demand, that is, the variation mechanism of green innovation (Wang et al., 2021; Walrave et al., 2018). Nevertheless, not all green innovation achievements can adapt to changing innovation environments and the selection mechanism of the green innovation ecosystem will eliminate ineffective innovations.
Combined with the above analysis, we define the concept of a "green innovation ecosystem" as occurring within a certain time and space and where all types of innovation actors both compete and cooperate to develop, produce, or provide after-sales green technologies, green products, or services, and form complex network relationships through strategic games. The green innovation ecosystem is an ecological, systematic, self-organizing, and adaptive green innovation function complex based on this complex network relationship.
Methods and materialsConstruction of the green innovative ecological networkThe green innovation network, which is based on attribute data such as cooperative patent data, property right relationships, value chains, and talent flow, can somewhat describe the strength of the green innovation ecological chain among regions. However, due to data source singleness and preferences, calculation results are one-sided and it is difficult to describe the formation and evolution complexity of the green innovation ecological network in a panoramic way (Zhang et al., 2022a; Teng et al., 2021; Russell & Smorodinskaya, 2018). Additionally, this network construction type usually ignores the flow of physical production factors such as human capital, R&D funds, and infrastructure investment among green innovation subjects, especially the non-physical influences such as knowledge transfer, experience sharing, and spillover effects among green innovation subjects. This unilaterally separates the logical relationship between the allocation of green innovation factors and the formation of spatial topological networks (Shaw & Allen, 2018). Therefore, we chose the ecological efficiency of green innovation as the basic data for constructing the green innovation ecological network and attempted to optimize the original network construction method.
The following aspects generally reflect the feasibility of constructing a green innovation ecological network with green innovation efficiency: (1) Green innovation efficiency quantifies the rationalization degree of allocation of green innovation elements on an urban scale from the perspective of input and output, thereby avoiding the malpractice of "output-only theory" that attaches importance to outputs and neglects inputs, and enhances the differentiation of green innovation efficiency in different cities while considering the characteristics of comprehensiveness and comprehensiveness. (2) The evaluation index system of green innovation efficiency is highly consistent with the formation mechanism of the green innovation ecological network shown in Fig. 1. Therefore, the capital investment and human capital in the index system are the mapping of capital flow, factor flow, and knowledge flow in the green innovation network. This fundamentally eliminates the one-sidedness of calculation results caused by a single data source and reflects the feasibility and applicability of building a green innovation ecological network based on efficiency. (3) This index realizes the unity of the strategic choices of the green innovation subject and the evolution of the green innovation ecological network structure. The efficiency of urban green innovation reflects the ability of green innovation subjects to play games and produce results under various influencing factors, and also possesses the key power to promote the evolution of the green innovation ecological network and becomes a bridge connecting micro and macro.
As green innovation efficiency must consider unexpected outputs in production processes, services, and development, we chose the SBM model considering unexpected output as the green innovation efficiency measurement model as it can incorporate the slack variables into the objective function and weaken the influence of radial and angle on the accuracy of measurements in traditional models (Zhang et al., 2022a). The specific formula is as follows:
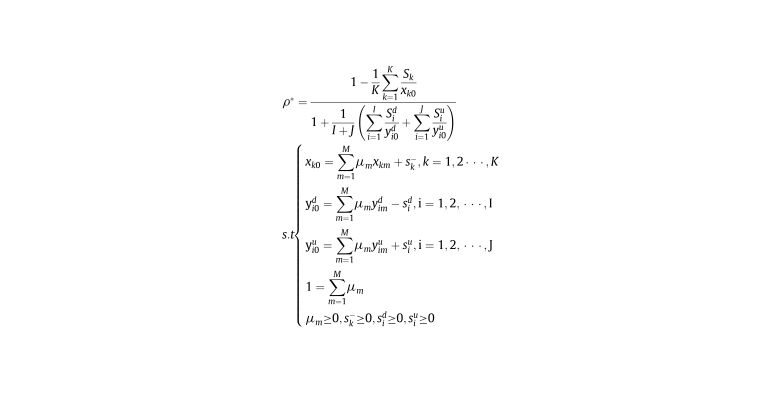
Whereρ*represents the efficiency of urban green innovation, the value range is [0,1]. K,I,Jrepresent the quantity of input, output, and unexpected output, respectively. sk−, sid,siurepresent slack variables of input, output, and unexpected output, respectively. xk0,yi0d,yi0u represent input, output, and unexpected output respectively, andμmis the correction coefficient.
Setting the characteristic index of green innovation ecological networkFig. 1 shows that the formation of a green innovation ecological network depends on the spatial imbalance of green innovation efficiency. This indicates that the influence of geographical space distance must be considered when constructing green innovation ecological network relationships. This is consistent with the description of economic diffusion theory by new economic geography. Therefore, we chose the gravity model as the basic model to describe the correlation of green innovation among cities. Since the efficiency of green innovation emphasizes the rationalization degree of factor allocation, there may be a problem of "pseudo-efficiency" in the results, that is, the high or low input and output results that suggest falsely high efficiencies for green innovation. Pseudo-efficiency nodes will generate redundant connections in the ecological network for green innovation. Economic distance is introduced to weaken the influence of such nodes. Economic distance reflects the economic scale gap between cities and simultaneously reflects the preference and attachment characteristics of a green innovation network. The optimized gravity model is as follows:

WhereFijrepresents the green innovation attraction of city i to city j, that is, the strength of the green innovation ecological chain; PiandPjrepresent the green innovation efficiency of cityito cityjrespectively; DijandEijrepresent the geographical distance and economic distance between cityito cityj, respectively; K is the correction coefficient and is used to adjust the data magnitude and enhance contrast.
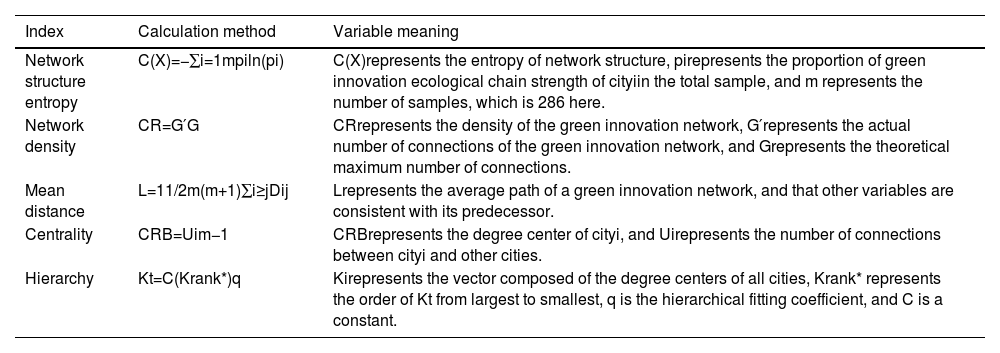
Considering the complexity of the green innovation ecological network structure, we defined the network density, hierarchy, network structure entropy, centrality, and average distance to describe its characteristics (Table 1). Specifically, the network density reflects the ratio of the existing number of connections in a green innovation ecological network to the theoretical maximum number of connections. The greater the value, the stronger the ecological innovation chain between cities. Network structure entropy describes the order of the evolution of a green innovation ecological network, and is the quantitative expression of its self-organization effect. The greater its value, the greater the ecological network's chaos degree, and vice versa, the stronger the ecological network's order. Hierarchy reflects the connectivity gap between nodes in the green innovation ecological network and indirectly describes nodes' degrees of control of the green innovation resources in the ecological network. The larger the fitting coefficient, the more serious the differentiation of the ecological network for green innovation is. Centrality describes the connectivity of urban nodes in the green innovation ecosystem, with the average distance reflecting the flow rate of green innovation elements within the ecological network. The greater the value, the more nodes the elements pass through, and the worse the transmission speed and fluency of an ecological network for green innovation.
Characteristic indicators of green innovation ecological network.
An evolutionary model can predict the direction of group evolution by simulating the competition and cooperation among different biological populations in nature, and it is widely used in social and economic fields, especially in analyzing the behavior of enterprises in the market (Zhang et al., 2022a; Benitez et al., 2022; Barile et al., 2022). This study chooses an evolutionary game model to discuss the diffusion process of green innovation behavior. Compared with the particle swarm optimization algorithm and genetic algorithm, its advantages primarily involve dealing with dynamic interaction and strategy evolution, especially the bounded rationality of players, which is very important to understanding the evolution of green innovation ecosystems. Therefore, due to incomplete information and cognitive biases among participants, they cannot obtain the best choice through one decision, but must combine the strategies of other decision makers and the changes in the external environment, and then gradually approach the satisfactory strategy through constant "trial and error." This "trial and error" process is macroscopically manifested as the diffusion of game strategies on the green innovation ecological network and microscopically interpreted as the learning or imitation of game strategies among green innovation subjects.
The evolution game model remains a "black-box test" analysis process, which divides the participants into different game groups according to the game strategy, and judges the final evolution direction through the change in the number of groups. Notably, the game behaviors among individual members in different groups are random, which is inconsistent with the basic law of green innovation subject's preferential imitation and preference attachment. However, the preference attachment characteristics of green innovation ecological networks limit the game set of green innovation subjects, and simultaneously follow the causal relationship of ecosystem evolution in Fig. 1. Therefore, it is necessary to build an evolutionary game model based on a green innovation ecological network. Additionally, we optimize the evolutionary game model of complex networks. In prior research, random networks have usually been constructed by setting relevant parameters (centrality, network density, etc.) to replace real networks as the carriers of evolutionary game models. Although the vast majority of networks, in reality, have a power-law distribution and scale-free characteristics, random networks do not account for geographical space distance and cannot accurately describe changes in network characteristics. Therefore, its essence remains the analysis mode of the "black box test" (Bai et al., 2021; Dedehayir et al., 2018). Thus, the game model of complex network evolution is constructed based on the green innovation ecological network and the following assumptions are presented.
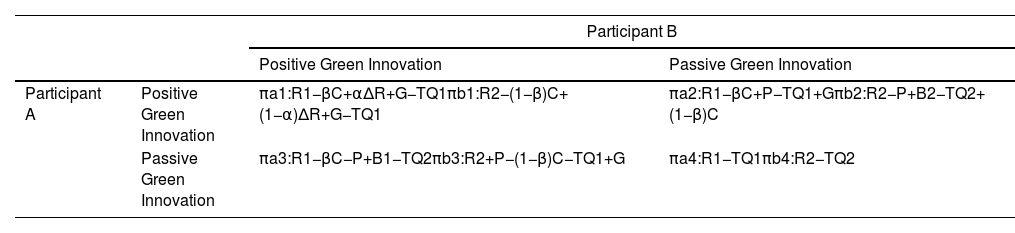
Assumption 1: Green innovation subjects determine their behavioral strategies according to innovation ability, market environment, other players' strategies, and risk tolerance. This means that they can adopt the strategy of {active green innovation}, continuously increase investment in green innovation, and develop new markets. Similarly, they may also adopt the strategy of {negative green innovation} to avoid risks and reduce costs. The strategic space of each green innovation subject is {positive green innovation, negative green innovation}, and the proportion of innovation subjects adopting the {positive green innovation} strategy is δ, and the proportion of innovation subjects adopting the {negative green innovation} strategy is 1−δ in the whole green innovation ecosystem.
Assumption 2: In the absence of any competition or cooperation among green innovation subjects, basic profits can still be made. The basic profit of the innovation subject adopting the {positive green innovation} strategy isR1, while the basic profits of the innovation subject adopting {negative green innovation} strategy isR2.
Assumption 3: Cooperation requires an additional cost C, and the proportion of innovation subjects adopting the two strategies is β and 1−β, respectively. The profits ΔR obtained from cooperative R&D will be distributed according to the ratios of αand 1−α. In the process of cooperative innovation, any party can gain additional profit B1 and B2 due to resource sharing after betraying their partners, but this behavior will also pay the default cost P.
Assumption 4: The government will provide financial subsidy G to the innovation subject that adopts the strategy of {positive green innovation}, but will simultaneously also adopt a carbon tax, pollution tax, energy use rights, and other governance measures, which will be recorded as pollution tax rate T. The pollutant discharge of innovative subjects adopting {positive green innovation} and {negative green innovation} strategies is recorded as Q1and Q2, respectively.
Assumption 5: After completing a round of the game, the players will compare their profit Uiwith the average profit Uave and judge whether to change their strategies accordingly. If the profits are lower than the average profit of nodes, they will imitate other node strategies with a specific probability according to the profit gap. The specific probability calculation formula is as follows:
where k is external noise. When k→0, it means that bounded rationality and external environmental influence will hardly change the player's strategy. When k→∞, it shows that bounded rationality and the external environment greatly influence the players' strategic choices, so that they cannot make rational judgments.
Assumption 6: Game participants will disconnect the least profitable node connected to themselves and randomly search for other nodes in the green innovation ecological network with which to establish connections. This disconnection and reconnection mechanism reflects the feedback effect of the strategic choices of the green innovation subject on the system's evolution and also describes the preference and attachment characteristics of the green innovation ecological network.
The above analysis and assumptions support the construction of the payment matrix for the evolution game of green innovation ecological networks (Table 2). The algorithm in Appendix A simulates the diffusion process of the {positive green innovation} strategy of green innovation subjects on a green innovation ecological network.
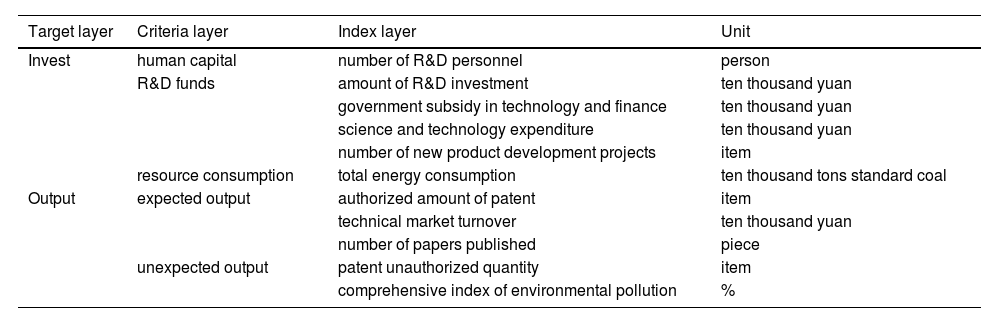
Data explorationGreen innovation efficiency index systemThe construction of a green innovation efficiency index system must follow the principles of comprehensiveness, systematicness, and hierarchy, and reflect the embeddedness of green innovation activities in societies, economies, and ecology (Table 3). From the input perspective, human beings, as the most basic elements in green innovation activities, have the characteristics of flexibility and initiative, and are both leaders and participants in the process of green innovation (Zhang et al., 2022a; Ba et al., 2021). The quality and quantity of human capital will directly affect the efficiency and profit of green innovation activities, especially the cultivation and available pool of high-quality talent. Notably, core technical talents play an important role in promoting and stimulating the green innovation potential of innovation subjects; therefore, the number of R&D personnel was chosen to represent human capital investment. R&D funds are the power guarantee of the entire green innovation process, function as catalysts in the smooth progress of the green innovation process, accelerate technological research, and also provide basic support for developing new projects. The R&D funds of innovative enterprises in China primarily come from self-financing and government subsidies, while scientific research institutions and institutions of higher learning primarily rely on government subsidies and state funding. R&D investment, government financial subsidy, number of new product development projects, and scientific and technological expenditure are used to characterize R&D investment. Yet, green innovation activities must also consider resource consumption. Due to data availability, this study did not consider the consumption of natural resources, such as land and water, but chose coal, natural gas, electricity, and other resources to represent the resource input of green innovation activities. As described earlier, the interest demands of different green innovation subjects differ. Enterprises usually focus on developing new technologies to ensure their core competitiveness, seek niche markets, and gain profits through developing new technologies, processes, or products. In contrast, universities and scientific research institutions focus more on acquiring patents, publishing academic papers, and other achievements. Therefore, the number of authorized patents, technology market turnover, and the number of academic papers published are used as the expected output of green innovation efficiency. Additionally, the number of unauthorized patents and the comprehensive index of environmental pollution are used to express unexpected output (Zhang et al., 2022b).
Index system of green innovation efficiency.
Since 2010, China has successively presented strategic measures such as "green development," "innovation-driven," and "new development concept," which are very similar to the United Nations' 17 Sustainable Development Goals (SDGs). Studying the relationship between green innovation subjects’ strategy of diffusion and the evolution of the green innovation ecological network during this period can provide a model template for the construction and optimization of a regional green innovation ecosystem. A total of 286 Chinese cities from 2010 to 2021 were selected as research samples, and the data sets were obtained from the China Urban Statistical Yearbook (2010–2020), China Environmental Statistical Yearbook (2010–2020), China Urban Database (http://olap.epsnet.com.cn, 5 August 2022), and statistical yearbooks of various provinces and cities. The number of papers published in the green efficiency measurement index system was obtained from the China National Knowledge Infrastructure (CNKI) and Web of Science (WoS) databases. The CNKI search terms included the following: Subject = "Green Innovation" AND Keywords = "green innovation efficiency + ecological innovation + environment innovation" AND Affiliation = "city name" AND Literature source = "CSSCI" AND Year = "2010–2021." The WoS retrieval formula was as follows: Retrieval range = "Web of Science Core Collection," Editions = "Science Citation Index Expanded (SCI-EXPANDED)–1900-present + Social Sciences Citation Index(SSCI)–1981-present," Affiliation = "city name," Topic = "ecological innovation + environment innovation." To eliminate the influence of price factors, the R&D investment figure was reduced by the fixed asset price index in 2010. Similarly, the turnover of the technology market and the sales revenue of new products were reduced according to the ex-factory price index of industrial products with constant prices in 2010. Additionally, the patent authorization number was expressed by the difference between the number of patent applications and the number of patent authorizations. The environmental pollution index was calculated by the entropy weight method after normalized treatment of wastewater discharge, dust discharge, and solid waste discharge. The map resources utilized by the research were from the Standard Map Service System (http://bzdt.ch.mnr.gov.cn, 6 August 2022). Additionally, the base map was not been modified, and the spatial distribution of the green innovation ecological network was completed based on this image. Geospatial distance data between cities was vectorized using a map and then measured by geometric center distance. After the initial data set was obtained, the null, abnormal, and duplicate values were filtered and processed using SPSS software, and the green innovation efficiencies of the 286 Chinese cities were calculated using MaxDEA software. On this basis, the spatial correlation matrix of the green innovation ecological network was calculated and visualized with the support of ArcGIS 10.2. Simultaneously, features such as centrality, average distance, and microstructure were calculated using Ucinet 6.0. Thus, the spatial correlation matrix was transformed into a binary matrix with the average gravity intensity as the threshold and was characterized by only including two values: 0 and 1. The conversion rule was that if the gravity intensity of green innovation between two nodes was greater than the average value, it was judged that there was a strong correlation between the two nodes, and the gravity intensity was recorded as 1, thereby meeting the conditions of the innovation game. In contrast, when it was recorded as 0, the two cannot interact creatively. By processing the spatial correlation matrix of the green innovation ecological network, the problem that the central and western regions cannot join the game set due to the unbalanced network was effectively solved. According to the steps in Appendix A, a complex network evolutionary game algorithm was constructed in a Python 3.0 environment, and the stability and sensitivity of each player's strategy under different influencing factors were determined through parameter simulation.
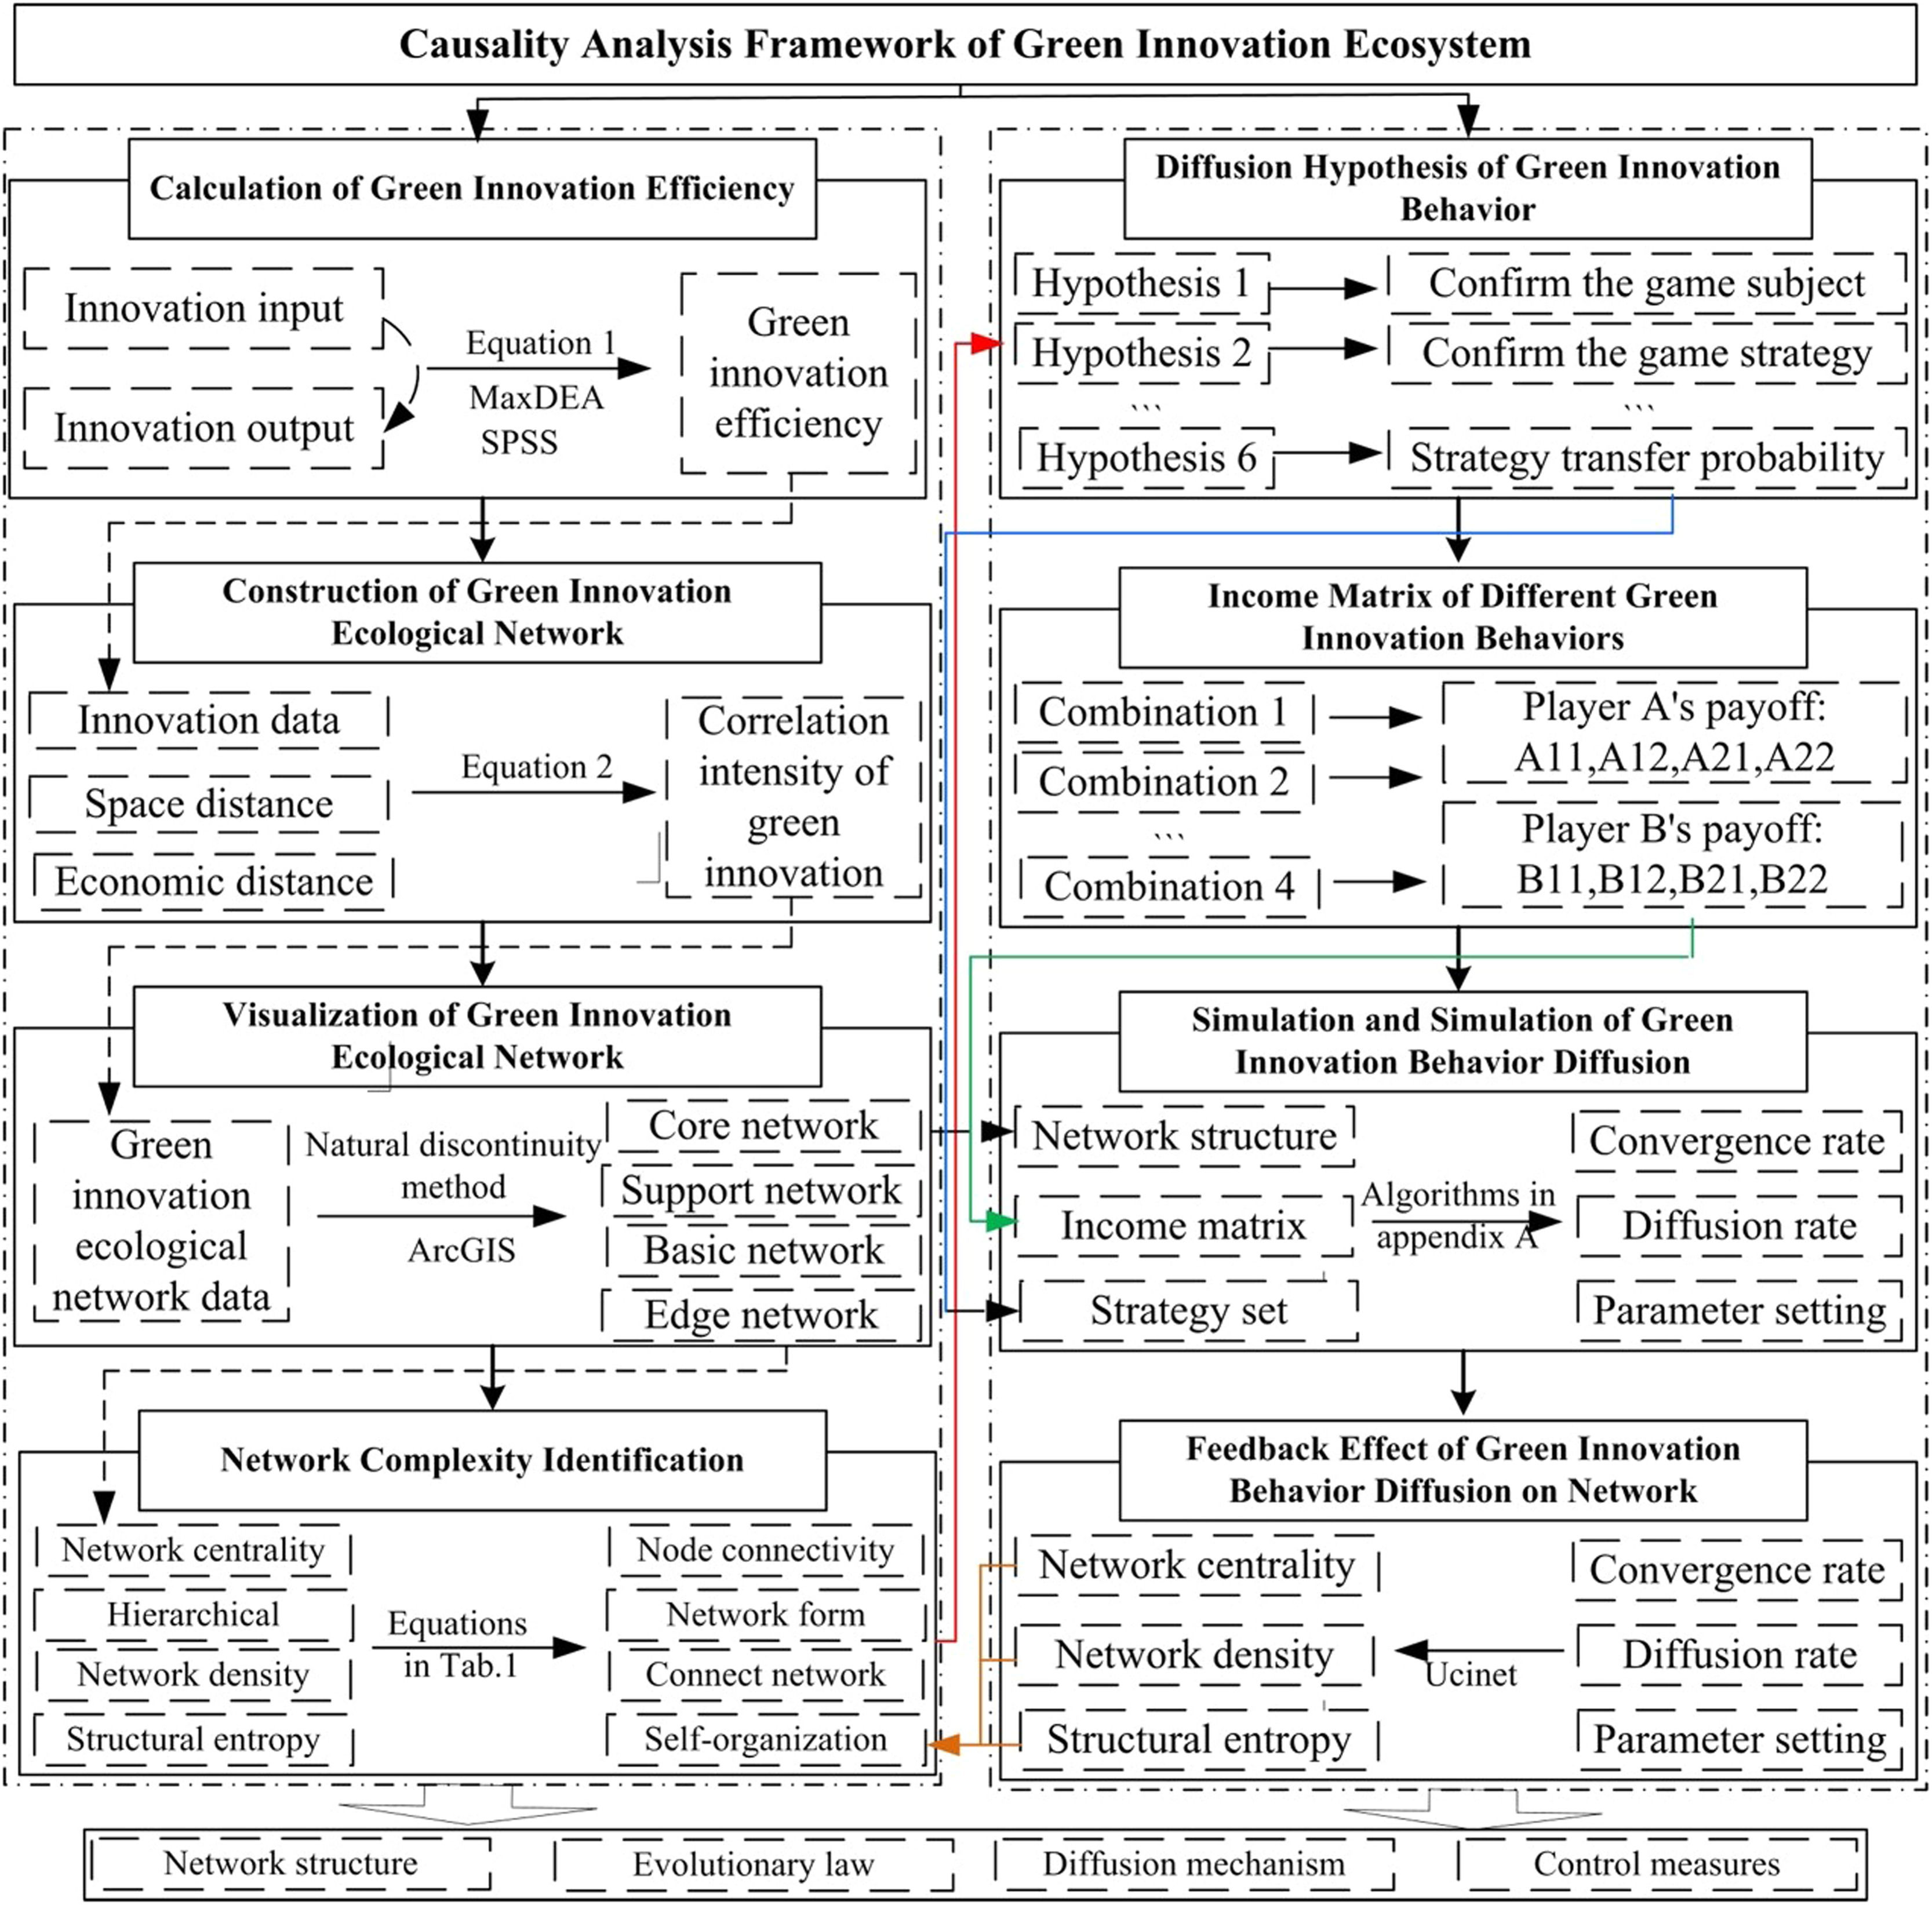
Research routeTo ensure the repeatability and verifiability of this research, the research idea, data flow, and method application process are shown in Fig. 3.

This study constructs a causal analysis framework of a green innovation ecosystem which provides a theoretical basis for the following research. On the one hand, it discusses the evolution of green innovation ecological networks and based on the input-output data of green innovation, the green innovation efficiency of each city is calculated using MaxDEA software. The calculation result is then entered into Eq. (2) as a new input to calculate the correlation strength of the green innovation ecological network. According to the correlation intensity of green innovation between cities, the green innovation ecological network is decomposed into core connection, supporting connection, basic connection, and edge connection, and also visualized using ArcGIS. Furthermore, the evolution characteristics of the network structure at the macro and micro levels are discussed. On the other hand, this study presents six basic hypotheses to explore the diffusion mechanism of green innovation behavior on the green innovation ecological network. The main body of green innovation is assumed to adopt the "positive green innovation" strategy and the "negative green innovation" strategy, and the players' income is also assumed to differ under different strategy combinations. Using the structure, strategy set, and income matrix of the green innovation ecological network as input, this paper examines the direction and degree of influence of financial subsidies, pollution tax rate, and other factors on the diffusion of green innovation behavior in green innovation ecological networks through complex network evolution game algorithm. Simultaneously, by comparing the changes in network density and the centrality of green innovation ecological network before and after simulation, the feedback effect of green innovation behavior diffusion on network structure evolution is identified, which forms a closed loop with the previous research content.
Simulation resultsAnalysis of the complexity of green ecological network structureIt is necessary to visually display and compare the structural complexity and spatial evolution pattern of an ecological network for green innovation. According to the strength of the green innovation ecological chain, it will be divided into four grades using the natural discontinuity method, namely core connection (>200,000), supporting connection (>50,000 but <200,000), basic connection (>30,000 but <50,000), and edge connection (>10,000 but <30,000). Particularly, the core connection describes the strong interaction of green innovation among cities, plays an important role in leading the evolution direction and shaping the green innovation ecological network, and shows the high-level form of the network in space. Supporting connection is a transitional form from basic connection to core connection, and reflects the strong role of the ecological chain of green innovation among cities. It also promotes the diffusion of network structure, attracts the embedding of external nodes, and shows the backbone structure of the network in space. Basic connection reflects the general interaction of green innovation among cities and is the "backbone" that supports the complexity of the ecological network structure of green innovation which is manifested as the primary network structure in space. Edge connection describes the weak connection of green innovation chains among cities, reflects the basic connection trend formed by the flow of green innovation elements, and reveals the network edge structure in space. The ArcGIS 10.2 platform was used to visualize the network structure and Fig. 4 shows the spatial distribution pattern and morphological evolution of the green innovation ecological network at different periods.
- (1)
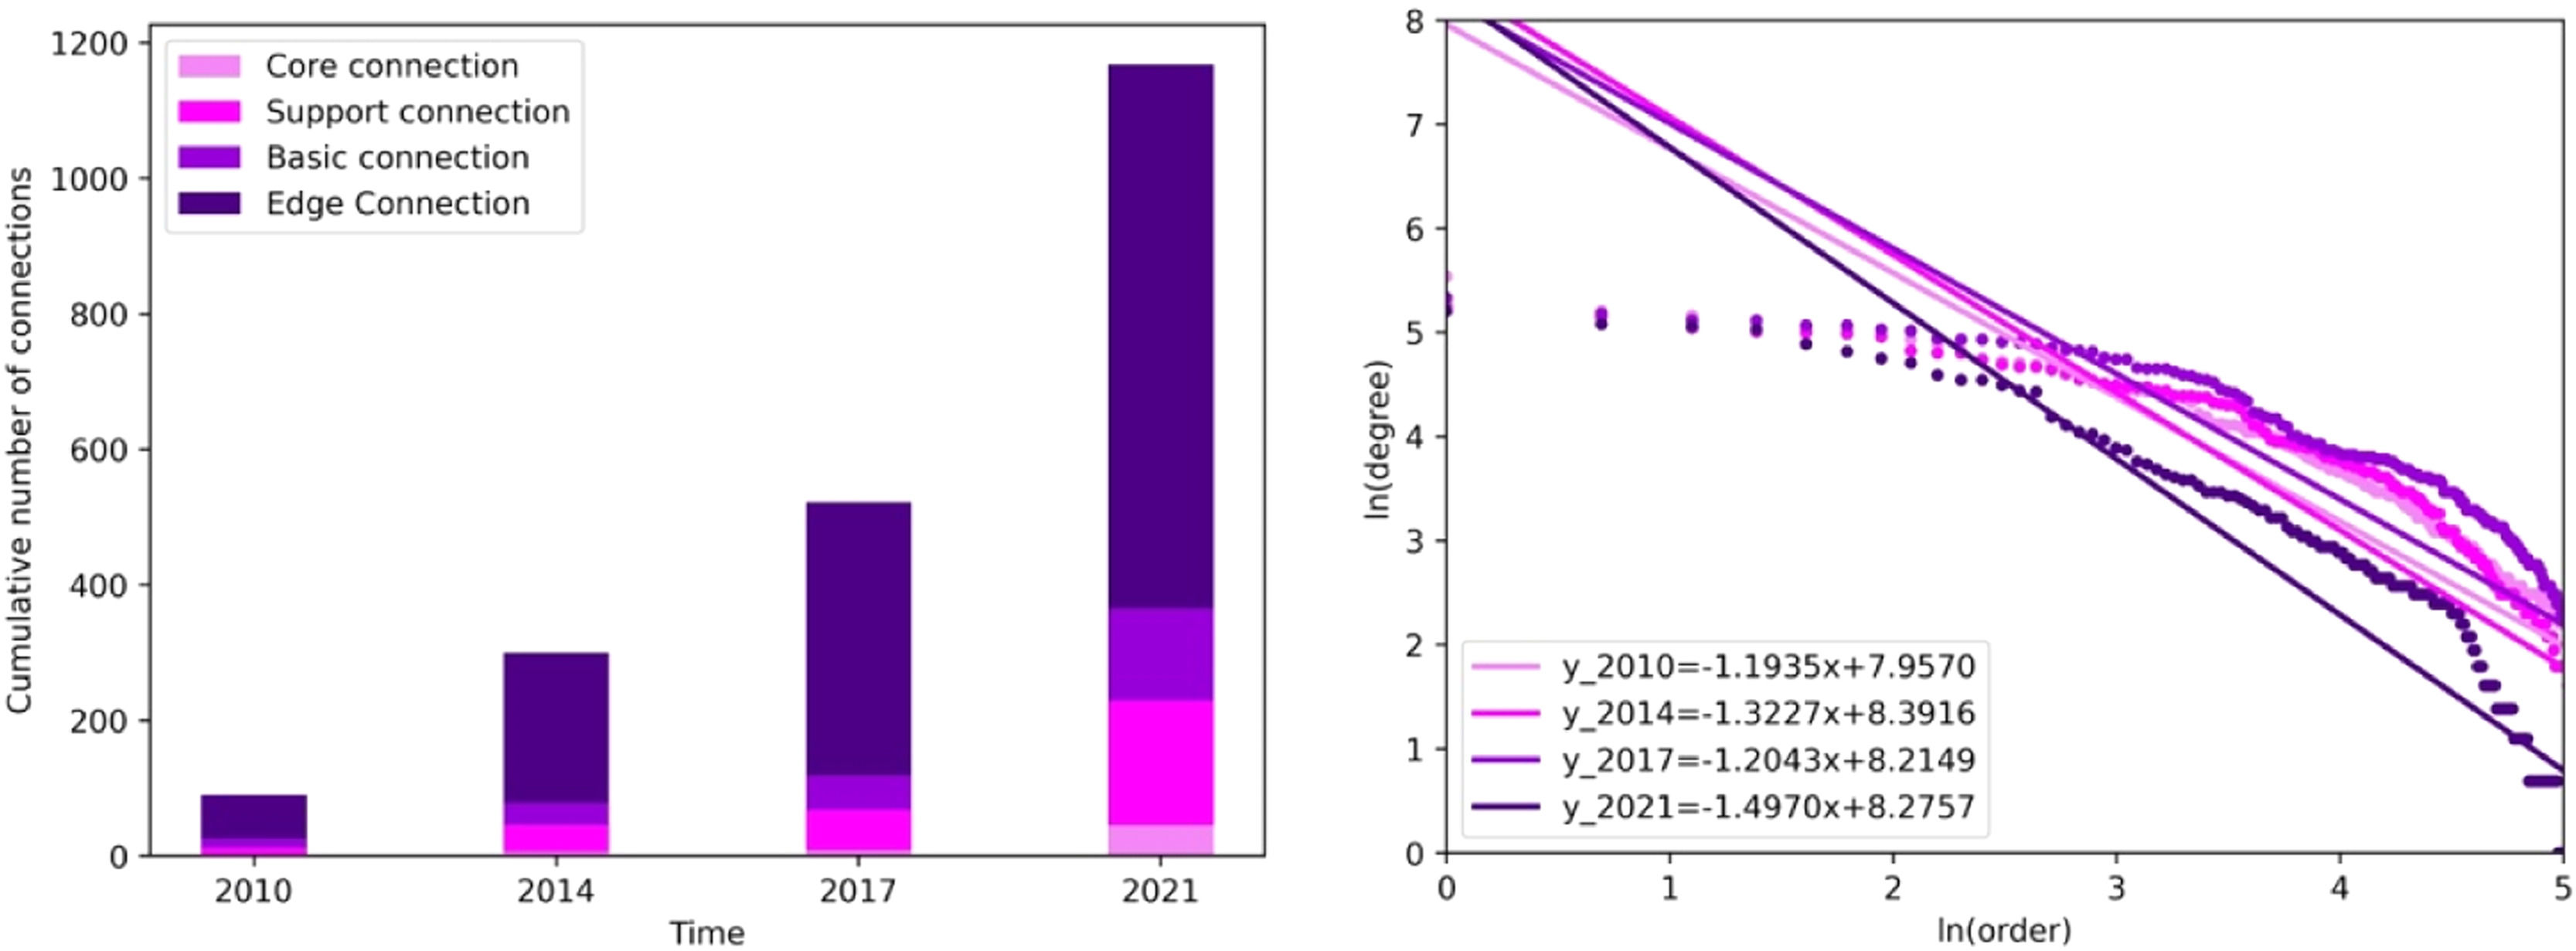
The green innovation ecological network grows rapidly, and the network density continues to increase. The network density describes the connection state of the entire green innovation ecological network, but the scale-free characteristic of the network determines that it has great differences in various thresholds, i.e., the network density is highly dependent on and sensitive to the green innovation correlation matrix. Thus, it is necessary to compare the network density under various thresholds to analyze the growth characteristics and evolution law of the green innovation ecological network. The network density is divided into M-density and S-density with the average value and supporting connection as the threshold. M-density describes the network density with the average strength of the green innovation ecological chain at each time point as the threshold. This reflects the green innovation ecological chain of the current network scale at specific time points and has the characteristics of constant scale and short-term. S-density reflects the network density with support connection as the threshold and describes the growth and development of the green innovation ecological network during the entire research period. It has the characteristics of variable scale and long-term. Fig. 4 results reveal that M-density has increased from 0.0739 in 2010 to 0.0867 in 2021, with an average annual growth rate of 1.463 %. This indicates that the green innovation ecological network has maintained a slow and stable growth trend throughout the research period, and the strength of the green innovation ecological chain has also continuously improved. Despite the increase of M-density, there remains a large number of blank connections in the green innovation ecological network, thus restricting the network's complexity. In contrast, S-density increased from 0.0003 in 2010 to 0.0867 in 2021, with an average annual growth rate of 30.482 %. It can be considered that supporting connections play important roles in promoting network evolution and accelerating the formation of extensive cooperative connections among urban nodes. From the absolute number of green innovation eco-chains, the growth rate of edge connections is much higher than that of other connection types, which shows that the growth vitality of green innovation ecological networks is primarily concentrated on edge connections, while the growth of core connections is relatively slow. Although this phenomenon is necessary to maintain the outward extension of the whole network, its effect on the evolution of network morphology is limited.
- (2)
The green innovation ecological network has dual imbalances of time and space distribution and hierarchical structure. Seen from the spatial distribution perspective, the green innovation ecological network in 2010 is sparse, and only a few green innovation ecological chains exist in the Yangtze River Delta and the Pearl River Delta urban agglomerations, and the Beijing-Tianjin-Hebei region. The Yangtze River Delta urban agglomeration gradually developed a network structure system containing various types of green innovation ecological chains, which then spread to the Beijing-Tianjin-Hebei region and the Pearl River Delta urban agglomeration. A large number of long-range connections have begun to emerge, indicating that the preference for attachments between urban nodes has somewhat overcome the constraint of geographic distance. As a result, it is becoming easier to form core connections within the network, but simultaneously, the nodes on the edge of the network and those that have not yet joined will be more isolated (this result is more obvious in the spatial distribution in 2021). The green ecological network of innovation began to spread to China's western region in 2017. Apart from the closer connection between the previously discussed three urban agglomerations, they also began to form basic connections with central cities in the west such as Chengdu and Chongqing. By 2021, a "diamond-shaped" morphological structure with the Beijing-Tianjin-Hebei region, Yangtze River Delta urban agglomeration, Pearl River Delta urban agglomeration, and Chengdu-Chongqing region as its apex had formed. Simultaneously, the Beijing-Tianjin-Hebei region began to establish supporting connections with the central cities in northeast China. However, this has not completely changed the spatial imbalance of the network, thus, the green innovation ecological network in the eastern coastal areas of China remains superior to that in the western areas and will remain so. Additionally, in Appendix B, we report the spatial clustering characteristics of gravity intensity in green innovation, which can provide more evidence regarding this discussion from different perspectives.
- (1)

Fig. 5 shows the fitting of the cumulative quantity of various green innovation ecological chains with hierarchical coefficients (The data processing and testing process of hierarchical coefficient fitting is reported in detail in Appendix C). The distribution type of green eco-chains is shaped like a pyramid, with edge connections accounting for the majority, and the number increasing greatly. The proportion of basic connections and supporting connections is relatively balanced and stable, and the number of core connections is low. This result more intuitively confirms that edge connections are the primary driving force for the density growth of this green innovation ecological network. The absolute value of the hierarchical fitting coefficient of the innovative ecological network fluctuates near 1.300, and the overall connectivity gap of urban nodes remains relatively stable, but the network may risk structural rigidity and path locking. Additionally, it is noteworthy that there is a significant and steep inflection point between the first and second sections of the scatter plot distribution sequence. This potentially means that the connectivity of some sample cities has diverged, and the cities at the end of the sequence gradually become "marginal groups" in the green innovation ecological network.

Spatial imbalance and hierarchical structure are the basic characteristics of an ecological network for green innovation and are the result of multiple factors. Geographical advantages and policy planning have created a favorable innovation environment in China's eastern coastal areas, as well as scientific and efficient modes of organization and management. This provides strong support for inter-city green innovation technology cooperation, knowledge transfer, and value addition. Various advantages have synergistically promoted the eastern coastal areas to become the most mature areas for green innovation ecological network development. In contrast, China's central and western regions are not prominent in terms of location and industrial advantages, and the leading industries there are primarily secondary industries. This is especially true in terms of green innovation input, which is far behind the eastern coastal areas. The lack of accurate policy support and the weak spillover effect of core cities have also become bottlenecks in the expansion of the ecological network for green innovation into the central and western regions.
(3) The green innovation ecological network has a diversified local network structure. These networks evolve in a continuous process with an iterative evolution trend. The self-organization effect and self-similarity characteristics are microscopic descriptions of the ecology of this network. Additionally, the green ecological network has formed the staggered distribution patterns of "Point-axis," "Radial," and "N-tuple" in space. These diversified local network architectures have increased the complexity of the overall network structure. Point-axis distribution describes the single-line connection between urban nodes and is the initial stage of the formation of an ecological green innovation network. Examples include Shanghai and Shenzhen in 2010, Tianjin and Beijing in 2010, etc. By comparing different time points, it can be seen that Point-axis distribution is the basic form of evolution toward more complex network structures, especially in the case of long-range connections. As the green innovation chain between cities continues to strengthen, it gradually forms a single-core radial network structure centered on key cities or provincial capitals and whose essence is the intersection of multiple Point-axis distributions. This provides an opportunity to play the spillover effect and demonstration role of the core cities and helps more nodes become embedded in the local network. Simultaneously, this distribution type also has a greater risk of network cascading. Since the economic model of urban agglomeration is widely developed in China, a multi-core innovation network (N-tuple distribution) characterized by regionally distributed innovation begins to form. Its structure usually includes several central cities and many neighboring cities, such as the Beijing-Tianjin-Hebei network structure with Beijing and Tianjin as the core, and the Yangtze River Delta network system with Shanghai, Nanjing, and Hangzhou as its centers.
Table 4 statistics reveal the number of special microstructures formed by the self-organization effect of nodes in the green innovation ecological network. Type A describes a typical Point-axis microstructure, in which the nodes are primarily connected by single wires. Type B shows the ubiquitous structural holes in complex networks; that is, the middle node provides a bridge for two isolated nodes. Type C is a complete and idealized network structure, which means that the nodes form a closed-loop cooperation chain. During the research period, the number of all microstructure types increased to varying degrees, with the largest increase being Type C, at 61.428 %. Additionally, it can be seen that the local evolution of a green innovation ecological network tends to gather in small communities and provides a search path for green innovation subjects to locate potential partners.
Game simulation and sensitivity analysis of green ecological network evolution


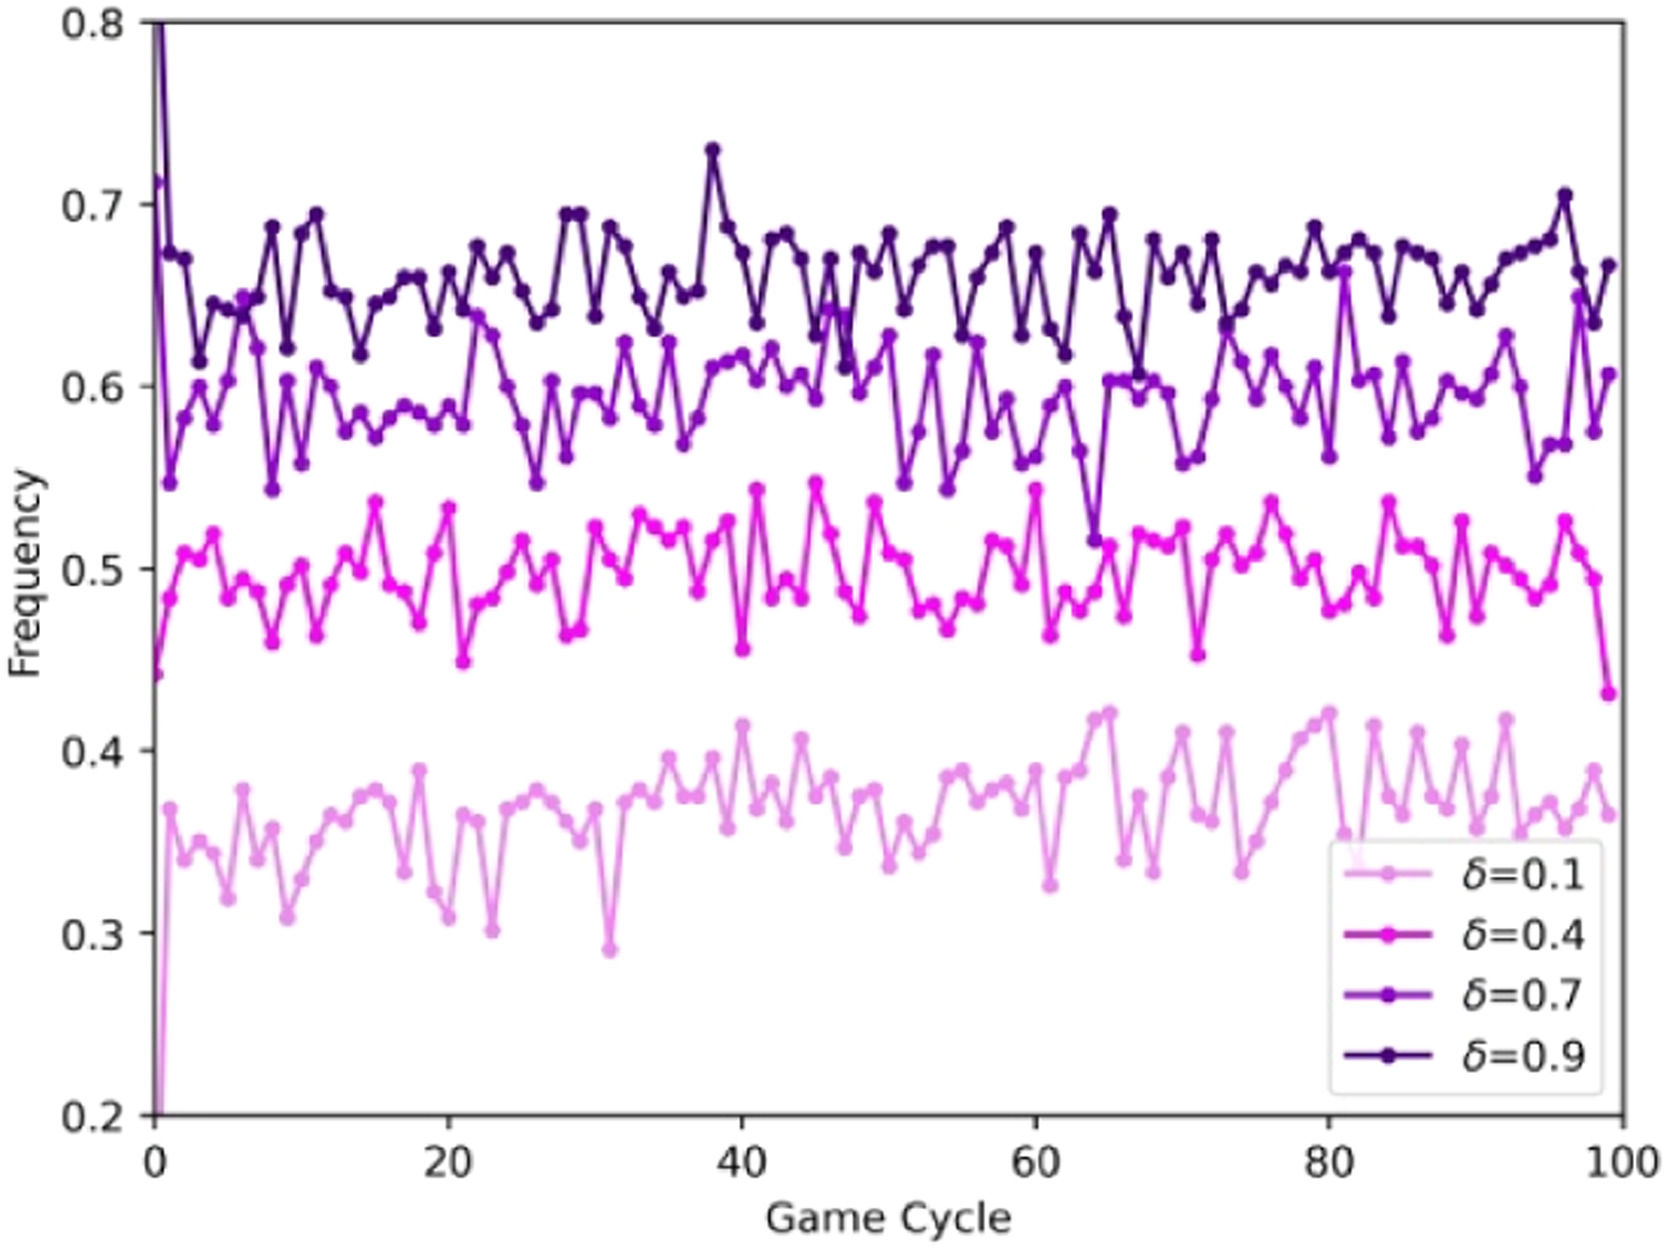
The green innovation ecological network in 2021 is used as the simulation starting point and the same 0–1 matrix as the S-density calculation is adopted. The algorithm in Appendix A is realized using the Python language, and the appropriate game initial value (δ=0.5,ΔR=30,R1=120,R2=100,P=20,G=30,T=0.15,Q1=80,Q2=100,B1=B2=60) and game cycle (M=100) are determined by multiple simulations. Figs. 5 and 6 depict the sensitivity of the diffusion path of the {positive green innovation} strategy in the network to the initial strategy ratio (δ), cooperative innovation profit (ΔR), default cost (P), financial subsidy (G), and pollution tax rate (T), respectively. Table 4 counts the changes of network characteristic indicators to identify the feedback effect of game strategy learning or imitation on the macro network. The concepts of diffusion depth and diffusion breadth are presented to describe the characteristics of the diffusion path of the {positive green innovation} strategy. Diffusion depth describes the time required for the {positive green innovation} strategy to spread in the network and reach stability. The smaller its value, the stronger the player's learning and imitation ability and the stronger the convergence of the diffusion curve. Diffusion breadth refers to the proportion of strategy diffusion when it reaches stability, which reflects the leading direction of strategy learning and imitation of green innovation subjects. The greater the value, the greater the acceptance of the {positive green innovation} strategy among players, and the greater the robustness of the diffusion curve.

The strategy initial proportion refers to the proportion of players who adopt the {positive green innovation} strategy at the beginning of the simulation and reflects the different stages of development of the green innovation ecosystem from the side. Fig. 6 shows that the initial strategy proportion has almost no influence on the diffusion depth of the {positive green innovation} strategy in the green innovation ecological network, but does determine the convergence position of the strategic diffusion curve. Specifically, regardless of what type of initial proportion of game strategy is chosen, the complete diffusion of the {positive green innovation} strategy cannot be realized, and the curve will eventually be stable in the range of [0.3,0.7]. This presents a "gradient" distribution with an increasing initial strategy proportion. Furthermore, fundamental characteristics of the innovative ecological network provide explanatory evidence for this result. On the one hand, the preference attachment and scale-free characteristics of the network lead to the isolation of edge nodes, which usually reveal the lack of endogenous motivation and external support for green innovation and eventually fall into the trap of the "Matthew Effect." These nodes are in the position of "vulnerable groups" in the evolution game of green innovation ecological network, that is, the connection relationship is simple and the game profit is low. On the other hand, the "disconnection and reconnection" mechanism in Assumption 6 restricts the search path for edge nodes to form new connections and reduces the probability of forming structural holes and the possibility of connecting such nodes with high-yield nodes, thus causing the curve of the {positive green innovation} strategy to fail to achieve complete diffusion.
When the initial strategy ratio is high, the downward convergence of the strategic diffusion curve attracts our attention. The realistic meaning of this result is that when the proportion of the initial strategy increases, some nodes will give up on the {positive green innovation} strategy. Although this situation is unexpected, we believe it is reasonable and provide two possible explanations. It is emphasized that the subject of green innovation is an individual with limited rationality, and the players can only make strategic choices based on the current conditions (current profit and strategies of some players). This differs from the assumption of rational people in economics in that they only pursue satisfactory solutions, that is, they only need to meet the current need. Therefore, we believe that this situation is the result of the nonlinear effect of the green innovation ecosystem, influenced by many factors such as the green innovation ecosystem network, strategy selection, game profits, and the emergence of system complexity. Comparatively, we believe the second explanation is simpler and more reasonable. The difference between the initial strategy ratio and the curve convergence ratio can be regarded as a "virtual ratio interval (Δξ)," that is, when the initial game strategy is set, Δξ of the green innovation subjects are provided the {positive green innovation} strategy. However, after the start of the game cycle, these players abandoned the original strategy under the influence of profit and network connections, leading to the decline of the diffusion curve of the {positive green innovation} strategy.
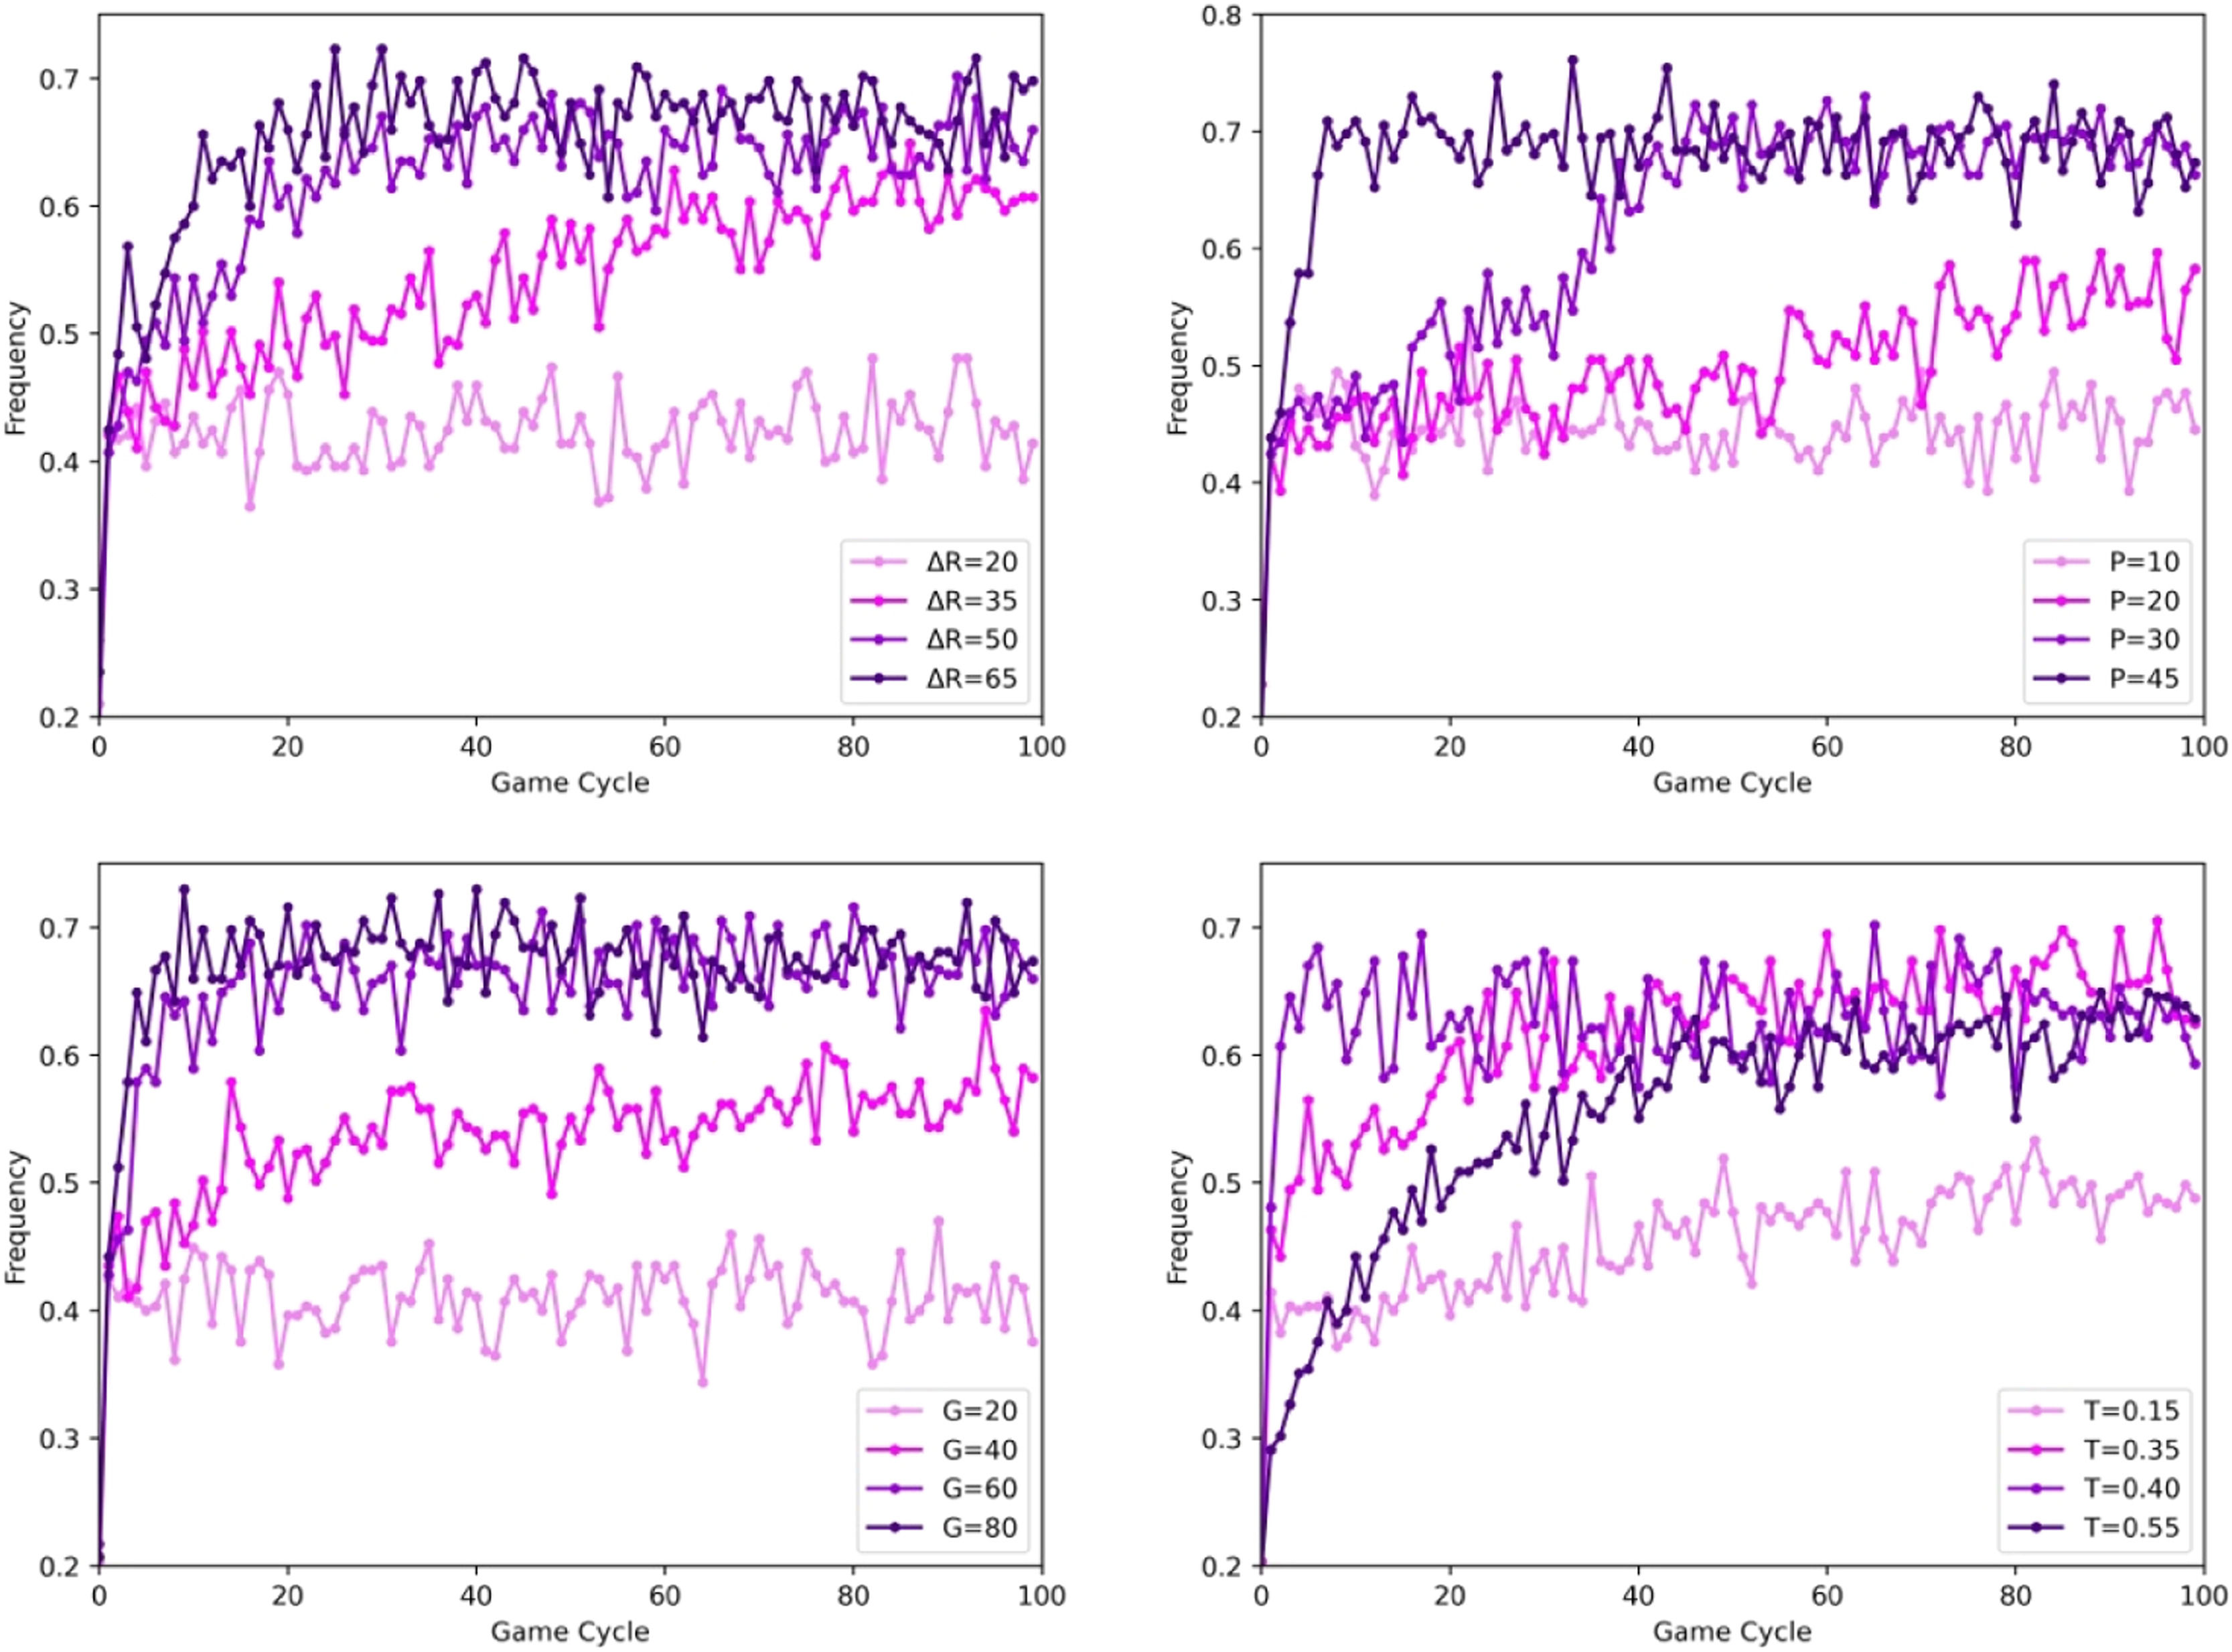
Fig. 7 shows the simulation results of the influence of cooperative innovation income, default cost, financial subsidy, and pollution tax rate on the diffusion of green innovation behavior. Cooperation innovation profit refers to excess profits obtained by players through green technology, cooperation, knowledge sharing, etc. With the continuous increase in cooperative innovation profits, the diffusion curve of the {positive green innovation} strategy began to shift upward and the diffusion breadth gradually increased. This demonstrates that the additional profits resulting from green cooperative innovation prompted more innovative subjects to prefer the {positive green innovation} strategy, and the higher the additional profits, the stronger the attractive effect. These results confirm the correctness of the prior research conclusions of Barile et al. (2022) and Irfan et al. (2022). When ΔR>35, the diffusion depth reaches its maximum, and the diffusion curve tends to gradually stabilize after 60 cycles of the game. Comparing ΔR=50 with ΔR=65, it can be observed that both curves are stable at around 0.7 and the coincidence rate is high, thus indicating that the promotion effect of cooperative innovation profit on the diffusion of the {positive green innovation} strategy appears to be a marginal decline.

The cost of breach of contract refers to the opportunity cost paid by both partners when there is betrayal. Usually, the betrayer can obtain the relevant resources of the partner through knowledge sharing and technical alliance, but this behavior will also pay the price associated with breaches of contract. The simulation results reveal that the diffusion curve of the {positive green innovation} strategy is highly sensitive to the default cost. With increasing default costs, the diffusion curve moves rapidly to the upper left, and the diffusion breadth continues increasing, while the diffusion depth decreases. Its practical significance is that the {positive green innovation} strategy is imitated by more and more players, and the cost of a breach of contract makes partners more loyal to their partners. Similar to the profits associated with cooperative innovation, there is a large time gap between the two curves inP=35andP=45, where they are all stable in the same range. This demonstrates that when the cost of breach of contract is much higher than the profits of betrayal, the player will choose a more reliable strategy.
Fiscal subsidy usually refers to the financial support provided by a government to green innovation subjects through policy support. This includes green finance, green loans, and subsidies for innovation and entrepreneurship. From the simulation results, it can be seen that the diffusion curve of the {positive green innovation} strategy moves upward with increasing financial subsidies, and the diffusion breadth is improved, while the diffusion depth changes little. Fiscal subsidies can effectively alleviate the cost pressure on green innovation subjects, reduce the risk of innovation failure and capital chain breakage, and increase the enthusiasm of innovation subjects. This is consistent with the research conclusions of Zhang et al. (2022a) and Farooq et al. (2024). Notably, when G=60, this pushing effect also begins to show a diminishing marginal effect.
The pollution tax rate is the emission tax levied by the government on carbon emissions, pollutants, and other harmful substances that are released into the environment, and reflects the intensity of government environmental regulation. With increasing pollution tax rates, the diffusion breadth of the {positive green innovation} strategy continues to increase and indicates that environmental regulation measures somewhat stimulate the green innovation behavior of game participants. However, comparing the curves reveals that although the convergence position of the diffusion curve is similar to the results of other policies, here the diffusion depth experiences a process of first increasing and then decreasing. Therefore, an appropriate environmental regulation intensity can provide more opportunities for the diffusion of the {positive green innovation} strategy, while an excessive pollution tax rate will generate negative effects. The increase in the pollution tax rate also increases the innovation cost of green innovation subjects and brings more uncertainty and risk to innovation behavior. Therefore, based on bounded rationality, players must decide whether to learn other players’ strategies, thus prolonging the convergence time of the curve.
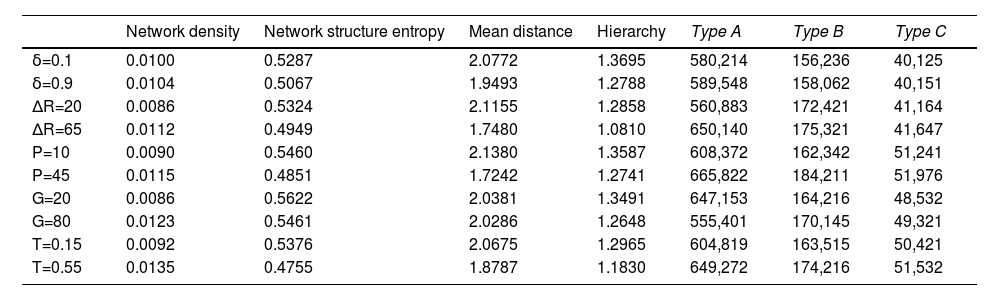
Based on the comparative analysis in Table 5, the feedback effect of green innovation subject strategy learning on the green innovation ecological network can be considered to reflect the following three attributes. (1) The default cost and pollution tax rate hasten the establishment and reconstruction of a green innovation network for the environment. A 35 % increase in default cost can promote the decrease of network density, network structure entropy, average distance, and network hierarchy by −27.778 %, 11.154 %, 19.355 %, and 6.227 %, respectively. Similarly, the sewage tax rate increased by 0.4, and all indicators changed by −46.739 %, 11.551 %, 9.132 %, and 8.754 %. Both the default cost and the pollution tax rate have led to an increase in green innovation costs and risks. Cross-regional collaborative innovation has become an important way to minimize risks and improve efficiency. The quantitative changes in the three microstructure types prove the increased complexity of the structure of an ecological network for green innovation. (2) The cooperative innovation profit positively affects the structural order of the network, and its promoting effect on network density is second only to the default cost and sewage tax rate. Here, the collaborative innovation profit increased by 45 %, the network density increased by 30.233 %, and the network hierarchy decreased by 15.928 %. Cooperative innovation cannot only enhance the flow of green innovation elements among regions and improve the efficiency of factor allocation but can also provide favorable conditions for narrowing the gap in green innovation among regions. (3) The initial strategy proportion and fiscal subsidy have limited influence on the green innovation ecological network. Although the initial strategy proportion will affect the diffusion of the {positive green innovation} strategy in the green innovation ecological network and the convergence of the diffusion curve, it lacks a strong influence on the overall network characteristics through the green innovation subject. Yet, the financial subsidy's influence on the green innovation ecological network is primarily reflected in the minor change in network structure entropy.
Comparison of characteristic indexes of green innovation ecological network after simulation.
Green innovation is no longer limited to organizations or individuals but is reflected in the interactions and couplings of innovation ecosystems. China has yet to fully establish a natural green innovation ecosystem but has an incomplete green innovation ecosystem guided by policies and plans. This study focuses on the evolution of green innovation ecosystems, summarizes the OTEMC structural paradigm, and presents a causal analysis framework for the evolution of green innovation ecosystems. It also constructs an evolutionary game algorithm based on the green innovation ecological network to discuss the diffusion law of green innovation behavior, which has certain theoretical significance for enriching the innovation management framework and related theoretical methods of system engineering. Additionally, the influence direction and degrees of pollution tax rate, cooperative innovation profit, and financial subsidy on the diffusion of innovation behavior in the network are examined through simulation, thereby providing decision support for management departments and innovative enterprises to adopt appropriate green innovation strategies. Based on the research findings, this paper presents the following targeted suggestions.
- (1)
Considering the provincial capitals or central cities in the central and western regions of China as strategic support points, focusing on planning and the layout of green technology innovation bases, such as new functional materials, new energy, hydrogen storage technology, and carbon capture and storage, encourages talents, capital, and other green innovation elements to gather in the region and accelerate the cultivation of independent innovation capabilities of core technologies. Additionally, this provides full play to the innovation spillover effect of core cities such as Chongqing, Chengdu, and Wuhan, promotes the growth of green innovation networks in the central and western regions, and fills the "network structure depression" in Yunnan and Guizhou.
- (2)
Provide full play to the complementary roles of different types of green innovation subjects to improve the overall regional green innovation efficiency, release the green independent innovation potential of innovation subjects, encourage large-scale scientific research institutions and universities to focus on breakthroughs in green innovation system, management system, and mechanism, and frontier basic fields. Additionally, fully recognize the sensitive advantages of enterprises related to market demand and improve the efficiency and profitability of technological transformation. Using China's eastern coastal areas as a springboard, aim at the forefront of international green innovation, actively seek international cooperation and innovation, and promote China's niche in the global green innovation ecosystem.
- (3)
Strengthen the facilitating role and service awareness of local governments in building a green innovation ecosystem and reduce the risks associated with green innovation failure and integrity through government scientific and technological innovation subsidies, green finance, innovation funds, and other policy measures to enhance the enthusiasm of enterprises for green collaborative innovation. By strengthening the stimulation of carbon taxes, pollution taxes, and other environmental regulation measures for innovation subjects, a good green innovation environment will be created.
The regional green innovation ecosystem is a giant, open, and complex system formed by green innovation cooperation among cities, and is deeply rooted in society, the economy, and the ecosystem. This study combines and summarizes the basic characteristics of various innovation ecosystems, the OETMC structural paradigm of innovation ecosystems, and under the guidance of this paradigm forms a causal analysis framework of green innovation ecosystem evolution. This is based on the behavior of green innovation subjects, supported by green innovation efficiency, and aimed at a green innovation ecological network. Based on the analysis framework, a green innovation ecological network with green innovation efficiency as the core index was constructed by selecting the relevant data of 286 Chinese cities from 2010 to 2021, and the diffusion process and sensitivity of a "positive green innovation" strategy in the green innovation ecological network were examined and discussed. The primary conclusions are as follows.
- (1)
The maturity and complexity of the green innovation ecological network have been significantly improved, and the network density has been continuously improved. However, both M-density and S-density remain at low levels and there are always large numbers of blank connections. These are the key constraints hindering the evolution of the network structure and simultaneously lead to the double imbalance of the spatial-temporal distribution and hierarchical structure of the green innovation ecological network. Although the emergence of a large number of long-range connections means that the geospatial distance constraint is weakened, it also slows the embedding of edge nodes. Additionally, it is notable that this green innovation ecological network has formed a pattern of "Point-axis," "Radial," and "N-tuple" staggered and coexisting locally.
- (2)
The initial strategy proportion determines the convergence position of the diffusion path of the {positive green innovation} strategy in the green innovation ecological network. However, due to the existence of network preference attachment, power law distribution characteristics, and the problem of "virtual proportion interval," regardless of what the initial strategy proportion takes, the complete diffusion of the {positive green innovation} strategy cannot be realized. With the increase of cooperation innovation profit, default cost, and financial subsidy, the diffusion path of the {positive green innovation} strategy moves upward, and the marginal utility decreases with the increase in simulation value. Pollution tax rates have "duality," meaning that while appropriate environmental regulations can encourage green innovation subjects to adopt a "positive green innovation" strategy, an excessive pollution tax rate will cost innovation subjects more.
- (3)
The default cost and pollution tax rate have accelerated the formation and reconstruction of a green innovation ecological network, and its operational mode involves increasing the opportunity cost of green innovation subjects to maintain their enthusiasm for cooperation. The feedback effect of cooperative innovation profit on the green innovation ecosystem is primarily reflected in reducing the shortest average distance within the network, which provides conditions for narrowing the gap in green innovation among regions. Notably, the initial strategy proportion and financial subsidy have limited influence on the microstructure of the green innovation ecological network.
This study aims to reveal the diffusion law of green innovation subject behavior strategy in complex networks, simulate the diffusion process by constructing a complex network evolution game model based on green innovation ecological network, and obtain enlightening results. Including the local spatial pattern of "dot-axis," "radial," and "N-tuple," the strategy of "positive green innovation" cannot achieve complete convergence under any initial strategy proportion, and the influence of pollution tax rate on " positive green innovation" strategy is dual. These results provide a reference for management departments to formulate scientific control measures and also help innovative enterprises adopt appropriate development strategies to improve resource utilization efficiency and reduce innovation risks.
Compared with the existing research, this study presents a new perspective on the evolution of the microstructure of the green innovation ecological network and reveals its stage characteristics from "Point-axis" to "N-tuple" and from simple structure to complex structure. This result supplements the research conclusions of Zhang et al. (2023) and Xu et al. (2022) on the evolution of green innovation ecological networks. However, the result that the strategy of "positive green innovation" has not achieved complete convergence is inconsistent with the findings of Ramkumar et al. (2022) due to different model settings. When we built this model, we chose to use the real green innovation ecological network instead of a randomly generated virtual network. Thus, more node characteristics and network attributes are included in the present model. Comparatively, the research results of this paper are closer to reality. The impact of the pollution tax rate on green innovation is usually verified using an econometric model in existing research. However, we use the game model of complex network evolution to test the influence of its pollution tax rate on green innovation behavior. This generated a result that is almost consistent with Teng et al. (2022) and provides a new method and tool for subsequent research.
Although some enlightening conclusions have been made in this paper, the following limitations remain. Firstly, for the problem that the diffusion path of the {positive green innovation} strategy in the network cannot converge completely at any initial strategy ratio, we believe that this is an intuitive manifestation of the nonlinearity of complex systems, and therefore it is worth further examining its causes. Secondly, when establishing simulation parameters, all green innovation agents have the same attributes by default, but the model we built can completely simulate the game relationship between different types of green innovation agents by adjusting parameters. Thus, setting differentiated basic profit levels, for example, can simulate the game relationship between core enterprises and general enterprises. Finally, this study believes that future research should focus on the interaction between different types of innovation subjects and the linkage effects of the macro-evolution direction of green innovation ecology. This may be an effective way to combine complex network theory with an econometric model to further explore this issue.
CRediT authorship contribution statementRen-Jie Zhang: Writing – original draft, Visualization, Software, Methodology. Hsing-Wei Tai: Writing – review & editing, Supervision, Investigation. Zheng-Xu Cao: Writing – review & editing. Chia-Chen Wei: Writing – review & editing, Resources. Kuo-Tai Cheng: Supervision, Formal analysis.
This work was partly supported by the National Social Science Foundation [grant numbers 19BJY085] and Shandong Science Foundation [grant numbers ZR2020MG015]. Any opinions, findings, conclusions, and recommendations expressed in this paper are those of the authors.