


Applying complexity theory tenets in analyzing findings from prior research on the impacts of democracy and authoritarianism on countries’ quality-of-life and happiness inform answering this question accurately. The study here constructs and empirically tests algorithms on how democracy and authoritarianism impact QOL and happiness. The propositions include the following views. First, full democracy (D) is necessary but insufficient in indicating high QOL and high happiness. The research findings in the present study support this first proposition. Second, full authoritarianism is a necessary condition but its insufficient for indicating nations’ outcome conditions of high Gini index (Gini), low ethical behavior (∼E), and low GDPppp (i.e., ∼GDPppp). The findings support a revision to this second proposition: full authoritarianism is sufficient for indicating each of these three outcome conditions. Third, (a) nations having high QOL are high in happiness (H) consistently, (b) even though as variables QOL and H do not exhibit a symmetrical relationship (i.e., some nations having low QOL have high H). This study supports the perspectives that applying complexity theory tenets and asymmetric case-level outcome algorithms are useful for generalizable theory construction, empirical confirmation, and insightful information for enacting national policies that will increase national QOL and happiness.
Scientists’ tools are not neutral. (Gigerenzer, 1991: 254)
Gigerenzer's (1991) insight supports the blending of theory construction and tools in-use for data analysis explicitly. Behavioral scientists usually do not include examining the validity of tools they use in their empirical work (i.e., these tools mainly include matrix algebra based symmetric analytics such as correlation and multiple regression analyses) when constructing theory, analyzing data, and writing papers. The present study includes a brief examination of tools in contributing to the current strenuous attempts (e.g., Amrhein et al. 2019, Armstrong 2012, Hubbard 2015, McCloskey 2002, Meehl, 1978, Trafimow and Marks 2015, Wasserstein and Lazar 2016, Woodside 2013, 2020, Ziliak and McClosky 2008) championing discarding symmetric theory and the use of null hypothesis significance testing (NHST)—even though the use of these tools for constructing theory and analyzing data is still pervasive today in economics, the behavioral sciences, and public administration.
The present study contributes useful theory and empirical findings in public administration in response to Zhu et al.’s (2019: 287) “need for a rigorous methodological pluralism in public administration where the methods used need to match the substantive questions asked.” The current pervasive mismatch in the relevant literature between (case-based discrete conditions) theory construction and variable directional relationships (VDR) empirical testing is an interdisciplinary pandemic still raging across disciplines, for example, economics (Ziliak & McCloskey, 2008), management (Fiss, 2007), psychology (McClelland, 1998), as well as public administration (Gill & Meier, 2000). The study here contributes by demonstrating how to replace the mismatch between theory construction and empirical testing in public administration research and theory; the study matches case-based theory construction with case-based empirical testing tools and shifts thinking from symmetric XY linear relationships to constructing asymmetric algorithms (AKA, screens) that accurately indicate specific point or interval outcomes. This present study's principal focus is on democracy's sustainable role in nurturing ethical behavior and GDPppp as well as reducing income inequality as steps for achieving national high quality-of-life and happiness. However, the study briefly describes why and how to discard the bad science practices of symmetric theory construction and NHST for improving theory construction and data analysis including applications of complexity theory tenets.
IntroductionGlobally, some of the conditions identifying “full democracy” include supporting political and social equality across a nation's subcultures (e.g., 1964 U.S. Civil Rights Act, and the 1965 U.S. Voting Rights Act), nurturing acceptance of women in positions of leadership and eliminating income and benefits gaps due to gender (i.e., “gender mainstreaming” in Nordic nations), enacting effective laws and protection agencies charged with discouraging corruption, limiting income inequality, providing access for all to effective medical care, and accepting religious freedom and tolerance. For the definition of “full adhocracy nation” replace the gerunds in the prior sentence with their opposites—for example, “restricting political equality.” Gerunds indicate goals and promises but not necessarily accomplishments. For example, “Not until the 1964 Civil Rights Act and the 1965 Voting Rights Act can the United States be said to have met the basic conditions for political equality requisite in a democracy. All the same, measured not against its past but against its contemporaries, American democracy in the twenty-first century is withering. In 2016, the [Democracy] index for the first time rated the United States a ‘flawed democracy’ and since then American democracy has gotten only more flawed” (Lepore, 2020: 21). In 2021 following the listing of 61 other nations in democracy categories A to F, the Peace Worldwide Organization (PWO, 2021) lists the United States in the “lacking democracy” (LD) category—along with 20 other LD nations (PWO, 2021).
The present study proposes a general theory of democracy/authoritarianism blooming/withering of seeds (i.e., conditions) necessary for sustaining high national quality-of-life (QOL) and happiness (H). The study includes systematic empirical evidence that partially-to-fully support the core tenets of the theory. This general theory contributes by describing how applications of complexity theory tenets and asymmetric, accurate case (i.e., nations) outcome modeling (“ACOM”, Woodside 2019) enriches knowledge on why and how to embrace democracy and wilt authoritarianism. Rather than propose and test variable directional relationships (VDRs), the present study proposes and examines point and interval estimates of if and how full democracy nations achieve QOL and H. “QOL” in this study refers to a membership condition, for example, “high QOL” cases (i.e., nations in the top quintile or top decile among all nations tested for democracy. (High) QOL is a condition and not a variable in this study. The sideways tilde (“∼) indicates negation. “∼QOL” refers to the negation of QOL. “H” refers to “high happiness” and not to H as a variable. “∼H” refers to high unhappiness (i.e., the negation of H). The study here examines if single and complex antecedent conditions are accurate in indicating high membership in single condition or complex outcome conditions.
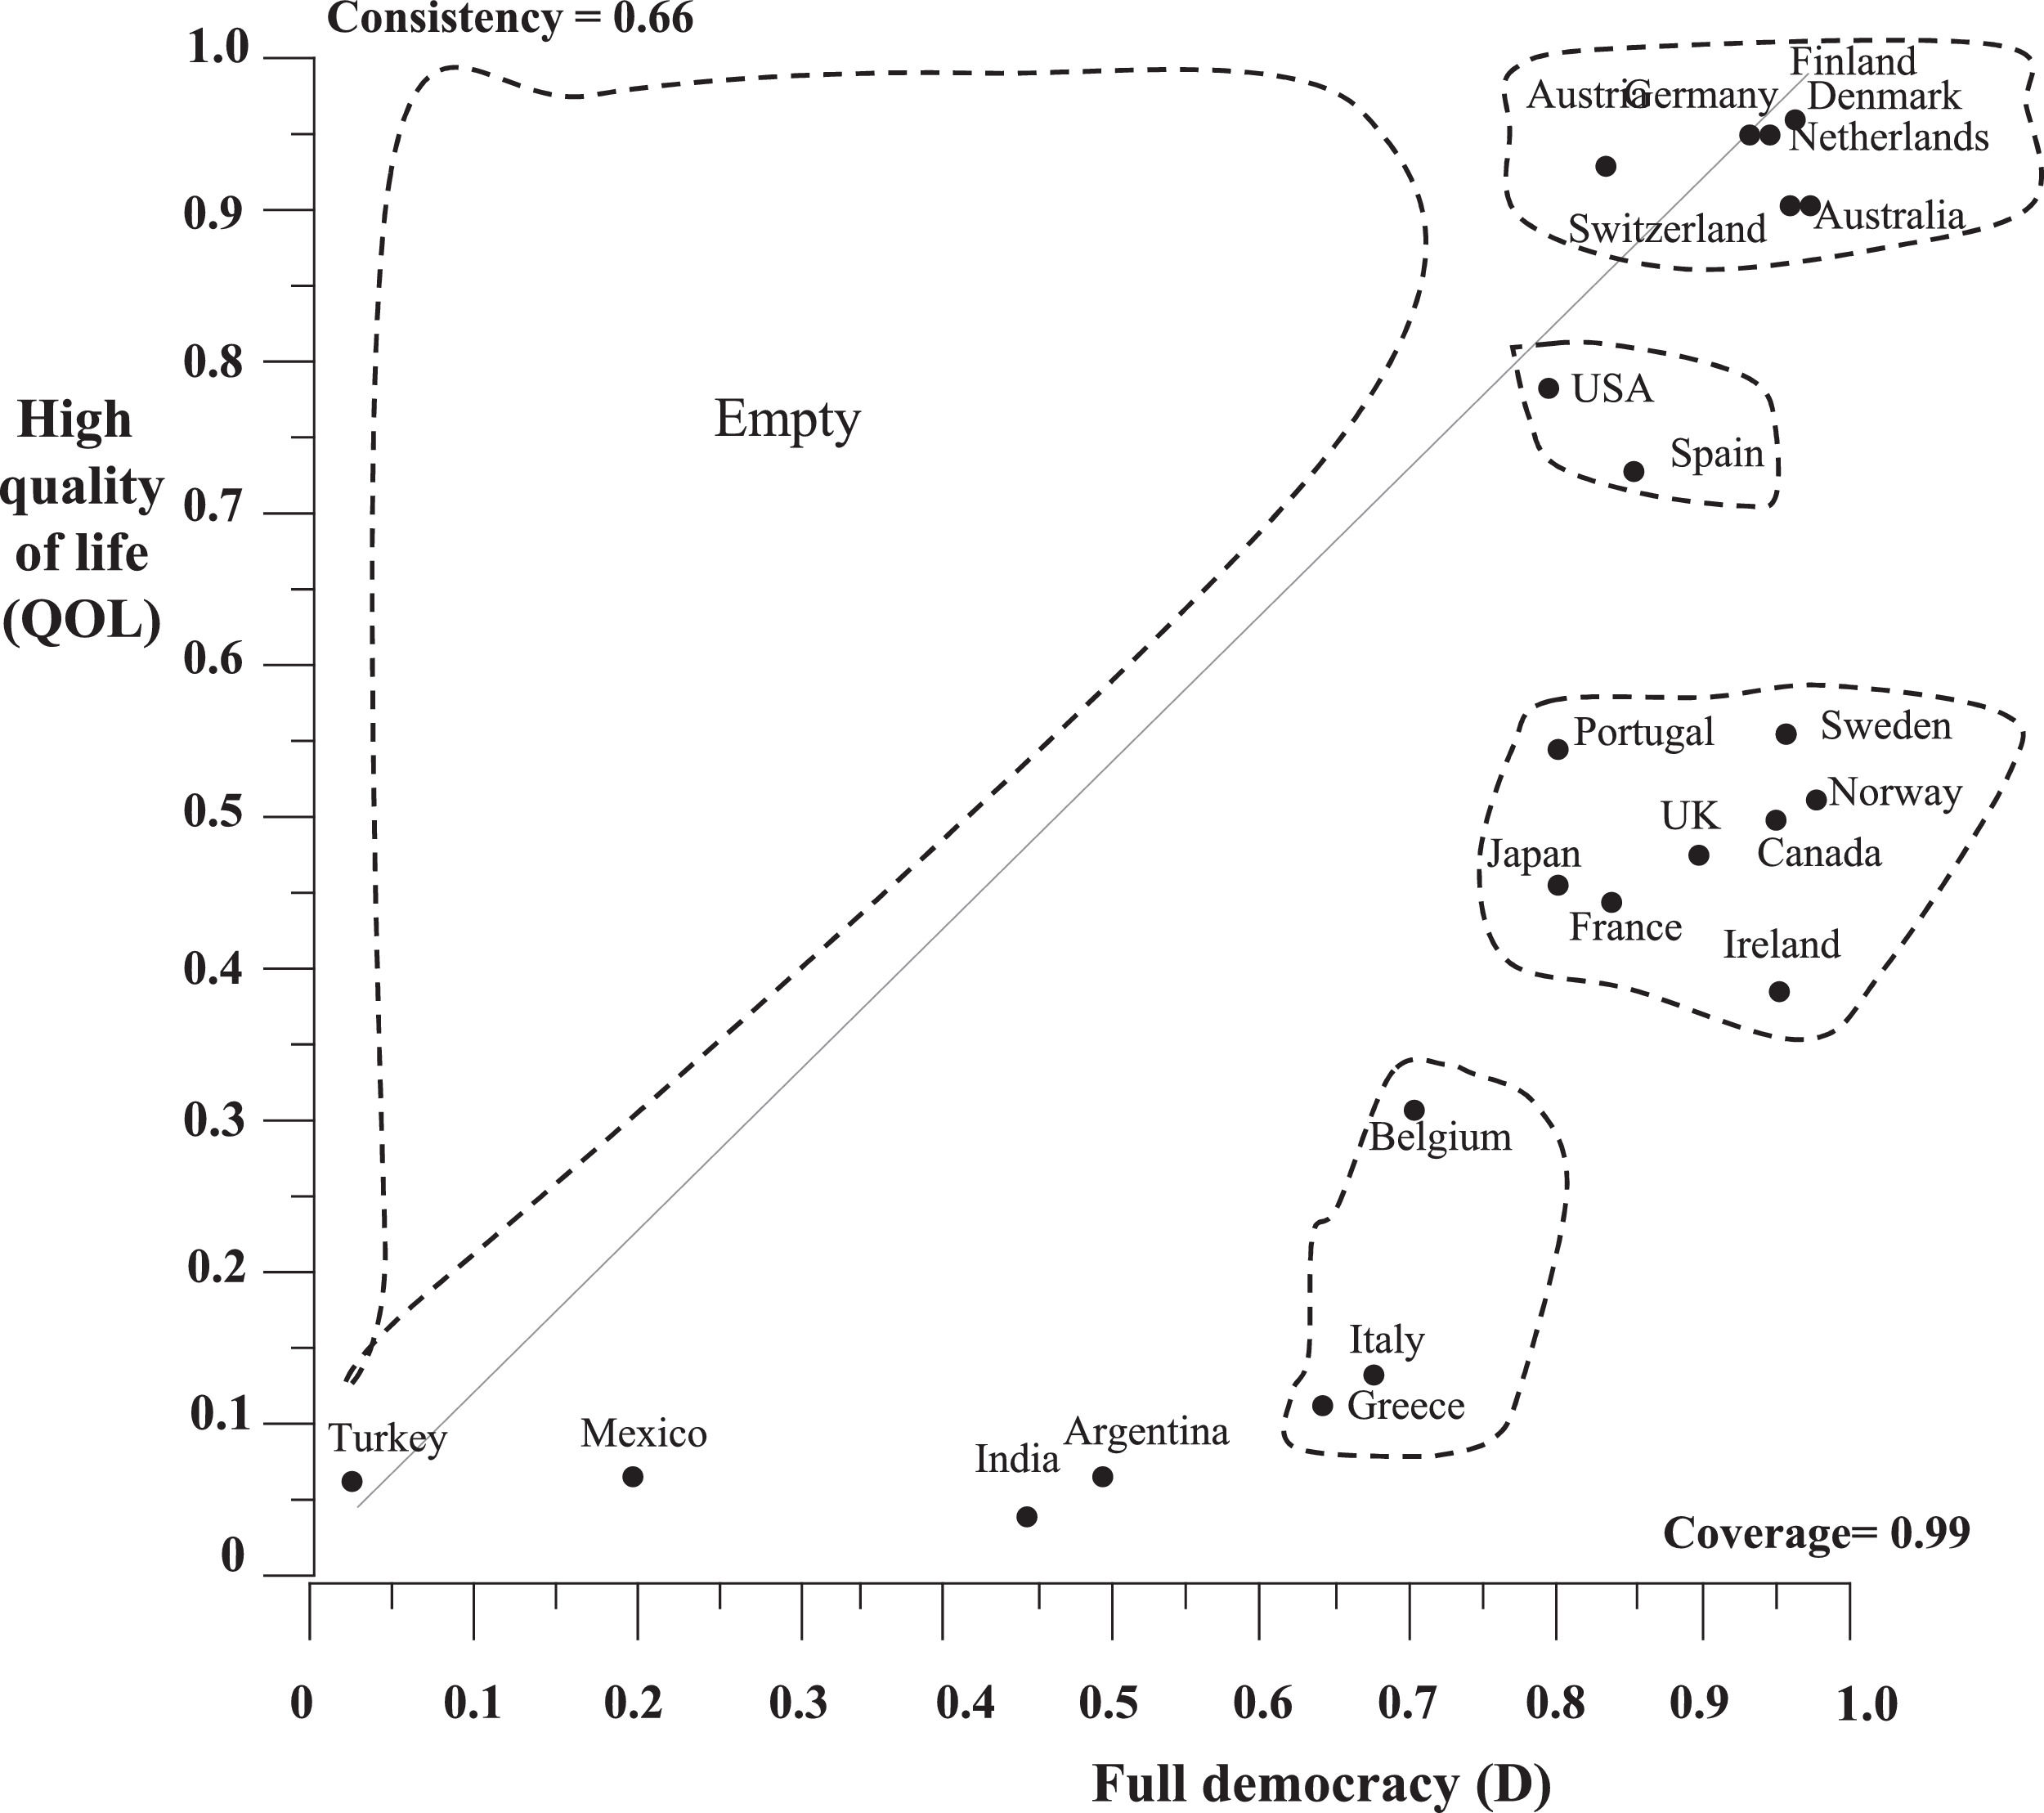
Figs. 1 and 2 are XY plot findings for the 24 nations in the present study. Figs. 1 and 2 illustrate estimating outcomes and not VDRs. Fig. 1 is an XY plot of full democracy (D) membership nations (i.e., high scores on the X-axis) indicating high QOL membership nations (i.e., high scores on the Y-axis). Fig. 1 shows that a subset of full democracy nations have high memberships in QOL. However, the model for high D indicating high QOL (D→QOL) consistently is inaccurate since other high D nations have comparatively modest to low QOL. The note at the bottom of Fig. 1 expands on the findings. For Figs. 1 and 2, the original nations’ scores for D and QOL for the sample (24 nations) were converted to calibrated membership scores ranging from 0.00 to 1.00 using logarithmic functions—details appear in the method section below.
 and high quality-of life (QOL). Comment. These findings support the theory that full democracy high membership is a necessary but insufficient condition for indicating high QOL No nation with low membership scores in full democracy have high QOL. Fll democracy indicating high QOL, D → QOL, is inadequate as indicated By the consistency index (C1) being well below the standard (0.80) for high accuracy—several nations are full democracies with comparatively medium in QOL. The coverage index (C2) is very high (0.99)—indicating that all high QOL nations are full democracies.")
Full democracy (D) and high quality-of life (QOL).
Comment. These findings support the theory that full democracy high membership is a necessary but insufficient condition for indicating high QOL No nation with low membership scores in full democracy have high QOL. Fll democracy indicating high QOL, D → QOL, is inadequate as indicated By the consistency index (C1) being well below the standard (0.80) for high accuracy—several nations are full democracies with comparatively medium in QOL. The coverage index (C2) is very high (0.99)—indicating that all high QOL nations are full democracies.
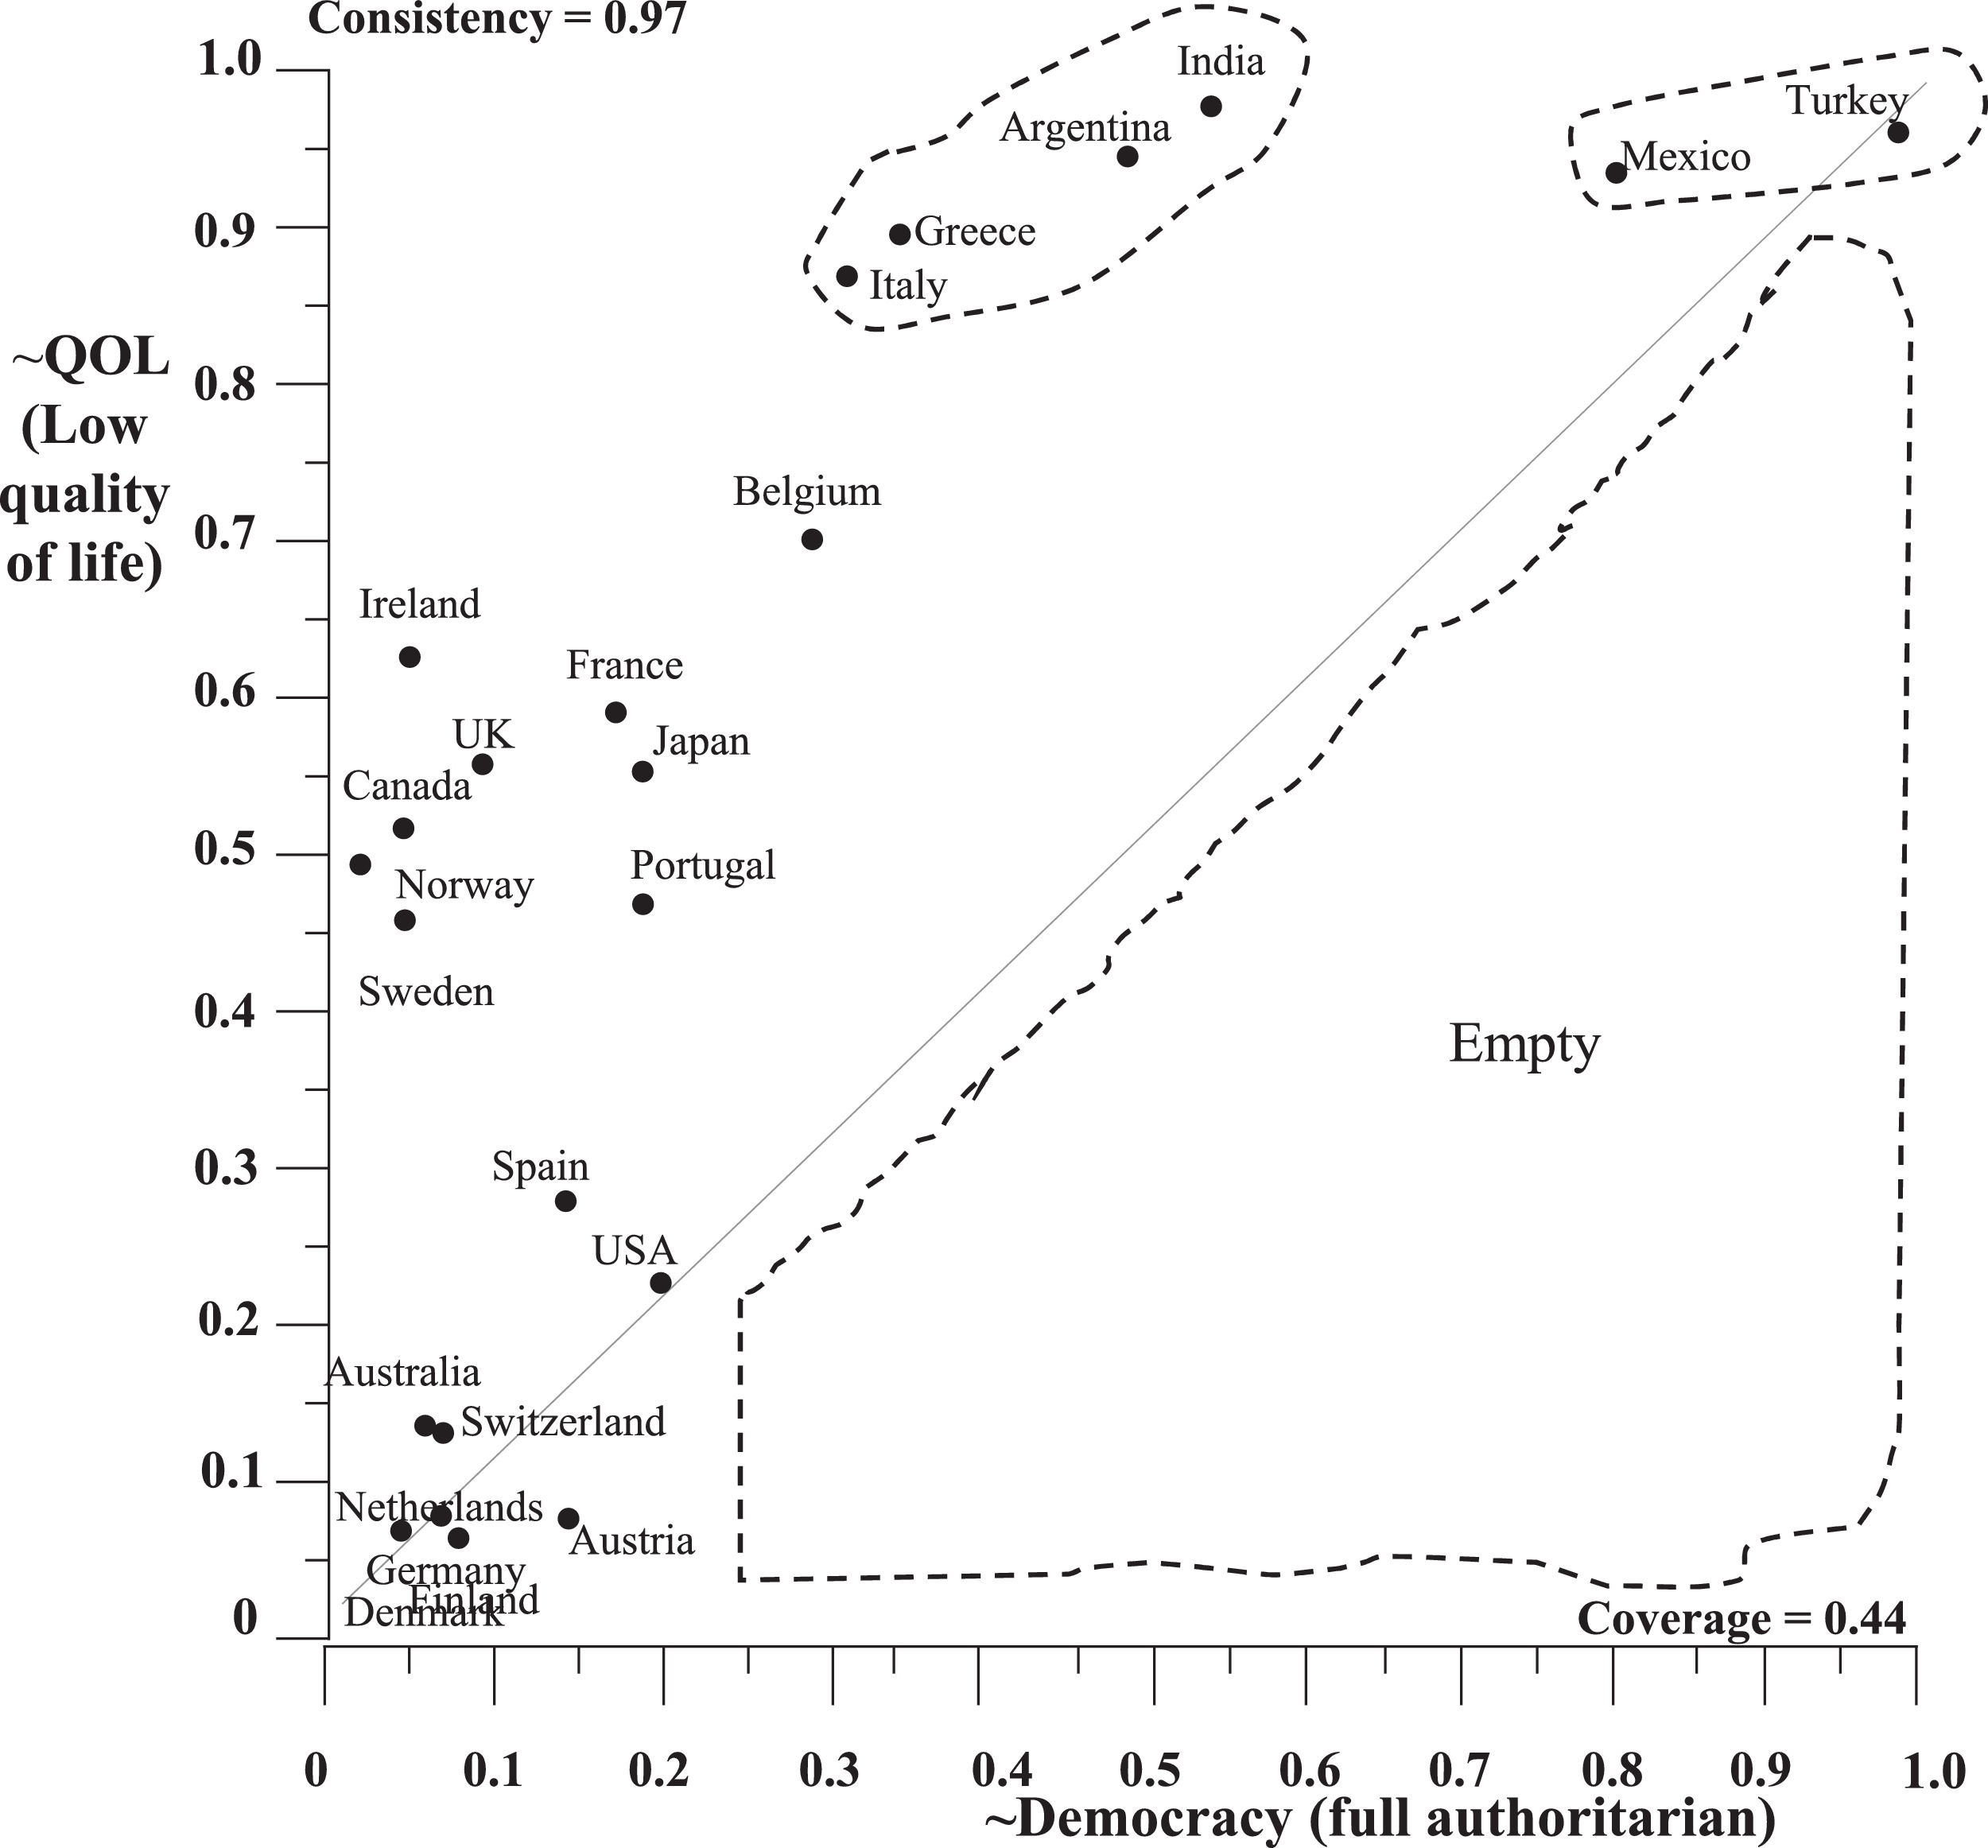
 and low quality of life (∼QOL). Comment. These findings support the theory that Autocracy high membership is sufficient for indicating specific nations having low QOL—Mexico and Turkey illustrate this finding. However, authoritarian high membership is not necessary for indicating low QOL: the fournations to the left of Mexico are not full authoritarian nations and are low in QOL. The consistency index (C1) is high (0.97)—indicating that all full authoritarian nations are high in ∼QOL (i.e., low QOL). The coverage index (C2) is modest (0.44)—indicating a few but not all ∼QOL nations are high in ∼D.")
Full autocracy (∼D) and low quality of life (∼QOL).
Comment. These findings support the theory that Autocracy high membership is sufficient for indicating specific nations having low QOL—Mexico and Turkey illustrate this finding. However, authoritarian high membership is not necessary for indicating low QOL: the fournations to the left of Mexico are not full authoritarian nations and are low in QOL. The consistency index (C1) is high (0.97)—indicating that all full authoritarian nations are high in ∼QOL (i.e., low QOL). The coverage index (C2) is modest (0.44)—indicating a few but not all ∼QOL nations are high in ∼D.
Fig. 2 supports the proposition that highly adhocracy nations have high score memberships in low QOL: ∼D → ∼QOL, where “∼D” is the negation of full democracy and “∼QOL” is the negation of high QOL. The asymmetric model, ∼D → ∼QOL is highly accurate: the two nations with high membership in ∼D have high memberships in ∼QOL. Asymmetric models predict a single or a complex outcome—unlike VDR symmetrical models, asymmetric case outcome models do not predict findings in two directions. As an asymmetric model, the model, ∼D → ∼QOL, is not designed to tell anything about nations not high in ∼D. Fig. 2 includes nations low in ∼D that are high in ∼QOL (e.g., Greece and Italy do not have high memberships in ∼D but still have high memberships in ∼QOL. Plainly stated, Greece and Italy are near full democracies and have comparatively low QOL. “Comparatively low” in comparison with the 22 additional nations in the present study. If the study included just Italy and all the nations in Central America and Africa, Italy would have comparatively high membership in QOL.
The present study proposes and examines specific conditions representing outcomes of full democracy (D) and full authoritarianism (∼D)—and if nations’ memberships in these conditions indicate high membership in QOL and ∼QOL as well as H and ∼H, respectively. The proposal here is that nations’ memberships in specific outcomes of D versus ∼D improves the accuracies in predicting QOL, separately for ∼QOL, H, and separately for ∼H. Testing such propositions deepens understanding and explanation of how D and ∼D work or do not work in impacting QOL, ∼QOL, H, and ∼H.
Following this introduction, section two briefly explores conceptualizations and findings in the relevant literature on democracy versus authoritarianism, ethical behavior versus corruption, GDPppp, quality-of-life, and happiness. Section three presents an initial, “first cut,” general democracy/adhocracy blooming/withering seed theory. Section four provides an introduction to complexity theory tenets that the present study applies. Section five describes the study's method in empirically testing the model. Section six presents the findings. Section seven is a general discussion of the benefits and limitations of the general theory, method, and findings with suggestions for future research. Section eight concludes.
Democracy, ethical behavior, wealth, income inequality, GDPppp, QOL, and happinessDemocracy and QOLBollen (1980: p. 91) defines define democracy as “the extent to which the political power of the elites is minimized and that of the non-elites is maximized.” Frey & Al-Roumi (1999) emphasize that many scholars (e.g., Dahl 1971, Lenski 1966, Touraine 1997) share this conception of democracy. Using index data for 87 nations for both democracy and “physical quality-of-life” (“PQOL”), Frey and Al-Roumi (1998) report statistically significant positive b-coefficients in variable directional relationship (VDR) tests via multiple regression analyses (MRA) of democracy level indicating PQOL. Generally, this positive democracy and QOL relationship receives empirical support in Frey and Al-Roumi's (1998) study and related studies (Reilly, 2010) during the first two decades of the twenty-first century. However, the statistically significance of the relationship varies from non-significant to marginally significant (i.e., p < 0.05) depending upon what additional variables are used in the MRA models. The problem with statistical significance of b-coefficients supporting the null versus the alternative hypothesis includes several issues of model construction and testing via MRA and related symmetric tests—and why some journal now ban the reporting of NHST and symmetric findings. Section four below reviews these issues.
Lindert's (1994) report that holding constant country, age, and income, the average democracy is like the average non-democracy in terms of spending on public pensions, welfare, unemployment, and health; Lindert's (1994) study is an example of bad science practice including failure to address more relevant questions relating to outcomes. The more relevant questions include the following issues. Are nations that are full democracies also consistently high in QOL? Are nations exhibiting the following conditions high in QOL consistently: Are full democracies high in GDPppp nearly all high in QOL? Note that Lindert (1994) tests for a symmetric VDR and finds support for the null hypothesis while the more relevant question is a case outcome asymmetric screening issue, that is, is full democracy alone sufficient for indicting high QOL and/or is full democracy a contributing ingredient in recipes indicating high QOL? These two asymmetric issues represent a radical paradigm shift from symmetric VDR theory construction and testing to asymmetric case outcome theory construction and testing.
Democracy, ethical behavior, and QOLThe present study proposes and tests the perspective that full democracies are foundational (i.e., fertile soil, metaphorically) for blooming ethical behavior (cf. Beets 2005, Koessler et al. 2013, Werlin 2002). High QOL is the fruit of complex antecedent configurations of the blooming of a variety of such seeds, that is, actions such as high ethical behavior, women suffrage, low-income inequality, and civil liberties. Relating to this metaphorical model is the perspective that the bouquet of democracies’ outcomes producing high QOL needs to include a variety of blooming seeds including high ethical behavior as necessary but insufficient alone for indicating high QOL—actually the findings in the present study indicate that high ethical behavior alone is an effective indicator of high QOL.
Rock (2009) offers useful evidence that full democracies have low corruption comparatively versus nations that are not full democracies. Rock (2009: 2) focuses on the perspective that regression analysis fits indicate an inverted “U” shaped relationship between corruption and democracy, “Both theory and case evidence provide compelling support for a democratization breeds corruption hypothesis, at least up to a point” (Rock, 2009: 70) and “Evidence presented here, based on a panel of data for the period 1982–1997, a period during which an apparent demonstration effect ushered in both democracy's Third Wave and a good governance agenda, found strong support for this inverted U relationship between corruption and the durability of democracy” (Rock, 2007: 3). The actual XY plot in Rock's working paper and published version (Rock, 2009) provides scant evidence for an inverted “U” relationship between corruption and democracy. Neither theory nor case evidence provide compelling support of an inverted “U” relationship. Relatedly, Anscombe (1973) created four XY plots of four different data sets having the identical averages, standard deviations, and correlations but vastly different XY plots to illustrate the great usefulness of showing relationships visually—such XY plots should be done before and/or after symmetric as well as asymmetrical testing. The present study includes a series of XY plots in empirically testing the propositions of the democracy blooming and adhocracy wilting models.
While exciting to contemplate—a shift from low to moderate democracy nurtures a raise in corruption, the evidence indicates this conclusion is not supportable empirically. The substantial relevant finding is that nations very high in democracy (i.e., top quintile) achieve very high ethical behavior. What is supportable in the studies that Rock (2009) describes, is that a tipping point is apparent: only for all the nations very high in democracy are generally low in corruption (i.e., high in ethical behavior). The prior sentence to this one now transforms the discussion from symmetric VDR and NHST to asymmetric case outcomes and “statistical sameness testing” (Hubbard 2015; aka: “somewhat precise outcome testing (SPOT)” Woodside 2019). The case outcome modeling findings reported below in the present study support the theoretical and case outcome perspectives that full democracy is necessary but not sufficient for high ethical behavior to occur among nations and high authoritarianism alone is sufficient but not necessary for high corruption to occur among nations. Such findings support the stance that examining complex causes of high ethical behavior outcomes provides insufficient knowledge about the causes of high corrupt outcomes—the two outcomes are not the mirror opposites of each other (cf. Weick and Sutcliffe 2007).
Democracy, wealth, and QOLThe present study puts forth the following propositions. First, among nations, full democracy is necessary but insufficient for comparatively high monetary wealth (i.e., wealth measured by GDPppp per capita). Second, full authoritarianism is necessary but insufficient for indicating the individual conditions of high Gini index (Gini), low ethical behavior (∼E), and low GDPppp (∼GDP) across nations. “Necessary but insufficient” represents the perspective that high national wealth per capita occurs for some nations with high democracy but rarely among nations with low democracy. The present study demonstrates “moving away from multiple regression analysis” (Woodside, 2013) and the assumption of symmetric relationships to the use of algorithms—including proposing that conjunctive complex condition that all nations high in ethical behavior (E) as well as high in the negation of the Gini index (∼G) as well as high GDPppp are high in QOL. The conjunctive statement is illustrative of Zadeh's (1996) “computing with words” expression of a Boolean complex conditional statement: E●∼Gini●GDPppp → QOL, where the mid-level dot (i.e., “●”) represents the logical “AND” operator—all the conditions connected by “AND” must occur for full membership representation of a case in the model. The three ingredients in this complex antecedent condition and the single outcome are conditions and not variables and the Boolean operation requires a nation to have high scores in all three parts of the antecedent condition—a high bar. As an asymmetric proposition (i.e., E●∼Gini●GDPppp), no outcome estimate is made about low scoring cases for this complex statement; some nations with low scores on this statement may have high scores on QOL (e.g., Spain and the USA) but such a finding is irrelevant to the model's asymmetric prediction. The statement estimates one direction: high scores for the complex statement indicate nations having high scores in QOL consistently. The core findings in the present study support this prediction.
Most research studies in economics address the following symmetric VDR question: Does increasing income cause increases in democracy (e.g., Acemoglu et al. 2005, 2009)? For example, Acemoglu et al. (2005: 2) report, “Existing studies establish a strong cross-country correlation between income and democracy, but do not typically control for factors that simultaneously affect both variables. We show that controlling for such factors by including country fixed effects removes the statistical association between income per capita and various measures of democracy. We also present instrumental variables using two different strategies. These estimates also show no causal effect of income on democracy.” However, such symmetric tests for statistical association qualify for McCloskey's (2002) criticism of VDR studies as being “rubbish” rather than substance. McCloskey (2002, p. 55) describes the most harm studies relying on NHST inflict on the economics discipline—what she labels as the “Two Sins of Economics” (i.e., being content with only directional qualitative predictions in both theories and applied for work). “The progress of economic science has been seriously damaged. You can't believe anything that comes out of the ‘Two Sins’. Not a word. It is all nonsense, which future generations of economists are going to have to do all over again. Most of what appears in the best journals are unscientific rubbish. I find this unspeakably sad” (McCloskey, 2002: 55).
Given that the creating and tinkering with its laws and legal rulings of democracies represent human decision making, “full democracy” is more an antecedent rather than an outcome condition. Income is one of the outcomes of human activity. VDR studies are more rubbish than substance for several reasons. Woodside (2019) describes the following two reasons to be relevant for income-democracy symmetric studies. First, in multiple regression analysis such practices focus on examining whether or not the findings support rejecting the null hypothesis for each independent variable—a particularly low bar of information especially compared to predicting a precise score outcome or an interval range of impact. Learning that a statistically significant positive (negative) relationships exist between XY variables usually provides scant information on the occurrence of a specific outcome—and the information that is provided on the directionality of relationships frequently is misleading (cf. Anscombe 1973). Second, MRA focuses on whether the sizes of net effects of variable relationships differ from zero and not on predicting point or interval outcomes accurately. The classic linear regression model treats variables as competing in explaining variation in outcomes rather than showing how variables combine to create outcomes. “By focusing on the relative importance of rival variables, a correlational approach has difficulty treating cases as configurations and examining combinations of variables. This becomes particularly evident in the fact that regression analysis focuses on the unique contribution of a variable while holding constant the values of all other variables in the equation” (Fiss, 2007: 1181). Pervasively, extant studies in economics, psychology, and management offer few insights on whether or not one, all, or combinations of these ingredients need to be present to a high value in a dependent variable across cases. Thus, the present study moves away from MRA, VDR, and symmetric analysis to algorithms, conditional screening models, and asymmetric case, interval range, findings.
Democracy, income inequality, and QOLPrior research (Aslan, 2017) provides the conclusion that in democracies governments tend to significantly redistribute more resources than in non-democracies. The findings are also consistent with the finding that institutions matter as Acemoglu et.al. (2009) show: democracy has redistributive effects. Among democracies, “A rise in the Gini of net income by 10 points leads to a decrease in the growth of real GDP per capita in the range of 0.84–1.13%. On the other hand, a rise in the redistribution by 10 points leads to an increase in the growth of real GDP per capita in the range 1.27–1.4%” (Aslan, 2017: 31). However, these forecasts are based on symmetric, regression analysis, fit prediction and economic growth is not the same as QOL. Also, Aslan's (2017) does not verify his forecasts of GDP growth by tests of the model's predictive validity using separate samples—fit validity of an MRA models is higher relatively that for case outcome models but the opposite occurs typically for predictive validity (Gigerenzer & Brighton, 2009; McClelland, 1998).1 The findings below support the observations that the pattern is suggestive that full democracies have lower income inequality (measured by Gini indexes) and lower income inequality results in higher QOL in comparison to adhocracy nations.
QOL and happinessThe present study proposes that all or nearly all nations comparatively high in QOL have comparatively high happiness membership scores. This proposition is an asymmetric statement with the intention not to suggest that all nations low in QOL are low in happiness. Prior research (e.g., Shin and Johnson 1978) indicates that QOL (measured for individuals by responses to the question, “Satisfaction with living standard”) is the second largest R2 contributor using stepwise regression analysis—the first contributor in Shin and Johnson's (1978) study was responses to the following question, “You perceived life enjoyment relative to others”). However, stepwise regression analysis is a particularly bad science practice as it represents the antithesis of theory construction, and its use nearly always results in statistically significant terms even when using values for variables from a table of random numbers as Armstrong (1970, 2012) demonstrates. If a researcher believes that s/he must perform regression analysis, Armstrong (2012) recommends limiting the number of terms (i.e., variable in the regression analysis) to three or less) and never to use stepwise regression. Shin and Johnson (1978) include terms for 20 variables in their regression analysis and findings—a practice that enables achieving a high fit of data by the regression model but low predictive validity of the model for data from separate samples. (An even better step than limiting regression analysis to three terms is not to use symmetric theory construction and regression analysis as Hubbard 2015) and Ziliak and McCloskey (2008) recommend—the causes of high scores differ from the causes of low scores for an outcome and separate, asymmetric models are necessary for accurate explanation and prediction for both outcomes.)
The studies by Bruni and Porta (2016) and Schimmel (2009) are compelling in their explanations of QOL and happiness. They emphasize that theory and practice need to incorporate both objective as well as subjective measures of QOL as well as for happiness. “Objective happiness” may follow from having and using freedoms available in full democracies though these freedoms are taken for granted—similarly, objective unhappiness may follow from limitations placed on the individual in specific cultures (e.g., cultural and legal restrictions placed on females in many cultures ranging today from mild (USA), moderate (Japan), to severe (Saudi Arabia). Possibly, only from direct observation across nations and examining independent evidence permit individuals to recognize objective as well as subjective (un)happiness. Can the quality-of-life, of happiness, be evaluated solely by subjective perception? Probably not, precisely because the adaptation effect [i.e., adjusting emotions due to immediate contextual influences] can carry so much weight; making subjective self-evaluation the principal or sole indicator of happiness invites many mistakes. For example, it invites assigning less value to civil goods such as rights and liberty, which are difficult to translate into terms of subjective happiness, but which instead carry a great deal of weight in objective terms (consider what happens when they are taken away). If Americans today were asked whether they would prefer a 5% reduction in income tax or an analogous increase in democracy, it might not be surprising if most (not all, obviously) would barter their ‘birthright’ of democracy for a ‘lentil stew’ of income…. Subjective happiness is certainly important, but it alone is not sufficient to evaluate the goodness of life: the evaluation of well-being cannot be entrusted solely to self-evaluation. Just as the Gross Domestic Product (GDP), which measures the wealth of a country, is insufficient as an indicator of well-being, so it cannot be replaced with an alternative indicator of subjective happiness (Bruni & Porta, 2016: 14–15).
The QOL concept and measurement in the present study relates to the “consumer well-being” concept and measurement in the marketing literature (Sirgy, 2021). Sirgy (2021, p. 128) indicates that “the established macro-marketing constructs of consumer well-being may be too focused on material goods and services.” The QOL measurement applied in the present study does go beyond the focus on material goods and services and QOL is overlapping in meanings with consumer well-being. Including measures of both constructs and their possible antecedents and outcomes in studies of macro-marketing, forms of government, and happiness will increase the value of future research on these topics (Laczniak & Santos, 2018; Malhotra, 2006).
By comparing rankings of specific nations for the United Nations’ Development Program UNDP) using the Human Development Index (HDI) and national surveys on subjective happiness, Schimmel (2009: 109) reports “Contrary to UNDP's assumption that maximizing levels of the HDI components always brings optimum [italics emphasis by Schimmel] results for people's well-being, happiness research illustrates that increased national and personal income and a higher level of education do not necessarily lead to greater happiness.” Using a Boolean-algebra, asymmetric case-based algorithm methodology, the present study clarifies and deepens Schimmel's (2009) observations: an algorithm that includes a configuration of five QOL conditions is highly accurate in indicating nations high in happiness and this algorithm does poorly in predicting what it is not designed to predict—nations with low happiness outcomes. The negation of QOL is an insufficient algorithm for predicting the negation of nations’ happiness. Just as Schimmel (2009) observes anecdotally, formal modeling by algorithms indicates that some nations have high scores in the negation of QOL and comparatively low scores in the negation of happiness scores (e.g., Argentina, Italy, and the USA). The sets of findings for high QOL and the negation of QOL support the complexity theory tenet of asymmetry—the mirror opposite model that accurately predicts happiness does not accurately indicate unhappiness. The findings section elaborates on these results.
Conclusions from examining relevant literatureThe substantial majority of studies on possible outcomes of democracy, such reducing income inequality, increasing GDP per capita, and increasing ethical behavior, supports the general hypothesis that democracy nurtures increases in these outcomes more so than adhocracy nations. Similarly, studies on democracy outcomes influencing QOL and happiness support the occurrence of positive outcomes. However, these studies rely on symmetric (two-direction) VDR models and NHST. Several studies and the American Statistical Association (ASA) recognize symmetric theory construction and testing against the null hypothesis (NHST) to be bad science practices (Wasserstein & Lazar, 2016). Rather than modeling to test if independent variables influence the two-way directionality of values of a dependent variable systematically greater than zero (i.e., testing that a b-coefficient differs from zero in a MRA and the relative sizes of standardized b-coefficients), theoretical and empirical value increase when researchers construct asymmetric models and test whether or not a specific point or interval outcome occurs consistently among the cases having the ingredients specified by the model. Section three adopts these practices in presenting separate democracy blooming and adhocracy wilting models of ethical behavior, economic wealth, and income (in)equality, and downstream impacts on QOL and happiness.
Constructing democracy blooming and adhocracy wilting modelsThis study proposes and empirically tests a set of models of democracy blooming conditions resulting in high QOL and high happiness outcomes. Also, the study proposes and empirically tests a set of models of adhocracy wilting conditions resulting in ∼QOL and indicating ∼H outcomes. Based on the proposition that the impacts of democracy and authoritarianism are not the mirror opposites of one another, separate, asymmetrical models for each set of outcomes provide unique and useful explanations. Also, the ingredients representing complex antecedent condition in each of the models may vary for the opposite outcomes (e.g., high QOL versus low QOL and high happiness versus high unhappiness).
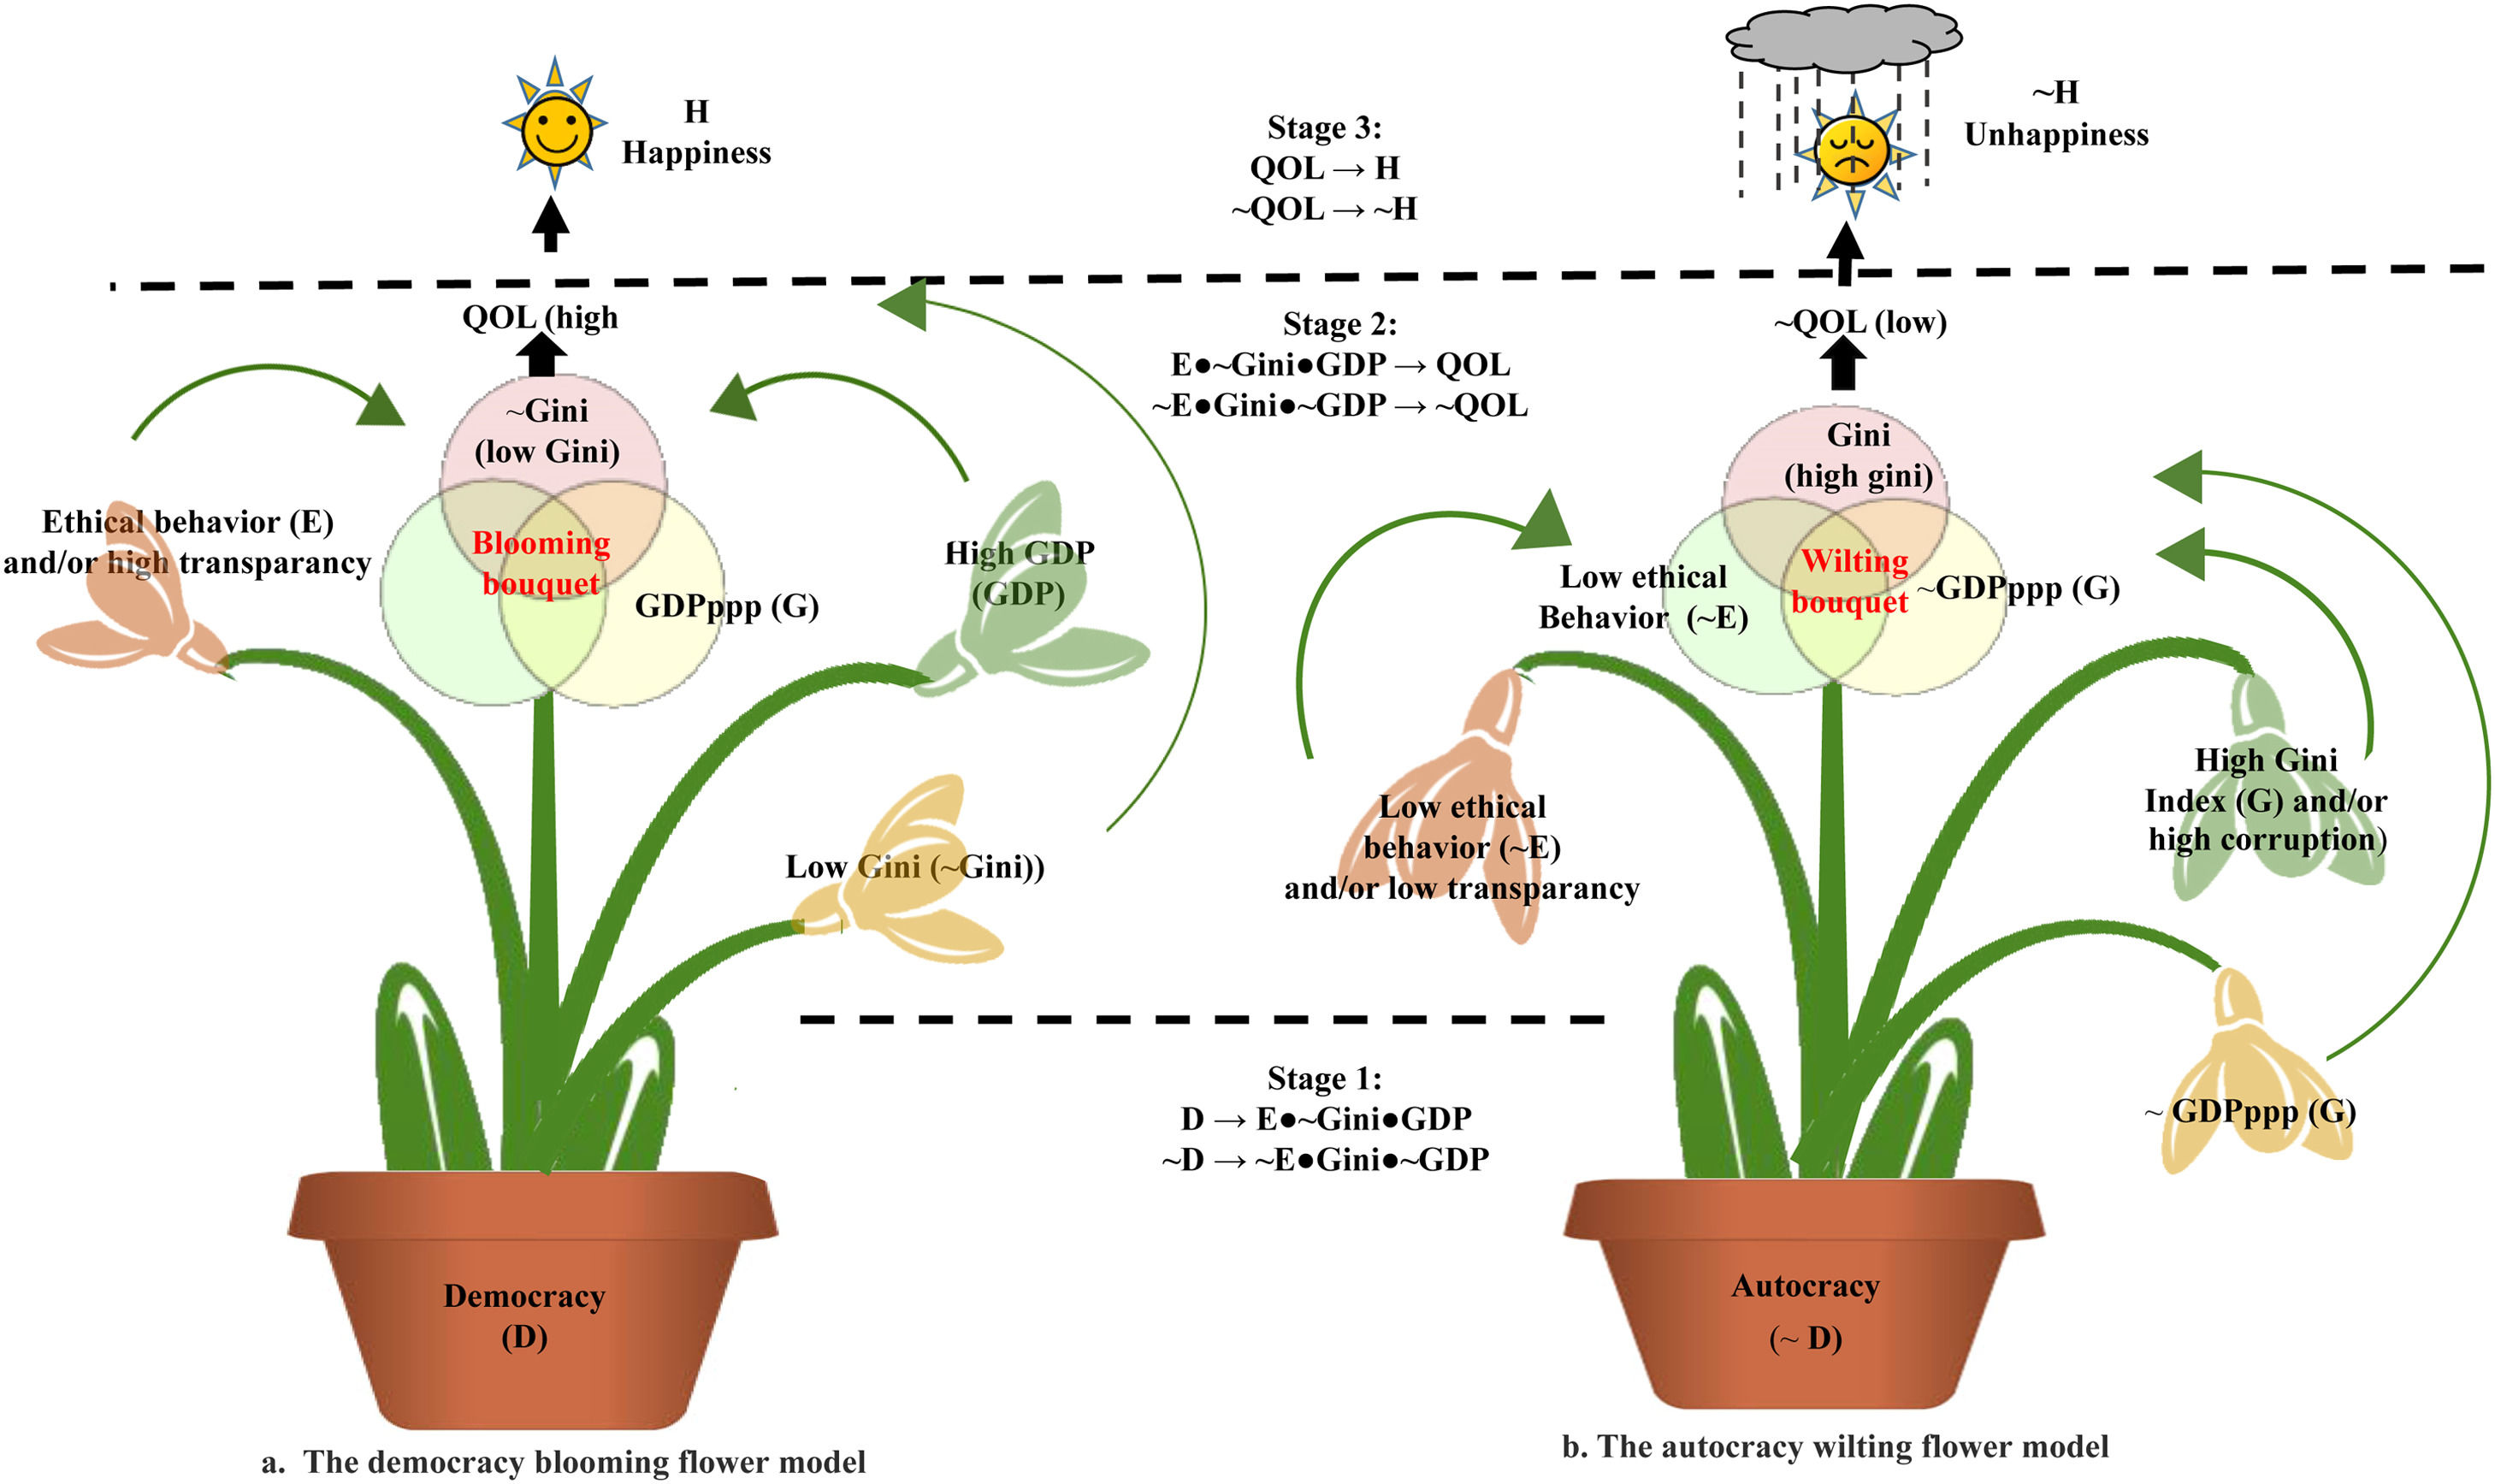
Fig. 3a and b are visual summaries of the two models. The following notation represents terms in the models: “D” represents high democracy; “E” is high ethical behavior; high “GDPppp” (aka: high “GDP”) is gross domestic product in purchase price parity units; “GDPppp” or high “GDP” refers to nations comparatively high in gross domestic product in purchase price parity units; “Gini” is high Gini index scores; “QOL” is high quality-of-life; “H” is high happiness. “High” in the models are scores above the median inflection point on the Y axis in an XY plotted as a log function, where the “X” axis is a simple or complex antecedent condition, and the “Y” axis is a simple or complex outcome condition. “Very high” in the models are scores about the third inflection point on the X axis in the XY plotted as log function. Thus, while “democracy” is variable, “high democracy” (D) is an antecedent condition. Similarly, all terms in the study are conditions with E, GDP, and Gini being both outcome and antecedent conditions. This study is not about variable directional relationships. The study is about explaining and predicting outcomes, such as, “all or nearly all full democracies exhibit high ethical behavior” is a conditional statement that this study predicts, explains, and supports with evidence.

Stage 1 in Fig. 3a includes three principal blooming models. Model 1a: D → E (i.e., cases comparatively high in democracy are comparatively high in ethical behavior; alternatively, same expression: D ≤ E). Model 1b; D → GDPppp per capita. Model 1c: D → ∼Gini, where the sideways tilde, “∼” represents the negation and “∼Gini” represents high scores on income equality, given that Gini represents high scores on income inequality. “Very high ∼Gini” scores are scores about the third inflection point on a log scale for all ∼Gini scores—the third inflection points for conditions are set at start of the fifth quintile for indicating the conditional scores in five categories: very low, low, medium, high, and very high. (Alternatively, in setting the logarithmic scale, Ragin 2008) suggests setting the third inflection point at the 95th percentile, the first inflection point at the 5th percentile, and second inflection point at the median score. The impact on the findings of using more or less restrictive scores for the first and third inflection points is scant to modest. Model 1d: D → (E●GDP●∼Gini), where the mid-level dot (i.e., “●”) represents the logical “AND” condition” in Boolean algebra. By analogy, model 1d states that a high democracy results in a combination of desirable outcomes—a bouquet of social and economic blooms. Thus, in “computing with words” (Zadeh, 1996), model 2 states that all or nearly all nations with high scores in the configuration of all three conditions of E, GDP, and negation of Gini have high QOL.
Note in Fig. 3a that the blooming bouquet (E●GDP●∼Gini) is a complex outcome condition from democracy and a complex antecedent condition indicating high QOL (i.e., (E●GDP●∼Gini) →QOL). The following statement occurs in stage 3, that is, model 3 in Fig. 3a: QOL →H. Model 3 states that high QOL is sufficient for indicating high H (happiness). The assumption that high QOL is necessary for high H is incorrect. A nation may achieve high H without high QOL. A symmetric relationship indicating both necessity and sufficiency is a more rigorous statement than the statement that QOL→H. The finding below supports the perspective that high H without high QOL does occur for a few nations.
The three blooms in Fig. 3a are not intended to indicate that only these three blooms are possible for democracy. National laws and policies protecting consumer rights, universal health coverage, free education for children, parental leave benefits, gender mainstreaming government requirements; mandated minimum pay levels, outlawing slavery, and additional benefits and responsibilities are examples of symptoms of a democracy that individually are insufficient but in various combinations are sufficient, even though not necessary, for indicating high QOL.
Stage 1 in Fig. 3b is drawn as the mirror negation of Fig. 3a so that the visuals appear to be symmetric. However, proposing and testing causal models of the negation versus achieving high QOL and H are necessary for several reasons. The reasons include prospects that the blooming model may receive empirical support but not the wilting model, or the opposite, for indicating high QOL versus the negation of QOL and H versus ∼H. This view reflects paraphrasing Tolstoy's (1878/2017) first sentence in his novel, Anna Karenina, to read, “All happy countries are all alike; every unhappy country is unhappy in its own way.” If empirical findings support this view, many more asymmetrically models would be necessary to achieve high coverage of the many unhappy nations in comparison to the fewer models indicating high happiness.
Prior studies include the findings that adhocracy (i.e., ∼D or “A”) nations are highly extractive of resources and incomes from the general population to the few in power. Highly adhocracy nations exhibit the wilting of low ethical behavior and low GDPppp per capita, and high Gini indexes. The models in Fig. 3b (right side of Fig. 3) include the following expressions:
Model 4a: A → ∼E, where E is high ethical behavior, ∼E is high corruption;
Model 4b: A → ∼GDPppp per capita where ∼GDPppp is equal to one minus GDPppp;
Model 4c: A → Gini index where high Gini indicates high income inequality;
Model 4d: A → ∼E●∼GDPppp●Gini, a complex outcome condition;
Model 5: ∼E●∼GDPppp●Gini → ∼QOL where ∼QOL is a high score indicating low QOL;
Model 6: ∼QOL → ∼H, where ∼H is high unhappiness.
The study here applies complexity theory tenets and asymmetric screening modeling in developing a set of propositions for explaining how and predicting when democracies, and separately adhocracy, nations achieve high (low) quality-of-life (QOL) and high (low) national happiness. Unlike multiple regression and symmetric modeling of variable directional relationships (VDRs), tenets of complexity theory and asymmetric screening modeling focus on explaining and predicting point or interval outcomes. Rather than VDRs, screening models propose that a few conditional recipes of cases indicating a specific point or interval outcome occurs for nearly all cases matching one of these recipes—screening recipes are one direction models. Researchers proposing and testing VDRs typically do so with symmetric tests (e.g., regression analysis and null hypothesis significance tests (NHST)) in using the same model to predict high as well as low scores in a dependent variable—multiple regression models predict two-directional relationships. Symmetric modeling with NHST is pervasive in research on democracies and autocracies impact on nations’ government and individual behavior, QOL, and happiness.
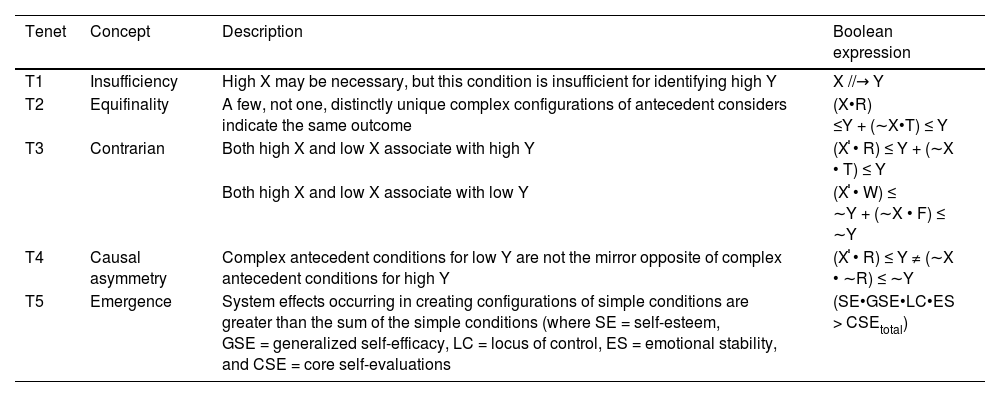
Table 1 includes five complexity theory principal tenets. These tenets describe characteristics of conditional outcome modeling by single and complex antecedent conditions using Boolean algebra operations. Note the shift here from a focus on estimating symmetric associations among variables to estimating an asymmetric case-outcome condition. The first complexity tenet is that many conditions are necessary but not sufficient. For example, being male is a necessary gender condition for being a player in a country's National Football League but few males qualify to be an NFL player.
Core tenets of complexity theory.
Key: Boolean algebra operational meanings: mid-level dot, “•”, indicates the logical “and”; sideways tilde, “∼”, indicates negation; the plus size “+” indicates “or”; the less than or equal sign, “≤” indicates scores for the model input statement are all or nearly all lower than scores for the outcome, Y or (Y • Z); the not equal sign, “//→” indicates that the input model (simple or complex) does not indicate an asymmetric pattern that screens for Y or ∼Y where “Y” refers to cases with high Y scores and “∼Y” refers to cases with low Y scores, the negation of a Y score; “X” refers to high X scores and “∼X” refers to low X scores. X, R, F, and W refer to simple antecedent conditions; Y and Z refer to simple outcome conditions; “≠” refers to causal asymmetry.
Notes. A useful protocol is to discretize scores when calibrated values of a variable into fuzzy-set scores so that all cases in the lowest quintile have fuzzy-scores ≤ 0.05 and cases in the highest quintile have fuzzy-scores ≥ 0.95. Configural analysis and setting consistency requirements are “fuzzy” in deciding what constitutes low (e.g. ∼Y) and high (Y) scores and in deciding on the limit necessary for models of complex antecedent conditions to surpass to indicate high accuracy in predicting Y or ∼Y.
Second, a few of many available complex configurations of antecedent conditions are sufficient indicators of high scores in an outcome condition but each is unnecessary. A “complex condition” is a configuration of two or more simple conditions. For example, the following word model is a complex condition: all, or nearly all, cases having high scores (e.g., scores reflecting being above the 80th percentile) across all three conditions for ethical behavior, GDPppp, and ∼Gini using calibrated scores are high in H. “Calibration” is converting raw or index scores into scores ranging from 0.00 to 1.00 using a log function with three inflection points—in the present study calibrated scores have long tails below the 20th percentile and above the 80th percentile. The median index value is assigned a calibrated score of 0.50 for all conditions having ordinal, interval, or ratio individual case values. For example, here are Denmark's calibrated scores for ethical behavior (1.00), ∼Gini (1.00), and GDPppp (0.71) indicating that Denmark has top scores among nations in ethical behavior, income equality, and a relatively high GDPppp. Consequently, using the Boolean algebra operation for configurations, Denmark's configurational score for the complex fuzzy statement, E●∼Gini●GDPppp equals 0.71—the lowest score among the single conditions in the complex statement. The 0.71 represents the membership overlap across the three ingredients that Denmark possesses—how much the complex fuzzy statement represents Denmark. Conclusion: Denmark has a high membership score in the democracy bloom appearing in Fig. 3a.
The third tenet: contrarian cases occur, that is, low scores in a single antecedent condition associates with both high and low scores for an outcome condition for different cases. Even if an association indicates a large effect size (i.e., r2 ≥ 0.50, Cohen 1977), about ten percent or more of the cases in the data set will indicate a reverse association to a main effect. Often, such contrarian cases do not occur as unaccountable blips but occur due to alternative contexts that differ from the contexts associating with the principal main effect relationship. The pervasive practice dominating the reporting of main and moderating variable effects is to ignore such contrarian cases. Case-based models seek to explain and predict outcomes accurately for such contrarian cases. For example, both low and high religiosity for different nations may be conditions indicating (different) nations high in QOL—their presence depends on different other ingredients in the recipes indicating the same QOL outcome—high versus low religiosity's impact on conditional QOL and H models is the topic of a separate study. Consequently, viewing religiosity as having a positive or negative symmetric effect on QOL is inadequate and misleading since both high and low religiosity may indicate high QOL. Further details on religiosity and QOL are beyond the scope of the present study.
The fourth complexity tenet: causal asymmetry occurs, that is, accurate causal models for high scores for an outcome condition are not the mirror opposites of causal models for low scores for the same outcome condition. Similar to Weick and Sutcliff's (2007) focus on describing and explaining highly reliable organizations being unique from profit-focus behavioral theory of the firm, the study of cases exhibiting high QOL is more unique than complementary to the study of cases exhibiting low QOL. Different sets of complex configurations of antecedent conditions are necessary for the study of high QOL versus low QOL. Studies by Fiss (2011), Ordanini et al. (2014), and Wu et al. (2014) illustrate the causal asymmetry tenet in several contexts including how different contexts with high happiness as an ingredient in different employee recipes indicate high as well as low job performance (e.g., Hsiao et al. 2015).
Fifth, creating a complex screening algorithm to identify cases with scores above a cutoff (e.g., above the 80 percentile) for each of few (e.g., 4) simple condition appearing in the algorithm (i.e., a very tough, “Ninja warrior”, rule) serves to increase consistency in identifying cases with high scores in an outcome condition versus the use of a more simple algorithm of computing the sum of the simple calibrated conditions, calibrating the sum, and establishing a cutoff of cases above the 80 percentile. In studies of firms or individuals, with the use of three or more simple conditions, less than a fourth of the cases with scores above the 80 percentiles on any one simple antecedent condition can be expected to have scores above the 80 percentile for all other simple conditions. In general, for models working well in identifying cases with high scores in an outcome condition, adding simple conditions to complex antecedent conditions serves to increase the accuracy while reducing the coverage of the models. In case-based modeling, achieving high consistency in correctly identifying cases with high scores in the outcome is the primary objective. Researchers accomplish models of high coverage of most cases with high scores in the outcome condition by constructing a few relevant models whereby each model provide high consistency but relatively low coverage.
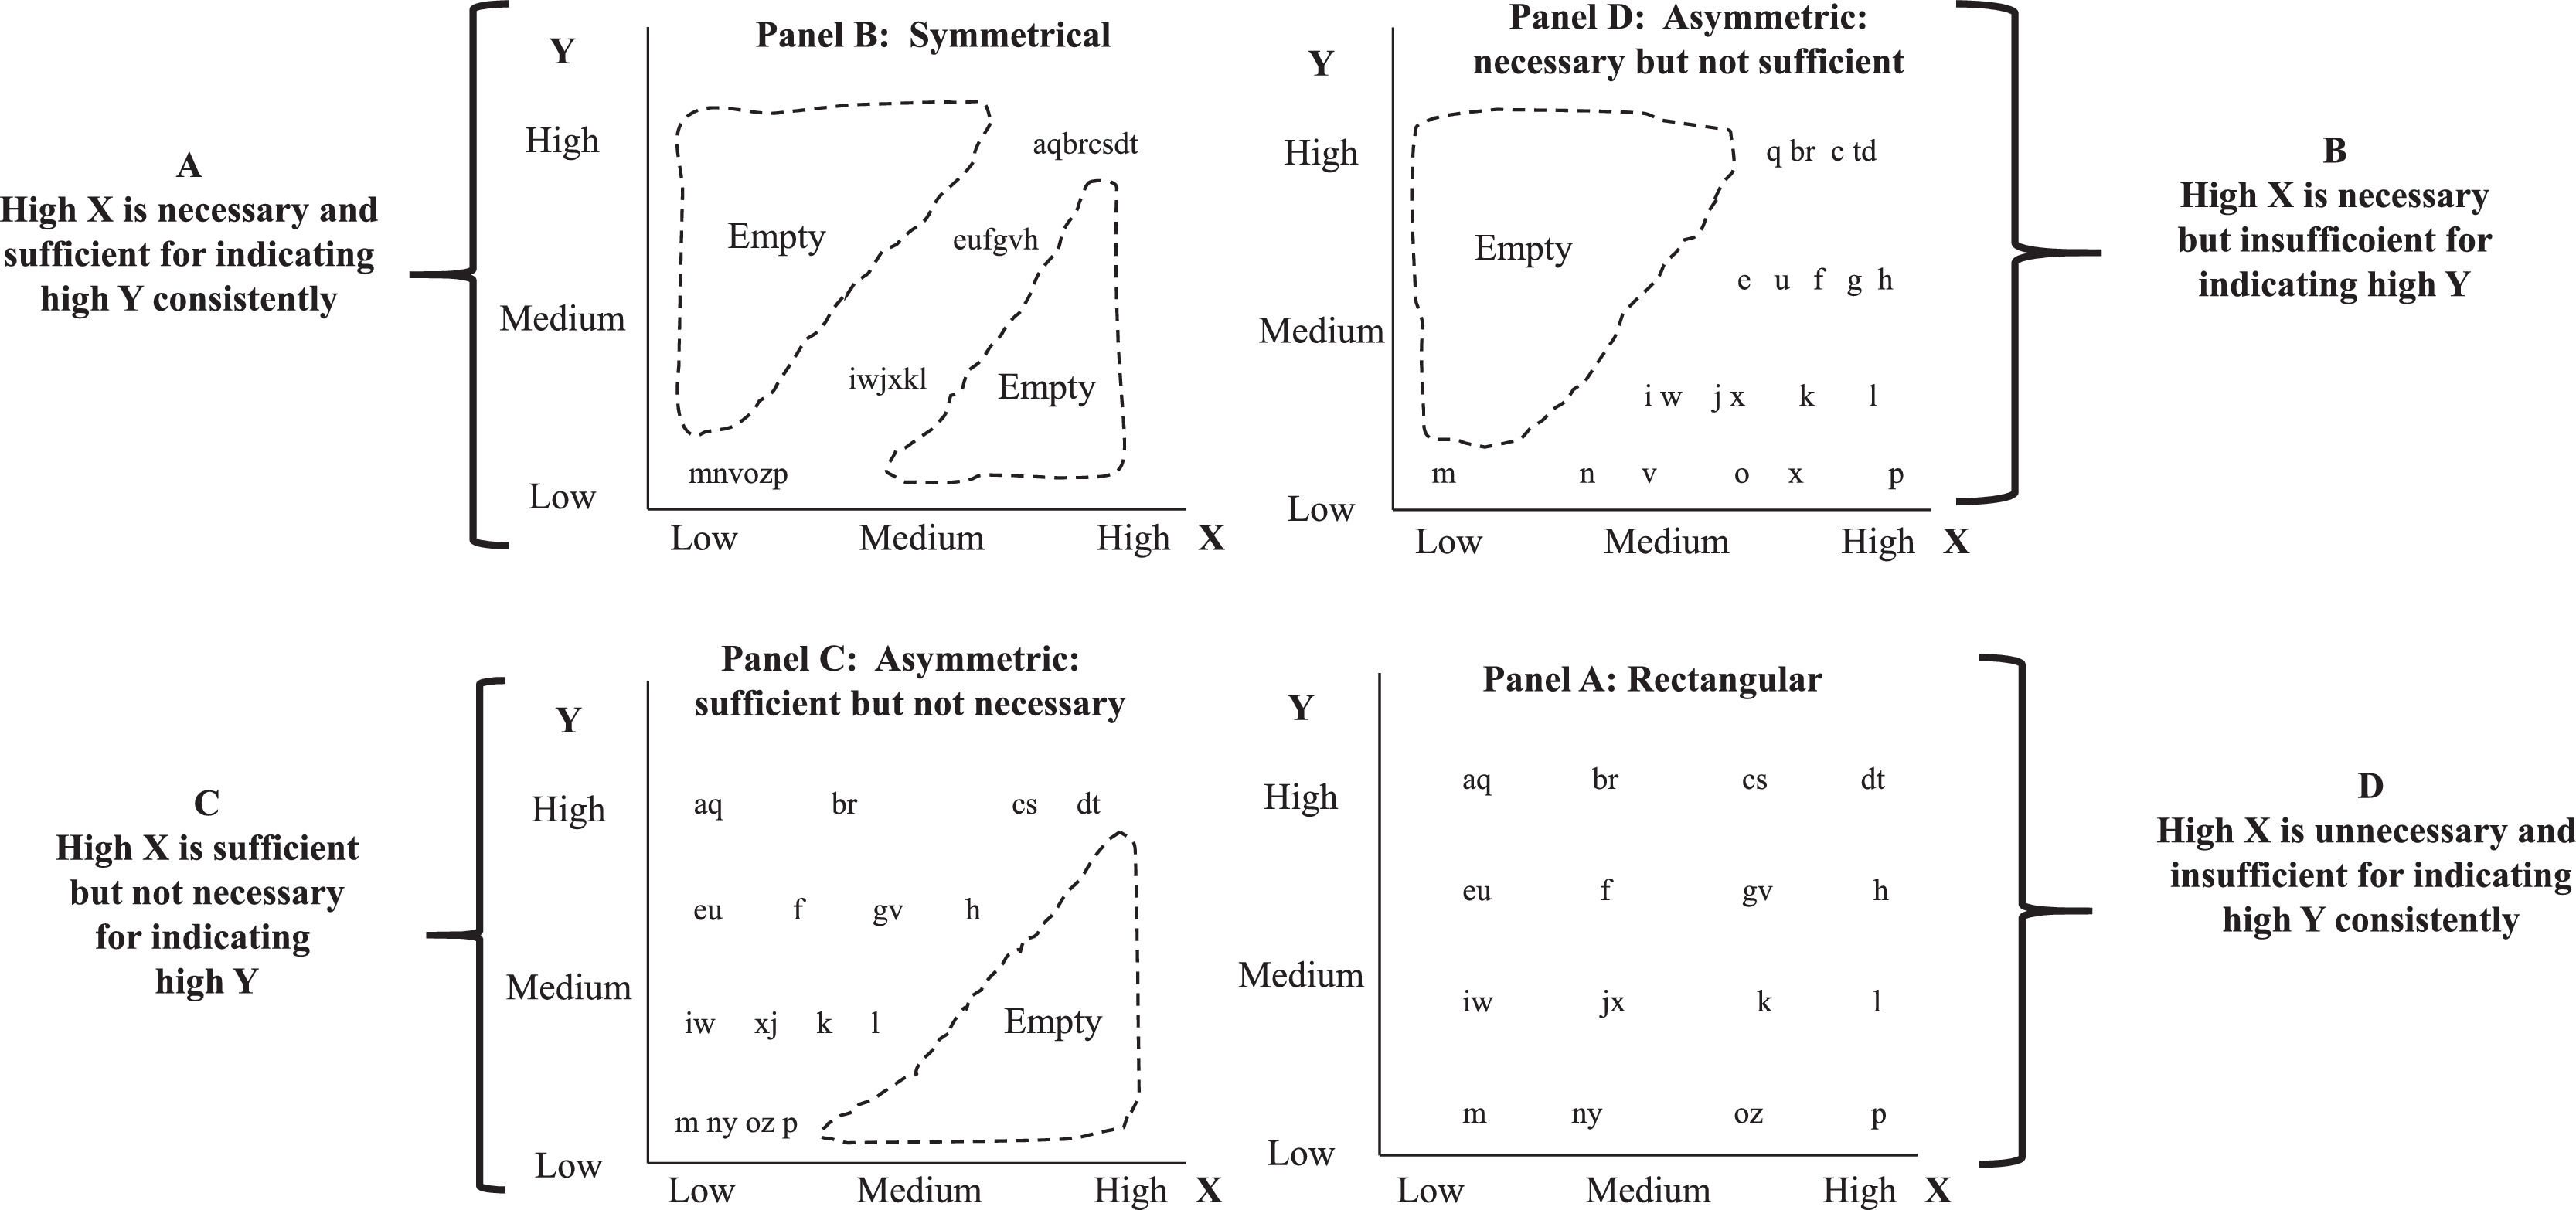
For further clarification of the discussion about complexity tenets, the four XY plots in Fig. 4 illustrate four possible findings—curvilinear findings are absent from Fig. 4. The XY plot in Panel A in Fig. 2 indicates that high X is necessary and sufficient for indicating high Y—and the association is symmetric with low X scores indicating low Y scores. The rectangular XY plot in Panel D in Fig. 4 indicates that high scores in X does not indicate high scores in Y, where X represents E●∼Gini●GDPppp and Y represents QOL. Sufficient but not necessary is indicated by the XY plot in Panel C—the four cases very high in X are all very high in Y. In Panel B: high X appears as necessary but high X is not sufficient for indicating high Y consistently. All cases with high Y scores are high in X but not all cases high in X are high in Y. In Panel D the findings are suggestive that identifying one or two single ingredients that enable shifting cases high in X but low in Y into the complex antecedent condition are necessary to improve how X impact Y. The findings below indicate that the democracy blooming model matches with Panel B and the adhocracy wilting model matches with Panel C.
 and Y is QOL. Dictionairy:E = ethical behavior; Gini; = Gini index; GDPppp = gross domestic production in purchase price parity units.")
Hypothetical Relationships where X is a complex configural condition and Y is an outcome conditino (e.g., X is a complex statement that conjoins singular conditions: E•∼Gini•GDPppp) and Y is QOL.
Dictionairy:E = ethical behavior; Gini; = Gini index; GDPppp = gross domestic production in purchase price parity units.
The study uses secondary data from six original sources for 24 nations. Data are available for more than 24 nations from each original source, but data across all conditions for testing the general theory are available only for the 24 nations in the study. Case-based asymmetric modeling seeks high consistency (e.g., odds are 4 to 1 or higher that a given outcome occurs). Fulfilling this search typically requires the use of two-to-six antecedent conditions that confirm in indicating the same given outcome condition. This idea has some similarities to an interaction term in a regression analysis. However, researchers rarely use three-or-four or five variable interaction terms because they are hard to interpret (see Fiss 2007)—and main effect terms often drop out of a stepwise regression model because of multicollinearity with the interaction term. Symmetric variable-based regression seeks to estimate the independent contribution to explaining the variance in the dependent variable holding the additional variables in the regression model constant, such estimating frequently eliminates one of two independent variables if the overlap is very high between them in explaining variance in the dependent variable. Multicollinearity (aka: overlap) is bad in regression analysis among independent variables; "overlap" is good in case outcome modeling because the overlap confirms that the same outcome occurs for cases among the antecedent conditions in the complex antecedent statement (AKA: screen, algorithm, recipe). Overlap overwhelms in regression analysis occurs when several independent variables are used in the model to the point that none of the b coefficients for interdependent terms are statistically significant even though the overall R2 is highly significant statistically. Consequently, Armstrong (2012) recommends using no more than two independent variables in regression models. The American Statistical Association (ASA, Wasserstein and Lazar 2016) recommends not relying on b coefficients and null hypothesis significance testing (NST) at all. In case outcome modeling; adding antecedent conditions in a model serves to improve accuracy usually but reduces coverage (i.e., numbers of case high in the antecedent condition among the cases high in the outcome condition) as a researcher moves to eliminate cases that do not indicate the outcome of interest.
Democracy indexSection 5 includes the following brief descriptions of the relevant source indexes providing the data for the present study. The Economist Intelligence Unit (EIU) Democracy Index if the foundational index for the present study. The Democracy Index measures the state of democracy in 167 countries. In addition to a numeric score and a ranking, the index categorizes each nation in one of four regime types: full democracies, flawed democracies, hybrid regimes and adhocracy regimes (EIU, 2012). The questions used for computing the Democracy Index are grouped into five categories: electoral process and pluralism, civil liberties, the functioning of government, political participation, and political culture. Each answer is converted to a score, either 0 or 1, or for the three-answer questions, 0, 0.5 or 1. With the exceptions mentioned below, within each category, the scores are added, multiplied by ten, and divided by the total number of questions within the category. There are a few modifying dependencies, which are explained much more precisely than the main rule procedures. In a few cases, an answer yielding zero for one question voids another question (e.g., if the elections for the national legislature and head of government are not considered free, then the next question, "Are elections... fair?", is not considered, but automatically scored zero). Likewise, there are a few questions considered so important that a low score on them yields a penalty on the total score sum for their respective categories, namely: "Whether national elections are free and fair"; "The security of voters"; "The influence of foreign powers on government"; "The capability of the civil servants to implement policies". The five category indices are then averaged to find the Democracy Index for a given country (EIU, 2012). The present study included calibrating the EIU Democracy Index nations’ numerical scores for the year 2018.
Ethical behavior indexThe study included using country-level data in the “Corruption Perception Index” (Transparency International, 2015). Ethical behavior was computed to be the negation of the calibrated country scores for corruption. For example, the calibrated corruption membership score for Mexico equals 0.98; thus, Mexico's ethical behavior score equals 0.02 (i.e., 1.00–0.98 = 0.02).
Gross domestic product in purchasing price parity dollars per capitaWorld Economic Outlook estimates (2019) estimates were used as the data source for GDPppp by nation. GDP (PPP) per capita is sometimes used as an indicator of a nation's standard of living, although this indicator is problematic because GDP per capita is not a measure of household personal income. Note in the findings below that GDPppp is exceptionally high Ireland. The Irish GDP data is subject to material distortion by the tax planning activities of foreign multinationals in Ireland. 2015 Irish GDP was over 150% of 2015 Irish gross national income (GNI) (World Economic Outlook, 2019).
Gini indexThe Gini coefficient measures the inequality among values of a frequency distribution (for example, levels of income). A Gini coefficient of zero expresses perfect equality, where all values are the same (for example, where everyone has the same income). A Gini coefficient of one (or 100%) expresses maximal inequality among values (e.g., for a large number of people, where only one person has all the income or consumption, and all others have none, the Gini coefficient will be very nearly one) (Gini, 1936). Both the United Nations and the U.S. Central Intelligence Agency provides Gini index estimates by nation; both sets of estimates are available at List of countries by income inequality (2020). Here are a few examples of Gini indexes by size by nation from the CIA: Denmark and Sweden: 25 for each, Austria: 26, Australia: 30, UK: 32; Spain: 34; Turkey: 40, USA: 47; and Zambia: 57. The estimates are from different years—a limitation of the data used by this study. However, comparing the data from different sources (i.e., UN versus CIA) for different years confirm that the comparisons by nations indicate the same general conclusions. The U.S. has the highest Gini index, and the U.S. Gini is increasing since 2000—one of the reasons that the U.S. has dropped from the set of full to flawed democracies starting in 2016 has been the comparatively rise in economic inequality in the U.S.
Quality-of-life (QOL) indexSeveral sources (HDI, 2020; Numbeo, 2020a) are available that provide estimates of individual nations’ QOL. These estimates provide high consistencies—nations in the top twenty versus bottom twenty on one list appear frequently in the same general top twenty versus bottom twenty of the other lists. Numbeo (2020a) provides a useful “Quality-of-life Index” (higher is better) that estimates a nation's overall quality-of-life by using an empirical formula which takes into account purchasing power index (higher is better), pollution index (lower is better), house price to income ratio (lower is better), cost of living index (lower is better), safety index (higher is better), health care index (higher is better), traffic commute time index (lower is better) and climate index (higher is better). The top five nations in QOL in the Numbeo (2020a) list include Denmark, Switzerland, Finland, Australia, and the Netherlands.
Another QOL index that is distinct from Numbeo (2020a is the United Nations Development Program (UNDP). The UNDP ranks countries into four tiers of human development; by combining measurements of life expectancy, education, and per capita income into the Human Development Index (HDI) in its annual Human Development Report. The top five nations using the HDI include: Norway (0.95), Switzerland (0.95), Ireland (0.94), Germany (0.94), and Hong Kong, (0.94) (HDI, 2020). Estimates for QOL for four different scales are available at the following link: https://worldpopulationreview.com/country-rankings/standard-of-living-by-country.
To avoid having the same high (low) GDPppp as both an antecedent and as an ingredient in the QOL outcome condition, the present study included creating a QOL index (i.e., “Own_QOL”) that is distinct from Numbeo (2020) QOL index, the HDI (2020), or other scales. “Own_QOL” includes combined scores for five conditions for each of the 24 nations: safety, healthcare, property price by income, clean air (i.e., negation of pollution, and life expectancy. For each of these five conditions, the raw scores were converted to calibrated scores; the five calibrated scores were summed, and the summed calibrated scores were calibrated from 0.00 to 1.00. The summed scores for these five scores ranged from 4.55 (Australia) to 1.91 (Turkey). Finally, the summed scores were calibrated and these calibrations range 0.98 (Australia) to 0.01 (Turkey). All scores are available upon request from the authors. The correlations among these five separate QOL conditions are all positive and modest ranging from 0.18 to 0.59. These findings indicate that five conditions contribute uniquely to estimating the nations’ QOL combination scores.
The data in the present study include files: 2020 safety index scores by country (Numbeo, 2020a); healthcare quality index scores (CEO Magazine, 2021); property prices by income (Numbeo 2020b); clean air index (i.e., the negation of calibrated scores of nations for the pollution index, Numbeo 2020c); and calibrated life expectancy country scores were provided by the United Nations Population Prospects 2019 (Statistica, 2020_
The happiness indexFor happiness data, the present study relies on data from Helliwell et al. (2019), The World Happiness Report (WHR). The “Cantril ladder” is the principal measure used to measure happiness in 156 nations in the WHR. The Cantril Ladder asks survey respondents to place the status of their lives on a “ladder” scale ranging from 0 to 10, where 0 means the worst possible life and 10 the best possible life. The Cantril ladder is a subjective measure of happiness. The development of objective measure of happiness is beyond the scope of the present study. Very likely, once developed, if ever, data from an objective measure will symmetrically associate “significantly statistically” with subjective measures such as the Cantril ladder. However, from a case outcome modeling perspective, four corner classifications are likely to each identify a few to many nations with high scores in both, the first but not the second, the second but not the first, and the negation subjective and objective happiness (i.e., nations high in unhappiness for this fourth group). This proposal is worth considering in future case outcome modeling and reporting of happiness.
According to the findings in the Helliwell et al. (2019 report, Finland (7.77), on the 10-point Cantril ladder) is the happiest nation in the world. Denmark (7.60), Norway (7.55), Iceland (7.49) and the Netherlands (7.49) rank 2 to 5, respectively. The U.K. (7.05) ranks 15th, Germany (6.98) is 17th, Belgium (6.92) is 18th, the USA (6.89) is 19th, Spain (6.35) is 30th, Turkey (5.37) is 79th, and India (4.01) is 140th. At the lowest rank in all available happiness data, South Sudan (2.85) at 156th is the most unhappy nation in the 2019 report. Identifying nations with happiness scores above 7.0 to be “very happy”, sixteen nations qualify from Finland to Ireland. Eleven of these sixteen very happy nations are in Europe, and none are in Asia. Both Australia and New Zealand are very happy nations. With scores 6.00 to 6.99, 35 nations are classifiable as being “happy.” With scores 5.00 to 5.99, 44 nations are “marginally happy.” With scores 4.00 to 4.99, 42 nations are “marginally unhappy. The remaining 16 nations are classifiable as being “seriously unhappy.” Turkey (5.37) ranks 79th and India (4.01) ranks 140th in the World Happiness Report, 2019. The present study includes Turkey and India but all the nations with average scores below 5.00 but India are absent from the present study. Future research needs to remove this limitation in further testing the blooming ad wilting models.
Calibrating variables into calibrated conditions scoresThe study included transforming all variable data into conditional calibrated scores. Calibrated membership scores for a condition are computed based on theory and knowledge of the distributions of variables for the data in the study. The fsQCA software enables the researcher to transform the variables data into logarithmic function, calibrated, conditional scores. The fsQCA software requires the researcher to identify the membership score indicating the “threshold for full membership” equal to a 0.95 score, the membership score equal to 0.50 representing “maximum ambiguity,” and the membership score of 0.05 representing the “threshold for full non-membership.” Using these three scores, the software applies a logarithmic function to transform (i.e., calibrate) the raw scores into calibrated scores ranging from 0.0 to 1.00. Consequently, the resulting calibrated scores include no “statistical outliers”—very high scores and extremely high scores are equal to 1.00 calibrated scores, and very low scores and extremely low scores are equal to 0.00. Calibrated scores are not values but are membership qualification scores of a condition (Ragin, 2008). Note that asymmetric analysis makes use of the term “condition,” rather than the symmetric nomenclature for “variable.” The calibration procedure is robust, and outcomes and interpretation of outcomes are usually very clear. For example, the findings and interpretation of these findings do not change substantively based on using fully non-membership scores covering 5 to 20% of the cases below the threshold, and the same perspective applies for full membership threshold scores equating to 5 or 20% above the threshold.
For the present study, typically the value indicating that 90th percentile of the country scores were higher was selected at the 0.95 full-membership score, the median value was selected as the 0.50 membership score for maximum ambiguity, and the value indicating that 10th percentile of the country scores was selected as the 0.05 calibrated membership score. The original data set is available from the corresponding author for readers who want to examine different break (i.e., inflection) points indicating full membership threshold, threshold for maximum ambiguity, and threshold for full non-membership. For calibrated happiness membership scores and a larger data set (e.g., n > 75) with a minimum of 8 cases from each of the five happiness levels (very happy to seriously unhappy), a useful recommendation is to use the following thresholds: 7.0 for the 0.95 threshold for full membership in very happy, 5.5 for the 0.50 threshold for maximum ambiguity, and 3.0 for the threshold for seriously unhappy.
Estimating the impact of antecedent configuration conditions on outcomesA consistency coefficient (C1) indicates the level of accuracy that high scores in an asymmetric configuration associate with high scores in a specific outcome of interest. The consistency index in asymmetric testing is analogous to a correlation (r) in symmetric testing. However, unlike a correlation coefficient, low scores of a configuration do not influence a consistency coefficient since C1 is a measure of asymmetry and not symmetry. A coverage coefficient (C2) indicates the share of cases having high outcome scores applicable for the specific antecedent configuration. C2 is the asymmetric measure analogous to the coefficient of determination (r2) in symmetric analysis. However, unlike the “coefficient of determination” (i.e., r2) estimates increase when terms are adding to a regression model, C2 estimates decline as a researcher adds additional factors in an antecedent configuration because the researcher is adding restrictions to the applicability of a configuration by adding additional conditions. For the present study, the requirement was set that a model's consistency (C1)—for a complex antecedent configuration of antecedent conditions—the computed C1 needs to be equal or above 0.85 to conclude that the model has high consistency in predicting high scores for the focal outcome condition. For the purposes of the present study, a conclusion was set ex ante that a model's coverage (C2) must be equal or above 0.10 for the model to be judged as having high coverage. Frequently, to achieve C1 ≥ 0.85, C2 is equal or less than 0.05; such findings are useful for identifying complex antecedent conditions indicating a few cases (e.g., countries) with high scores on the focal outcome condition.
A researcher benefits from looking at the XY plot for such models that achieve high consistency whether or not coverage is high. In asymmetric modeling, high C1 is often achievable only when C2 is low; this perspective is another way of stating that contrarian cases occur in a set of data. The equifinality tenet in complexity theory that more than one path occurs for reaching the same outcome. The findings section includes C1, C2, and XY plots of all the findings in testing the democracy blooming and adhocracy wilting models.
FindingsThis section presents the findings for the democracy blooming model first and the adhocracy wilting model second. The findings provide modest to strong support for the democracy blooming model and strong support for the adhocracy wilting model.
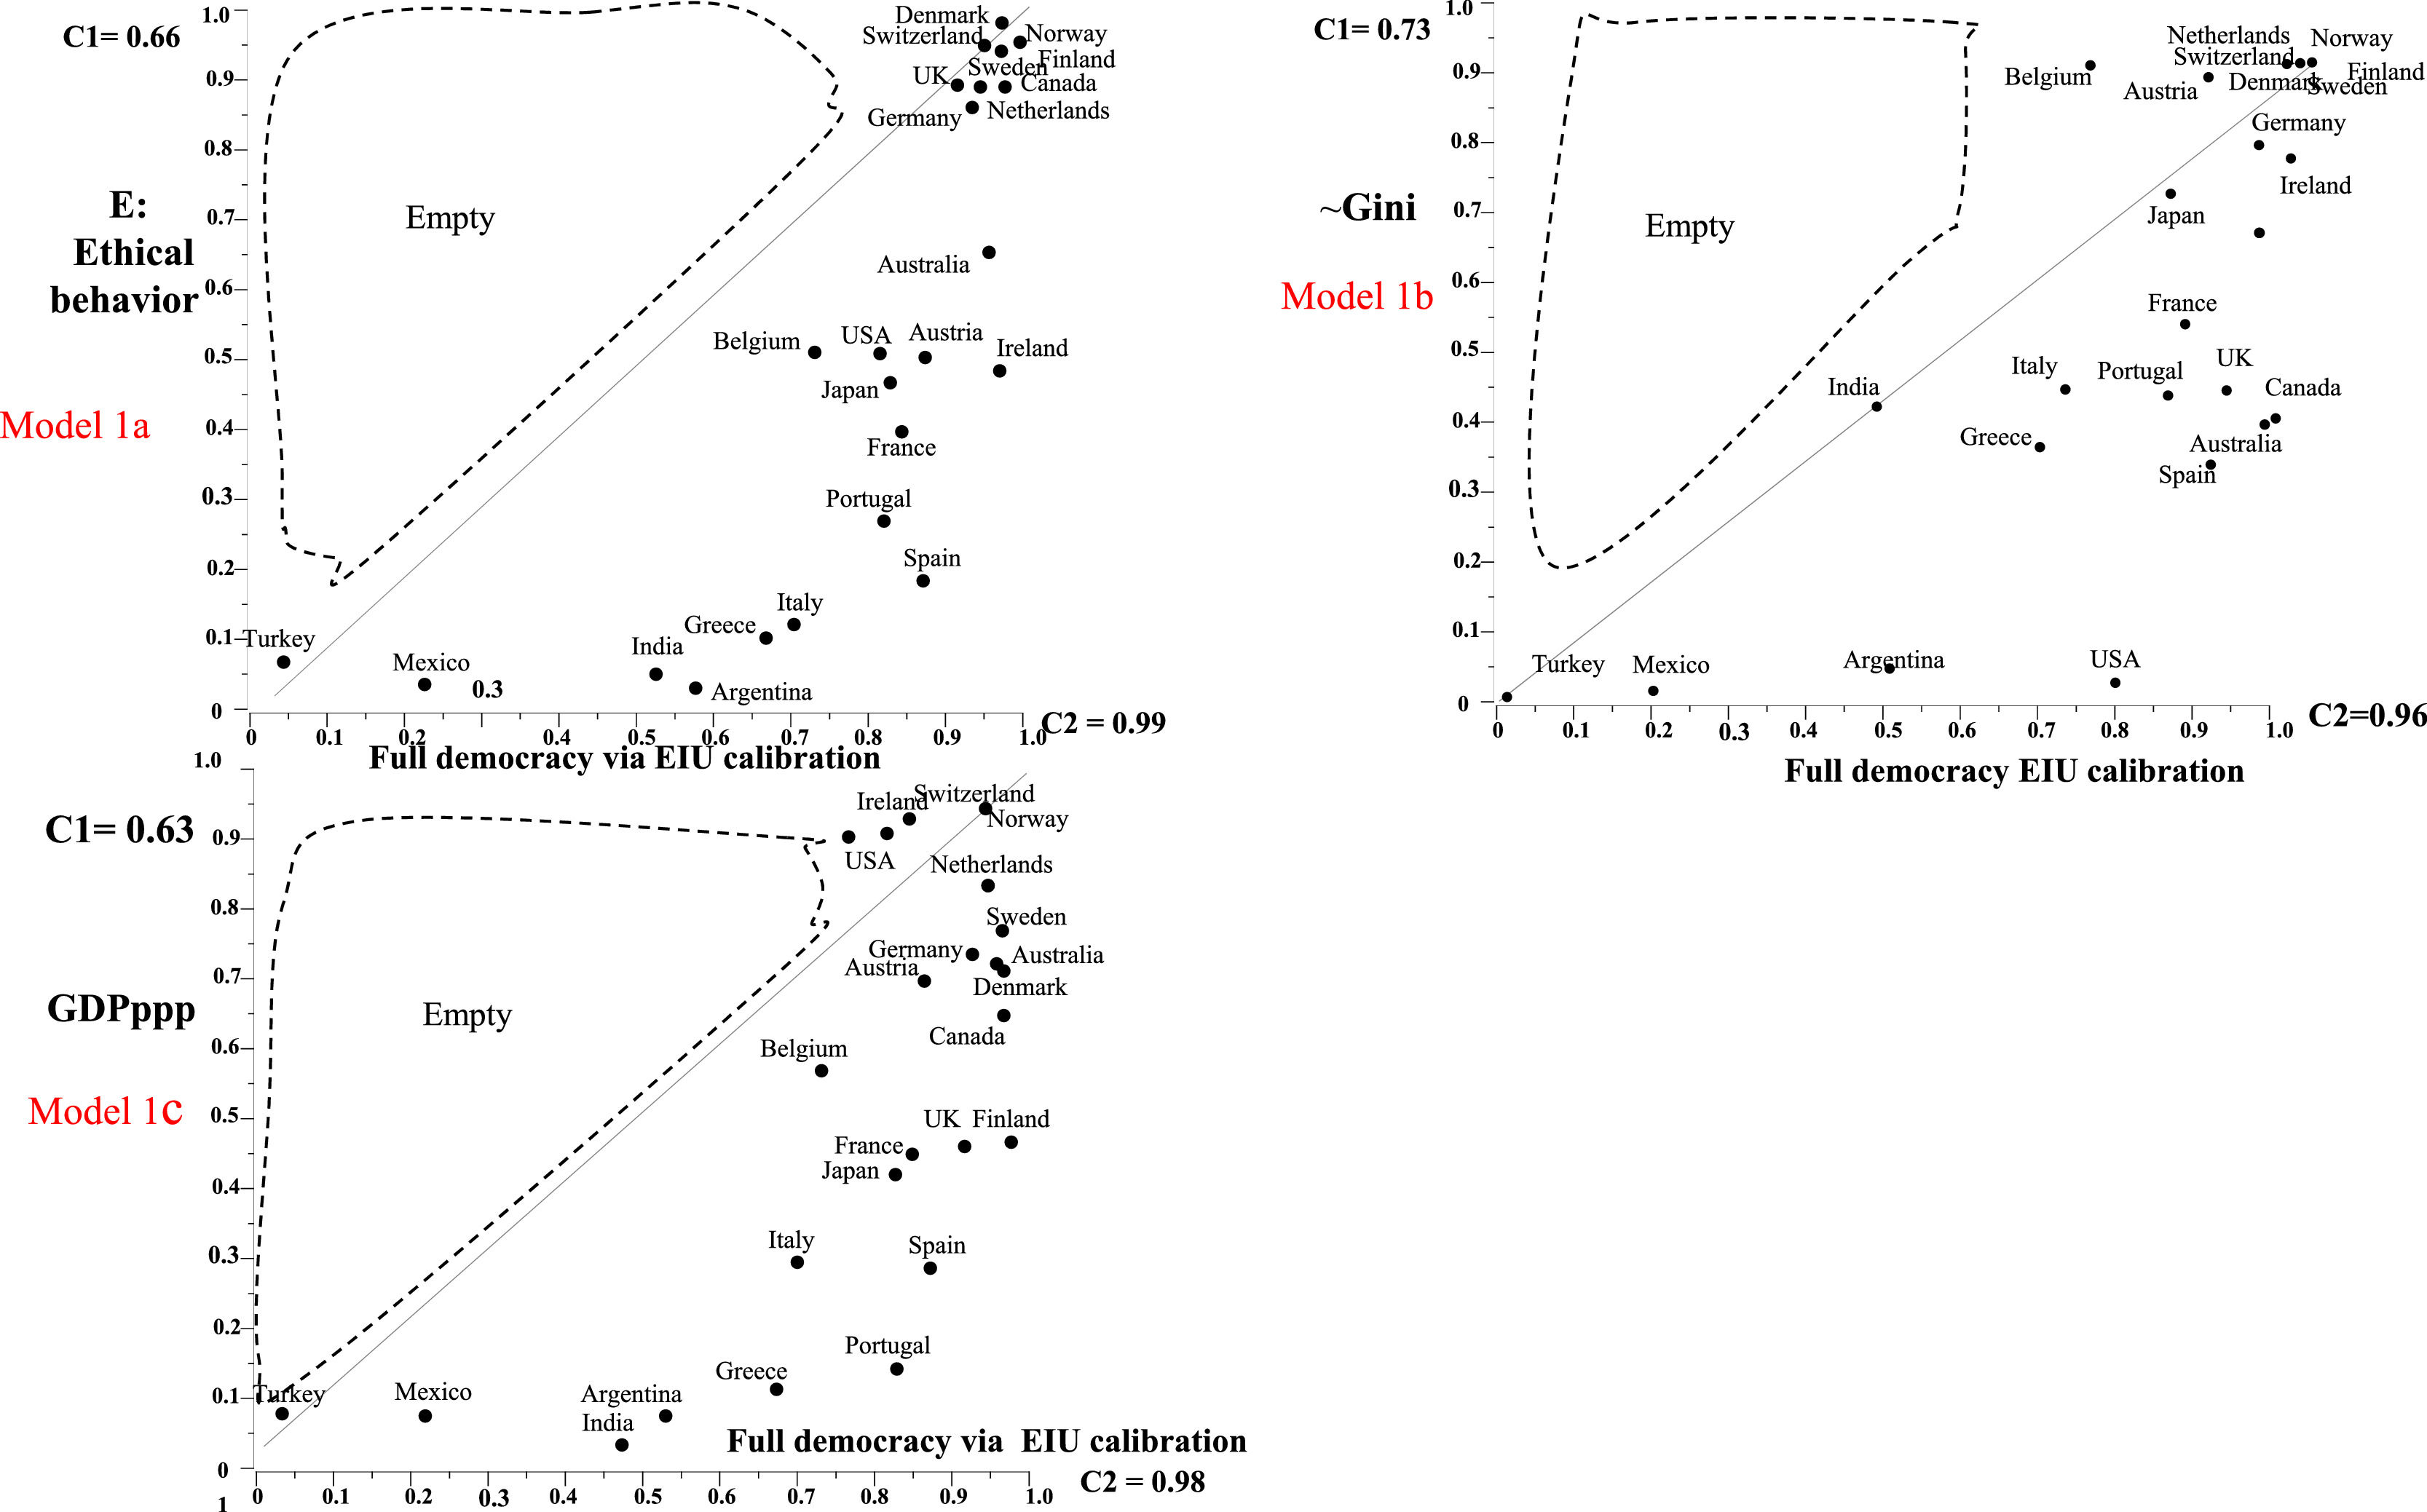
Findings for the democracy blooming model (stage 1): full democracy and the three bloomsBased on calibrating democracy index values in the EIU data, Fig. 5a includes XY plots for nations high to low in being full democracies indicating each of the three blooms in Fig. 3a. Fig. 5b is the XY plot for nations high to low in being full democracies and the three blooms using democracy index values from the Peace World Organization (PWO) The three XY plots have very similar patterns within both Fig. 5a and b and the patterns indicate that full democracy is a necessary but insufficient condition for indicating only nations that are full democracies have high scores for each for ethical high ethical behavior, high negation of Gini, and high GDPppp. Fig. 5a and b show that different full democracies have high and low scores for each of these three blooms. The three consistency indexes for the models in Fig. 5a and b indicate that all the models are inadequate in indicating nations high in full democracy only have high scores for each outcome. However, the three patterns are the same: none of the nations with low scores on full democracy have high scores in ethical behavior, ∼Gini, and GDPppp. Consequently, the findings provide limited support for models 1a, 1b, and 1c; the consistency indexes are below 0.85—while several full democracy nations have high ethical behavior, high income equality, and high GDPppp, a few full democracies have low scores for each of these three outcomes.


a. Stage 1 blooming findings indicate that full democracy is a necessary antecedent condition for high ethical behavior, high ∼Gini, and high GDPppp.
Dictionary: C1 = consistency index; C2 = coverage index
b. Stage 1 blooming findings Full democracy as a necessary antecedent condition indicating ethical behavior, ∼Gini, and GDPppp.
Dictionary: C1 = consistency index; C2 = coverage index
PWO = Peace Worldwide Organization.
The following nations are full democracies having high scores for all three blooming outcomes: Denmark, Finland, Germany, Netherlands, Norway, and Switzerland. Contrary to these findings, Spain stands outs in particular as a nation in full democracy and low in ethical behavior (Fig. 5a). The USA has comparatively high Gini index. Portugal stands out as being a full democracy and not achieving a high GDPppp. The main conclusion from examining Fig. 5a and b is that near-full and full democracy status are necessary but insufficient for consistently identifying blooming characteristics likely to indicate nations high in QOL.
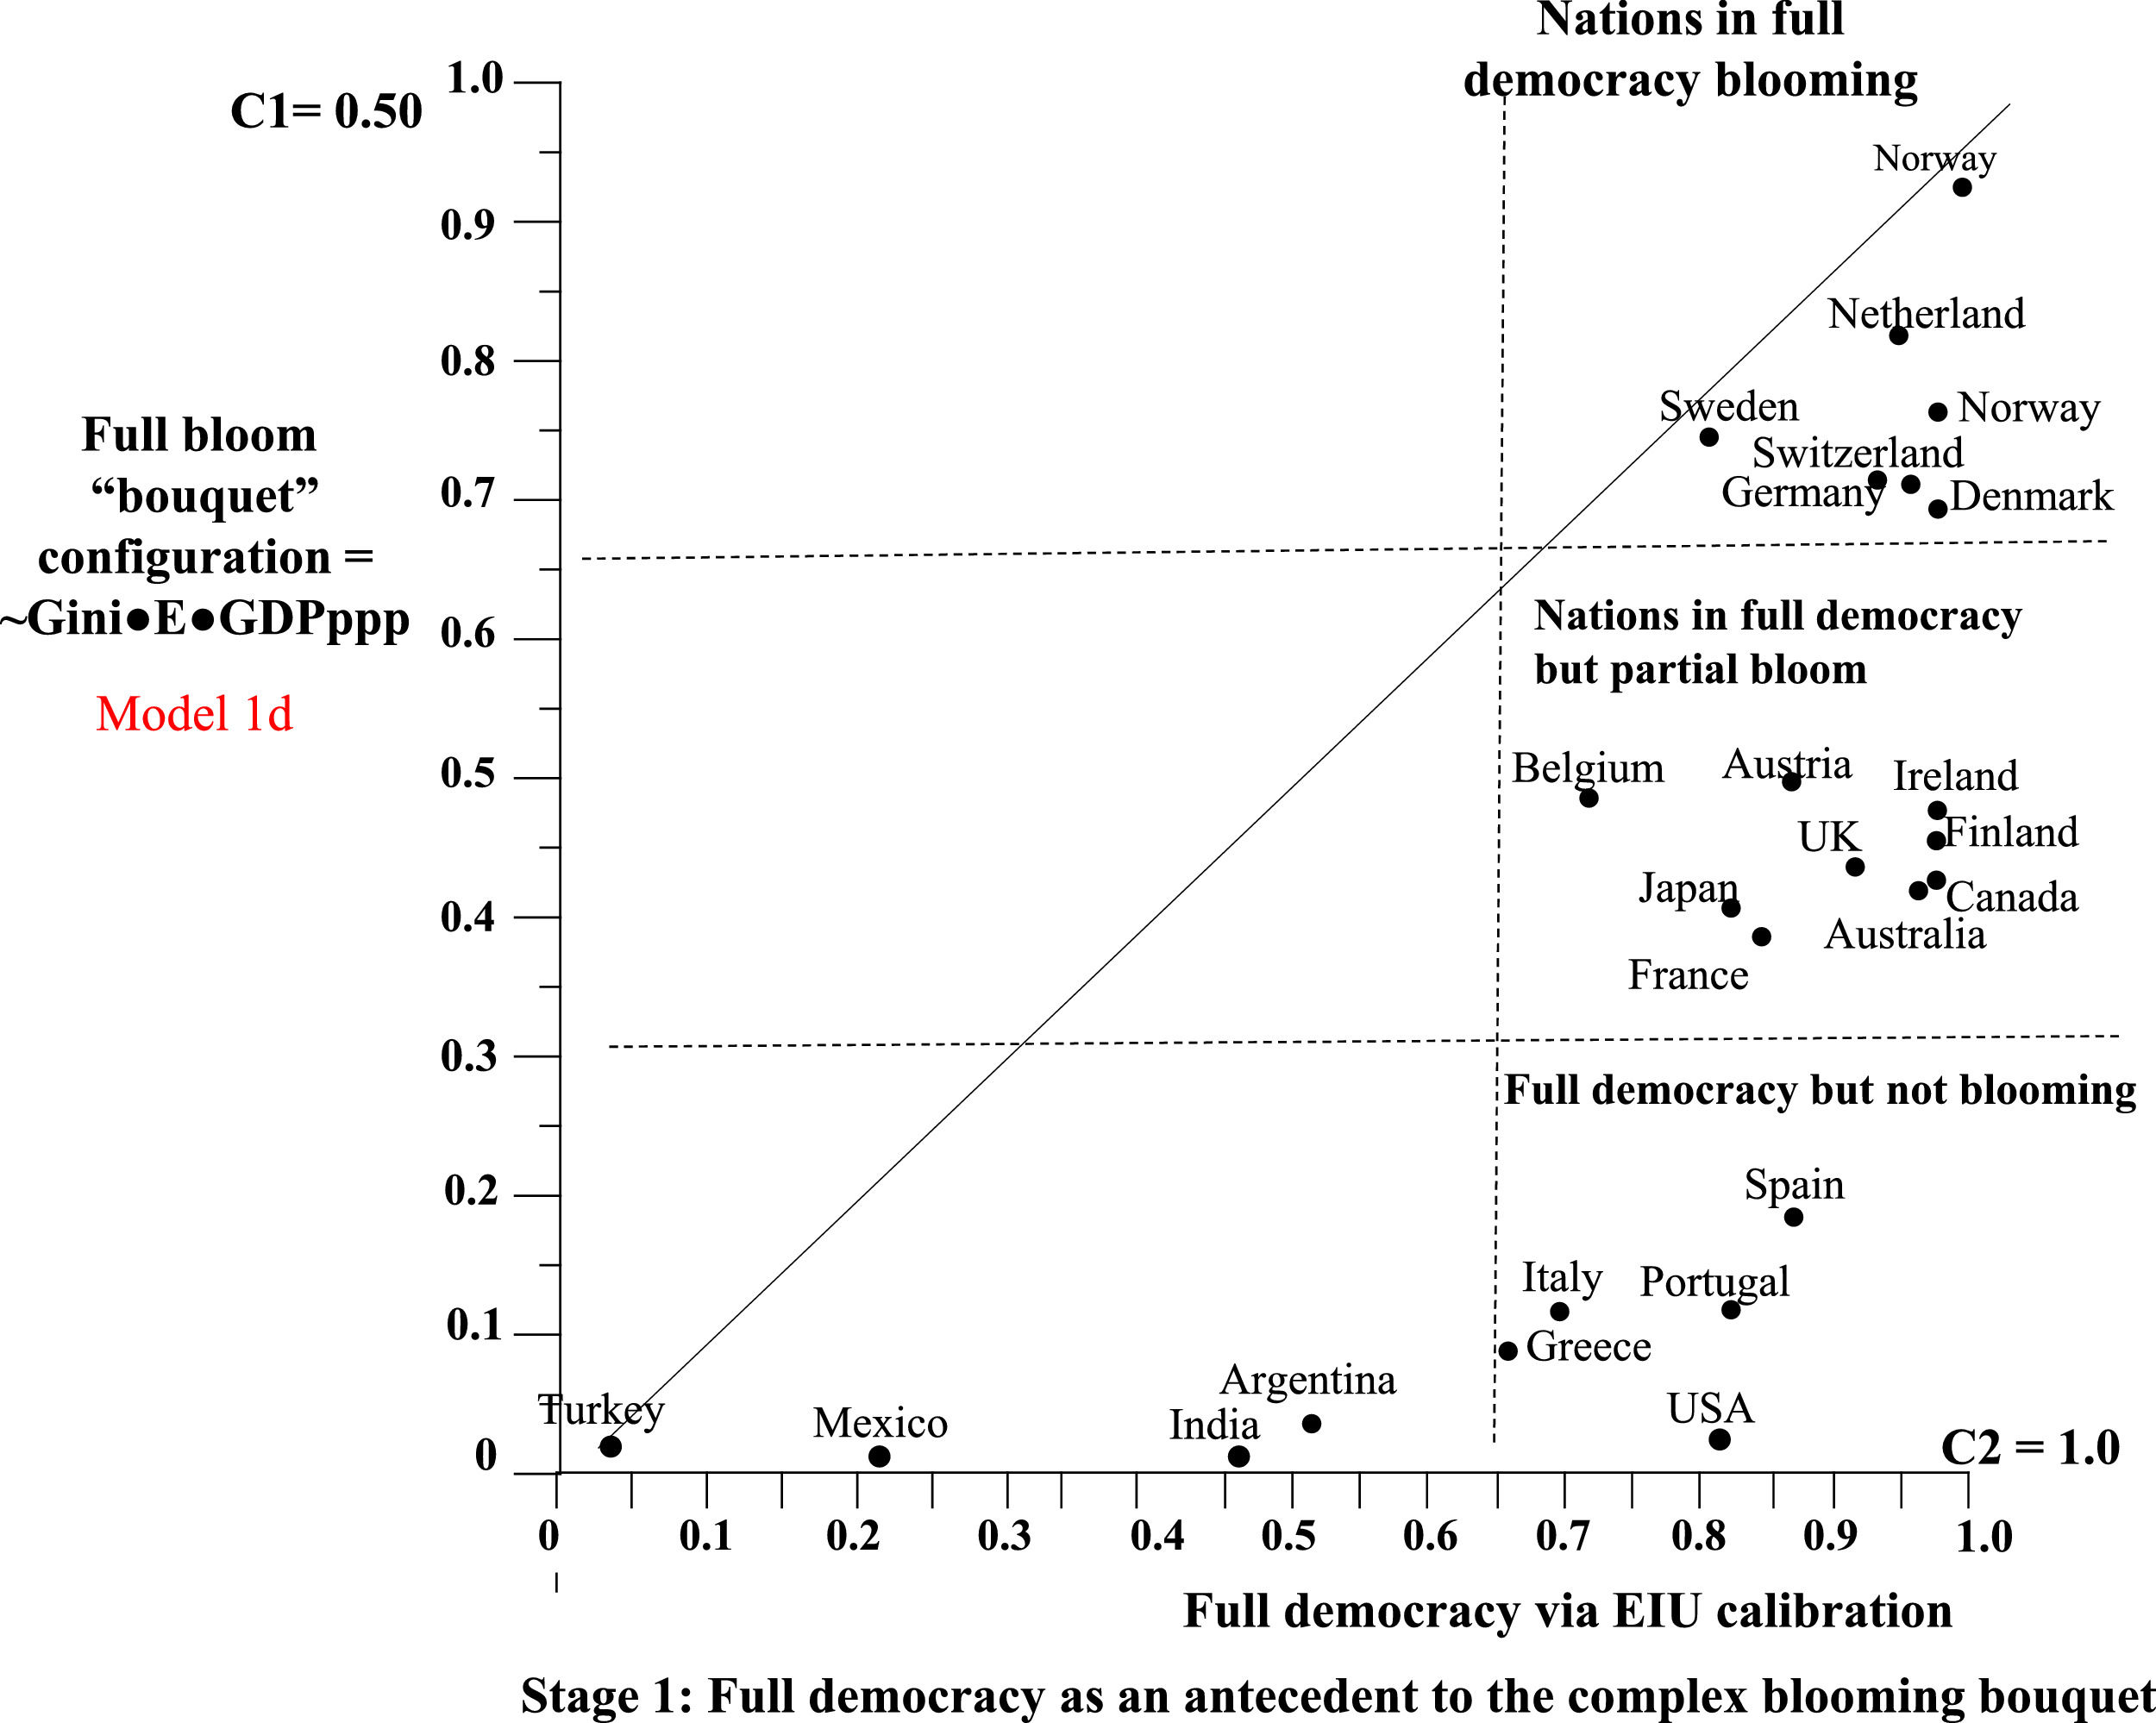
Testing the veracity of model 1d: Fig. 6 shows full democracy antecedent and the complex bloom bouquet outcome findings. All nations capable of creating the complex blooming bouquet of the three bloom behaviors appear at the top right in Fig. 6. Full blooming-bouquet membership requires high membership scores across each of all three blooming characteristics. Using Boolean algebra, a low score in one of the three blooms reduces the total bloom scores to equal the lowest score on any one of the blooms. Thus, while the USA has high membership scores on GDPppp and a modest membership score in ethical behavior, the USA's comparatively low membership score in the negation of Gini results in a low blooming bouquet membership score. The XY plot findings using WPO calibrated scores for democracy and the complex blooming bouquet are similar to the findings in Fig. 6 and these additional findings are available by request.

Full democracy's impact on blooming indicators of high QOL via EIU calibration.
Dictionary: E = ethical behavior; C1 = consistency index; C2 = coverage.
Commentary: The pattern in the XY plot indicates that full democracy is a necessary but insufficient condition for full achieving a blooming bouquet for high QOL.
General conclusion: models 1a-1d state that full democracy generates full blooms consistently and these models do not receive support. However, full democracy status is necessary even though not sufficient for generating each bloom and for the blooming bouquet configuration.
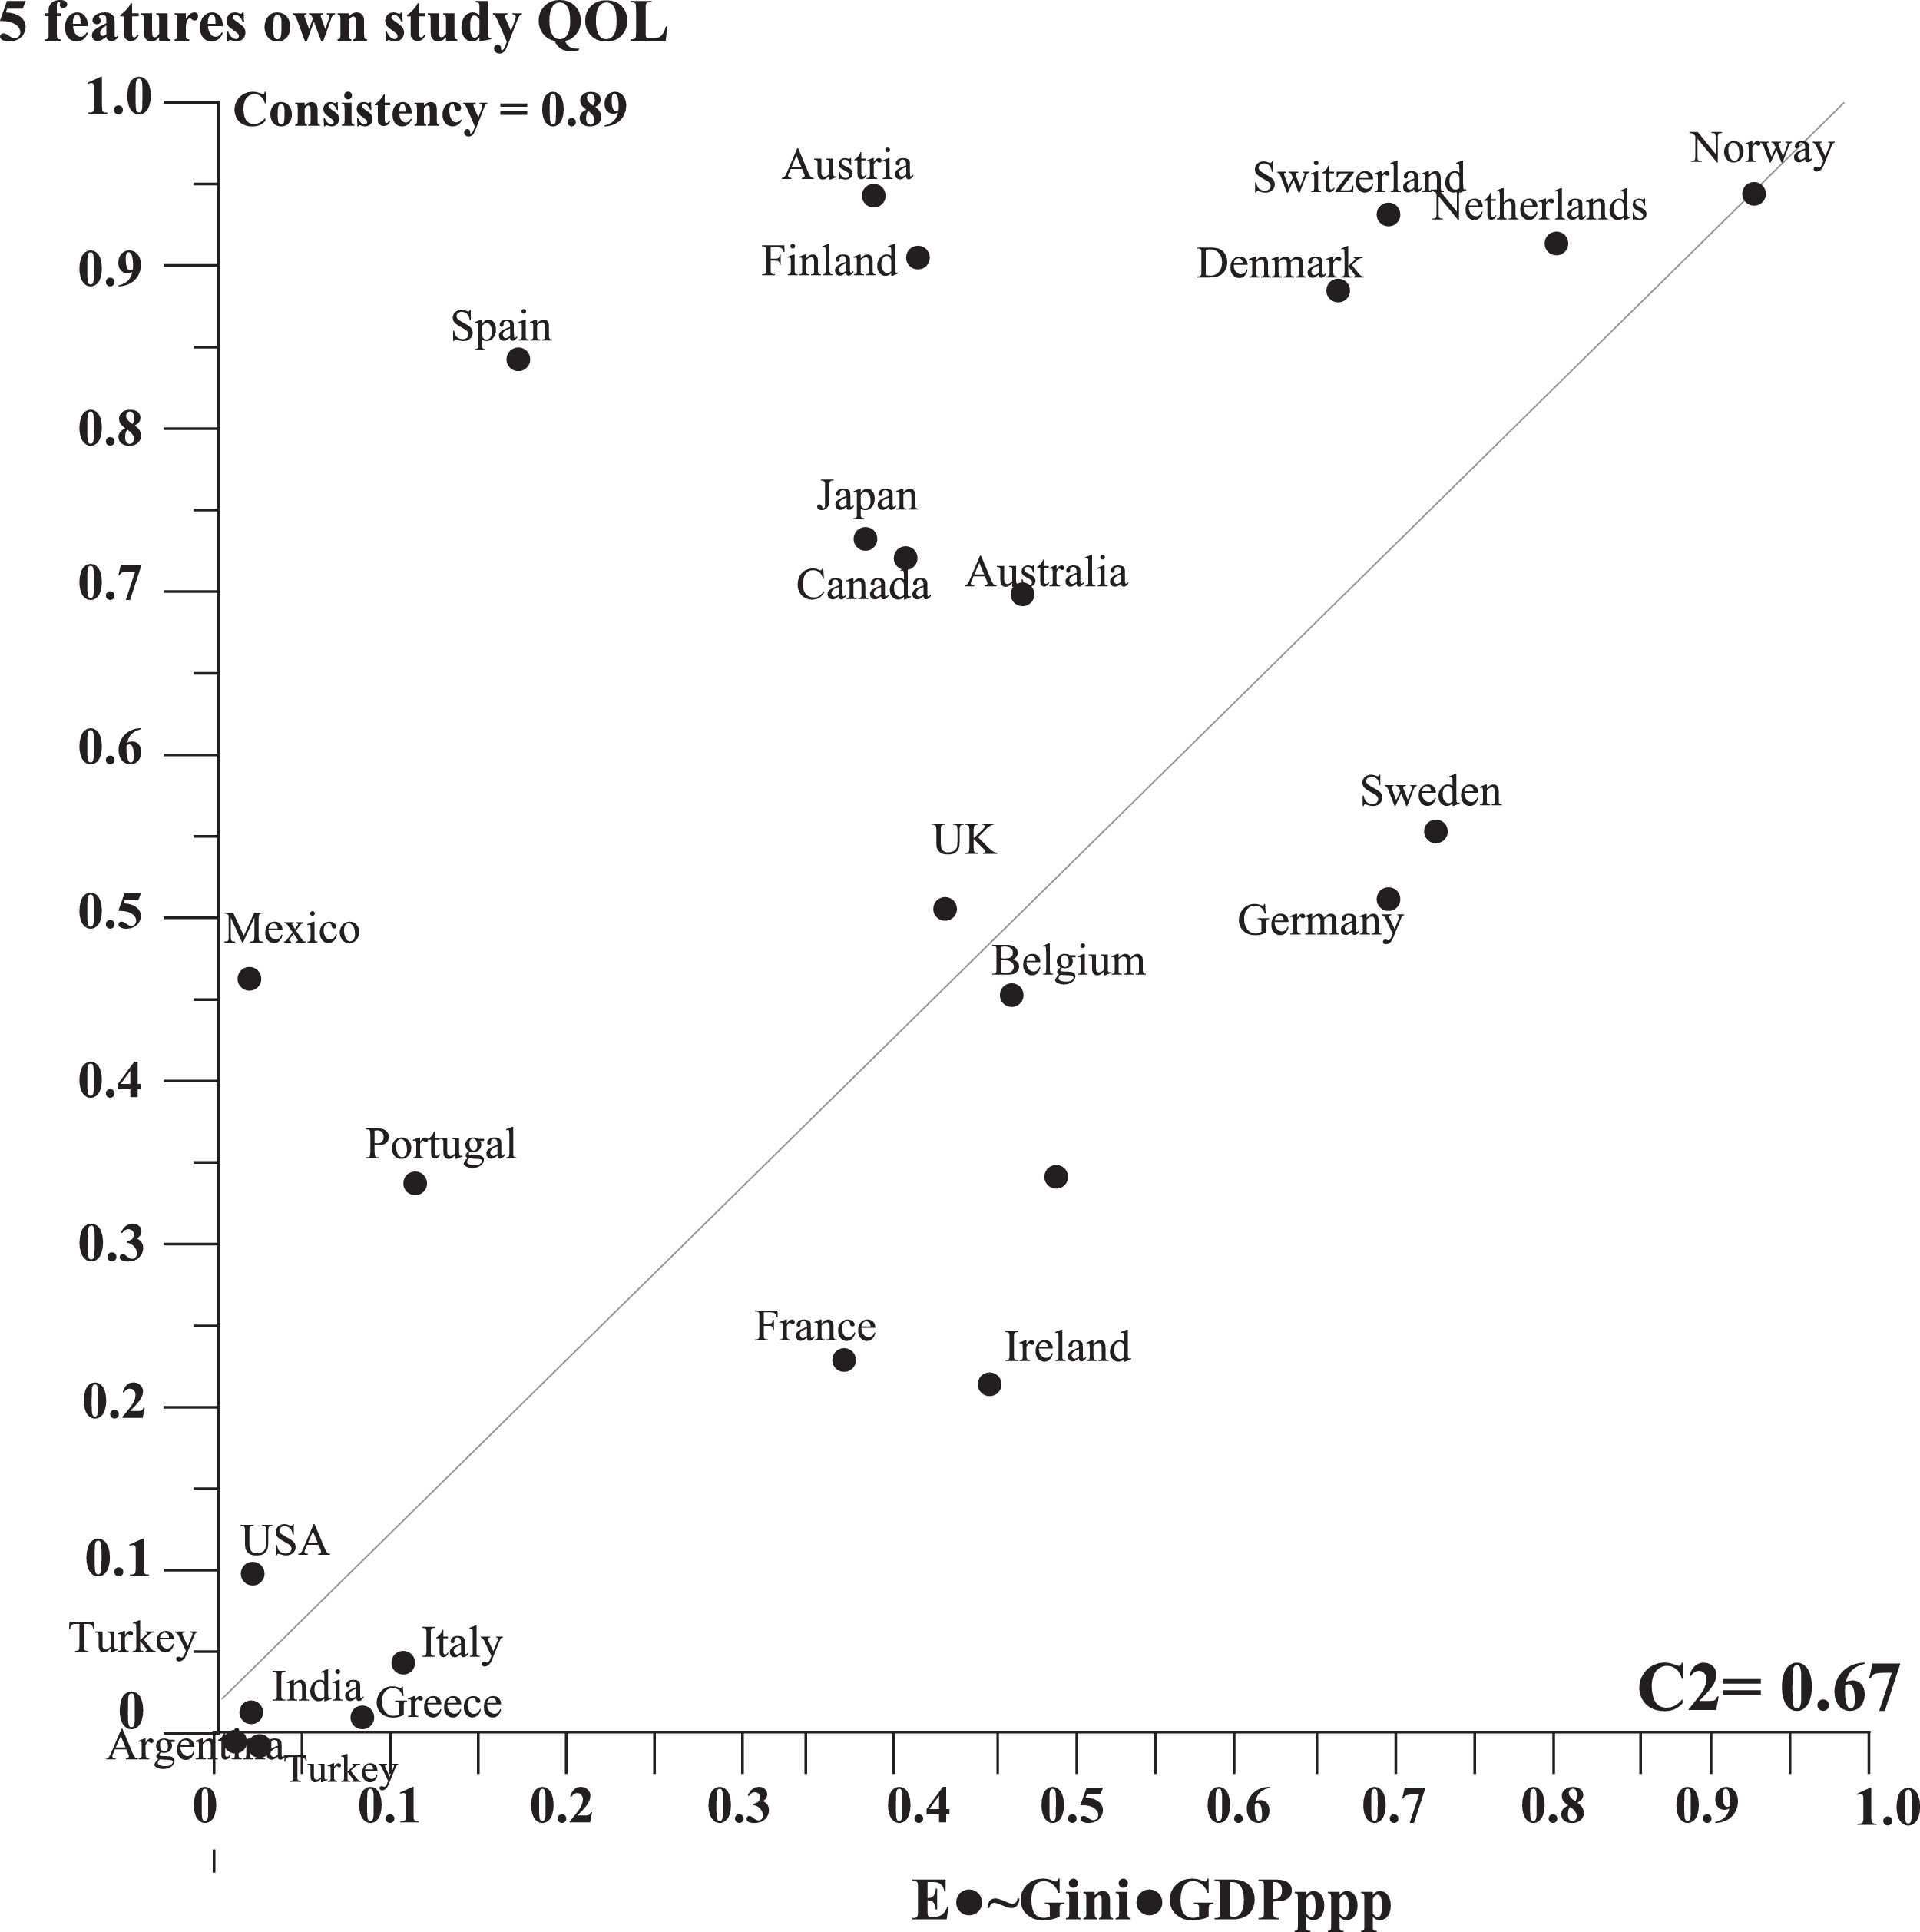
Findings for the democracy blooming model (stage 2): blooming bouquet indicates high QOLModel 2 is the essence of the democracy blooming bouquet model: ∼Gini●E●GDPppp → QOL, where “E” is high ethical behavior. The findings support model 2. The model is sufficient for indicating that all nations with high membership scores in the complex blooming bouquet of ∼Gini●E●GDPppp have high memberships in QOL. The consistency index (C1) is 0.89 and the coverage index (C2) is 0.67; the consistency index indicates high consistent accuracy; the coverage index indicates many nations high in QOL outcome have high membership scores in the antecedent condition. Fig. 7 presents details. Six of six nations with membership scores above 0.50 for the complex blooming bouquet have membership scores above 0.50 for QOL. These six nations include Denmark, Germany, Netherlands, Norway, Sweden, and Switzerland. Thus, the blooming bouquet in this study achieves high generality in always indicating high QOL. This conclusion needs additional testing for high generality via larger samples of nations than the sample in the present study.
 Commentary: Findings indicate blooming model is sufficient but not necessary for indicating high QOL.")
Of course, the complexity tenet of equifinality applies to the present study. The finding that nations with high democracy complex blooming bouquet scores indicating high QOL does not apply to all nations with high QOL scores. As Fig. 7 shows, the USA is the prime example of a contrarian case indicating a nation with a low blooming bouquet score still achieving a high QOL. Three separate models are necessary for indicating high consistency index scores for all nations using different configurations of Gini, E, and GDPppp for each model. While this study does not include showing the XY plot, high ethical behavior does indicate high negation in Gini among the nations in the study (i.e., C1 = 0.90 and C2 = 0.54). The USA is the most unique nation in the XY plot with a modest ethical behavior score and a low score in the negation of ∼Gini (i.e., the USA has comparatively high Gini. A nation with an ethical behavior calibrated membership score in the top quintile among all nations along with a top quintile Gini index membership score would be oxymoronic—a highly contrarian case.
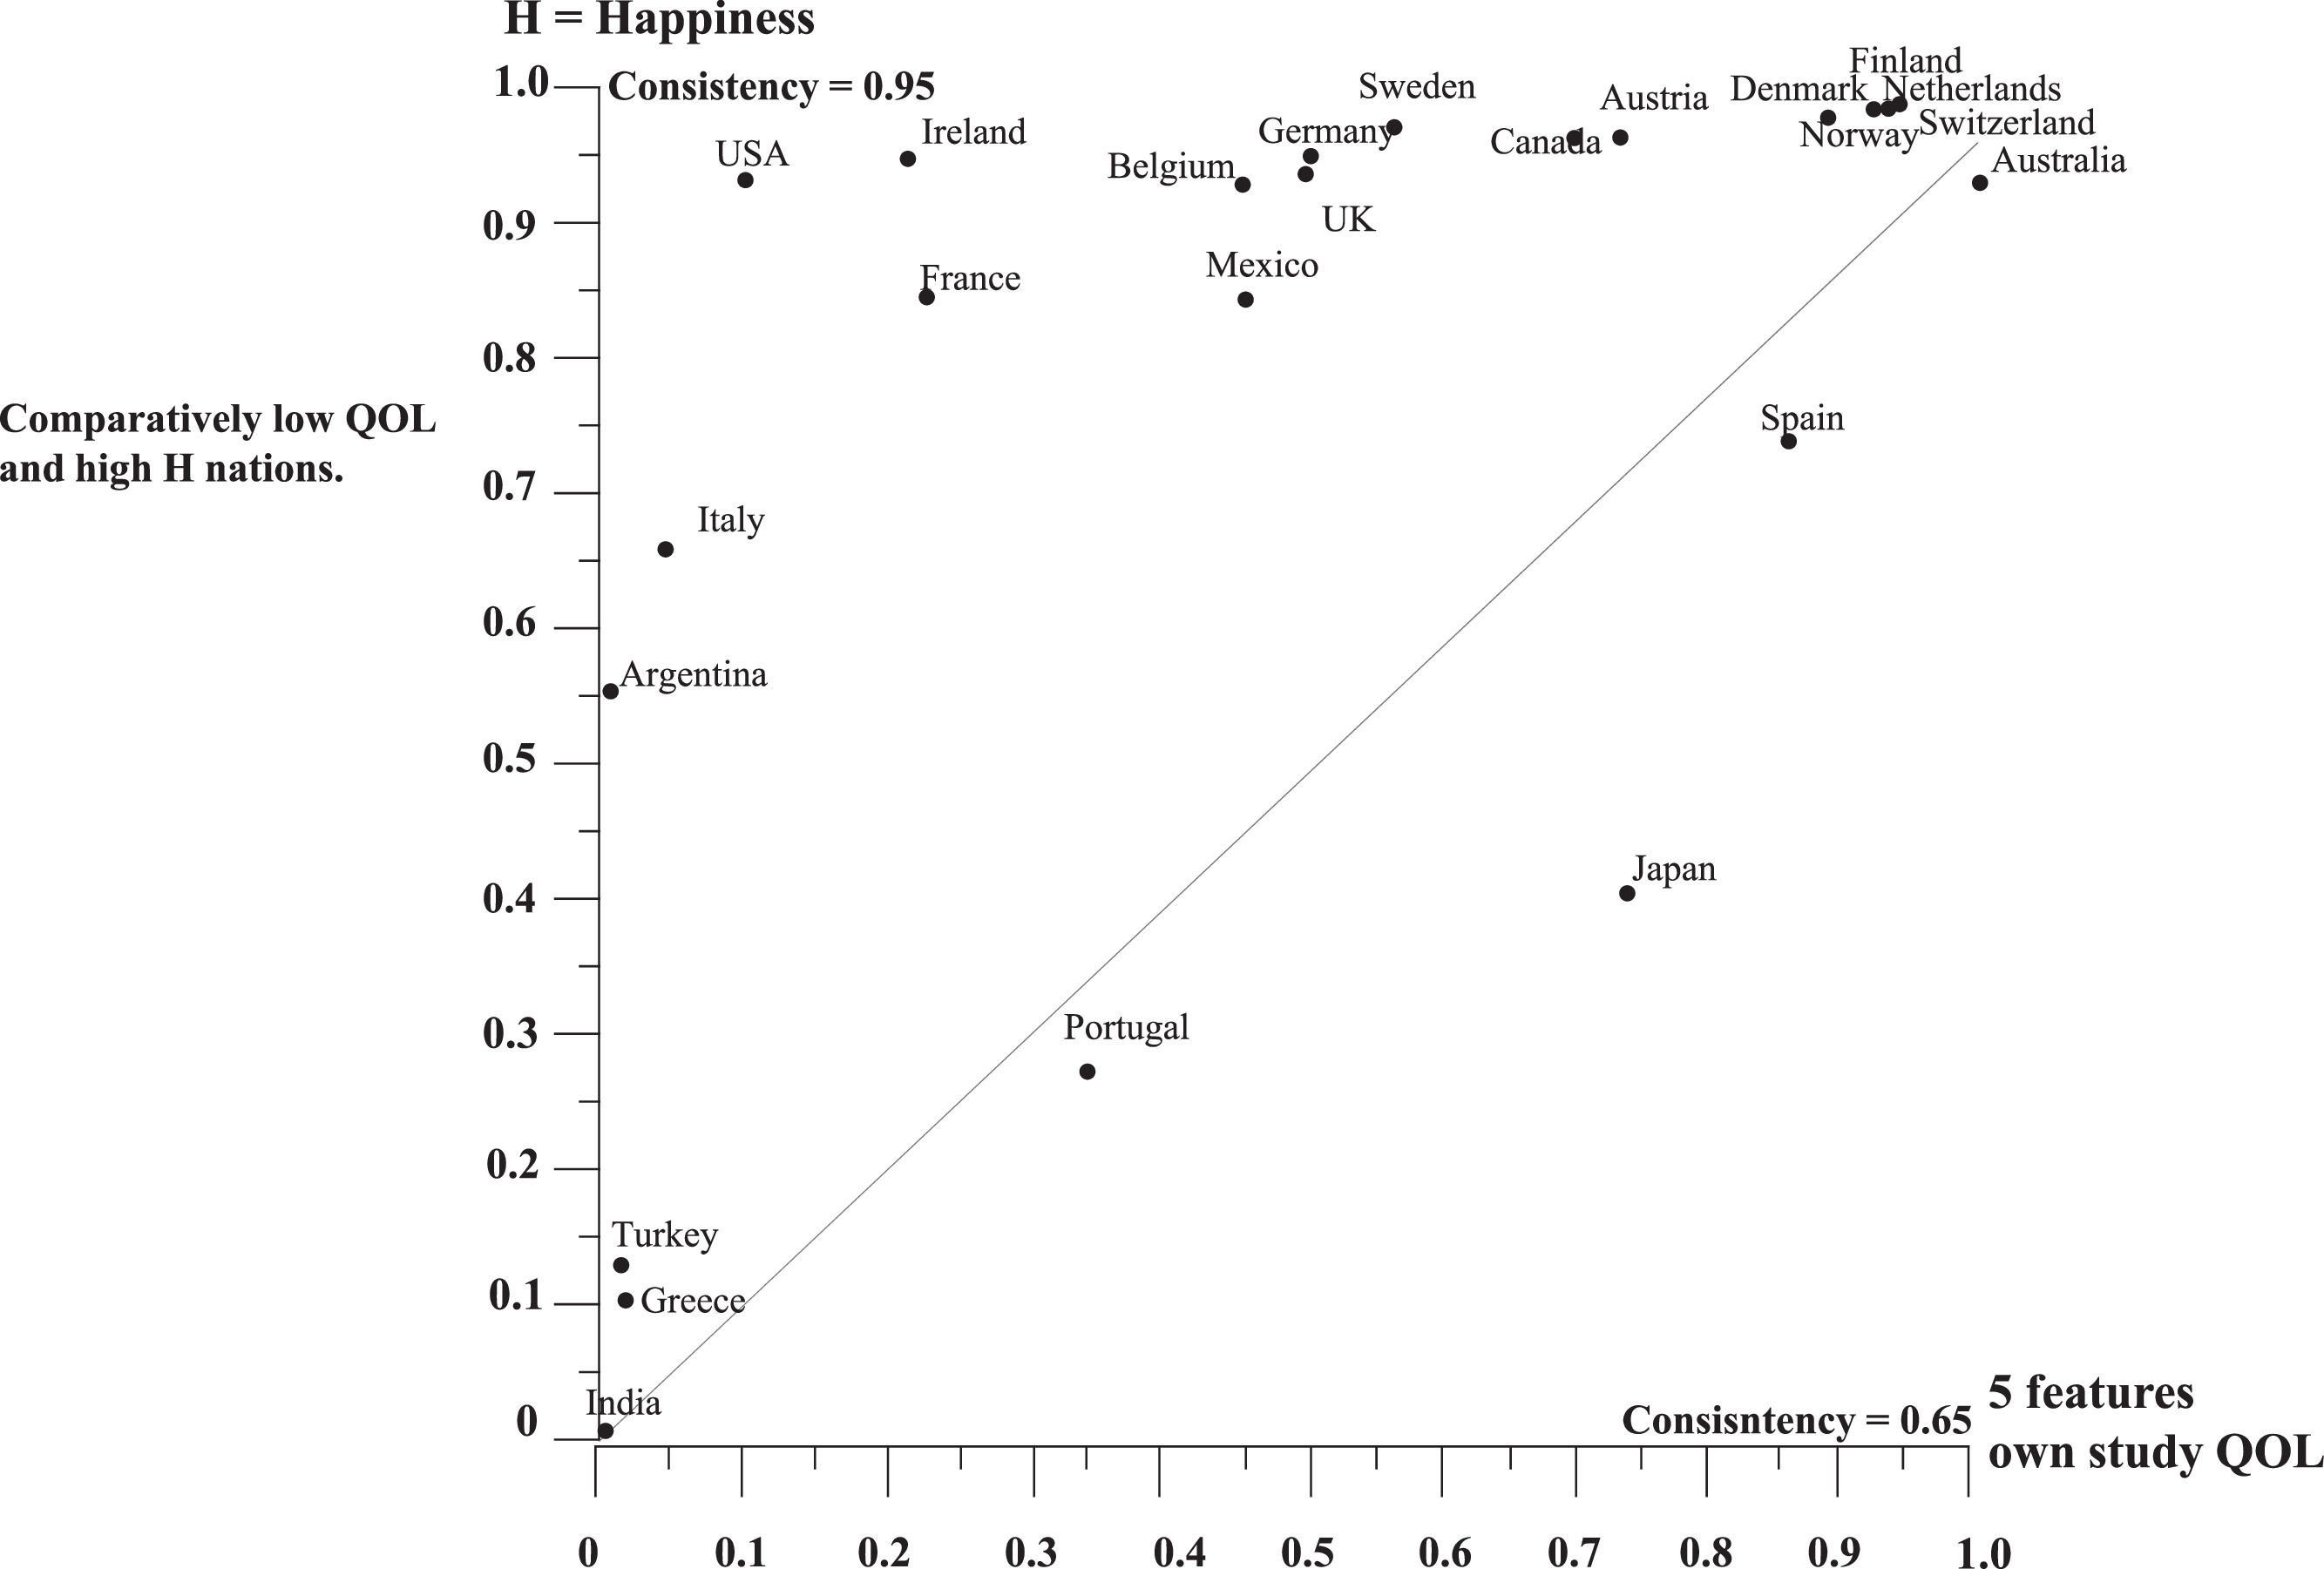
Findings for the democracy blooming model (stage 3): high QOL indicates high happiness (H)Model 3 is an asymmetric model stating that nations high in QOL are nations high in happiness (H): QOL →H. Being an asymmetric model, model 3 makes no predictions about nations low in QOL. The findings include strong support for model 3: C1 = 0.97, C2 = 0.67. All nations achieving high QOL scores achieve high H: eight of eight nations including several northern European nations, USA, and Spain. Details appear in Fig. 8.
 is sufficient but not necessary for high happiness. High QOL does not indicate all nations that achieve high H. Mexico has high H but has low QOL. The model QOL → H is an asymmetric model. Different single or complex antecedent conditions are necessary to explain why Mexico and additional nations (e.g., France and Belgium) are high H nations. High QOL as an asymmetric model is highly consistent in indicating high H: all nations high in QOL are high in happiness.")
Stage 3 findings in the democracy blooming model: High QOL indicates nations high in happiness.
Commentary: QOL → H (aka: QOL ≤ H) is sufficient but not necessary for high happiness. High QOL does not indicate all nations that achieve high H. Mexico has high H but has low QOL. The model QOL → H is an asymmetric model. Different single or complex antecedent conditions are necessary to explain why Mexico and additional nations (e.g., France and Belgium) are high H nations. High QOL as an asymmetric model is highly consistent in indicating high H: all nations high in QOL are high in happiness.
Model 3 is an asymmetric prediction model. Model 3 makes no prediction about nations low in QOL being low or high in H. While three nations comparatively low in QOL are low in H (i.e., Greece, India, and Turkey), three nations low in QOL are high in H (i.e., Argentina, Italy, and Mexico). The present study provides clues for developing separate theories abductively for explaining how Argentina, Italy, and Mexica achieve comparatively low QOL and high H.
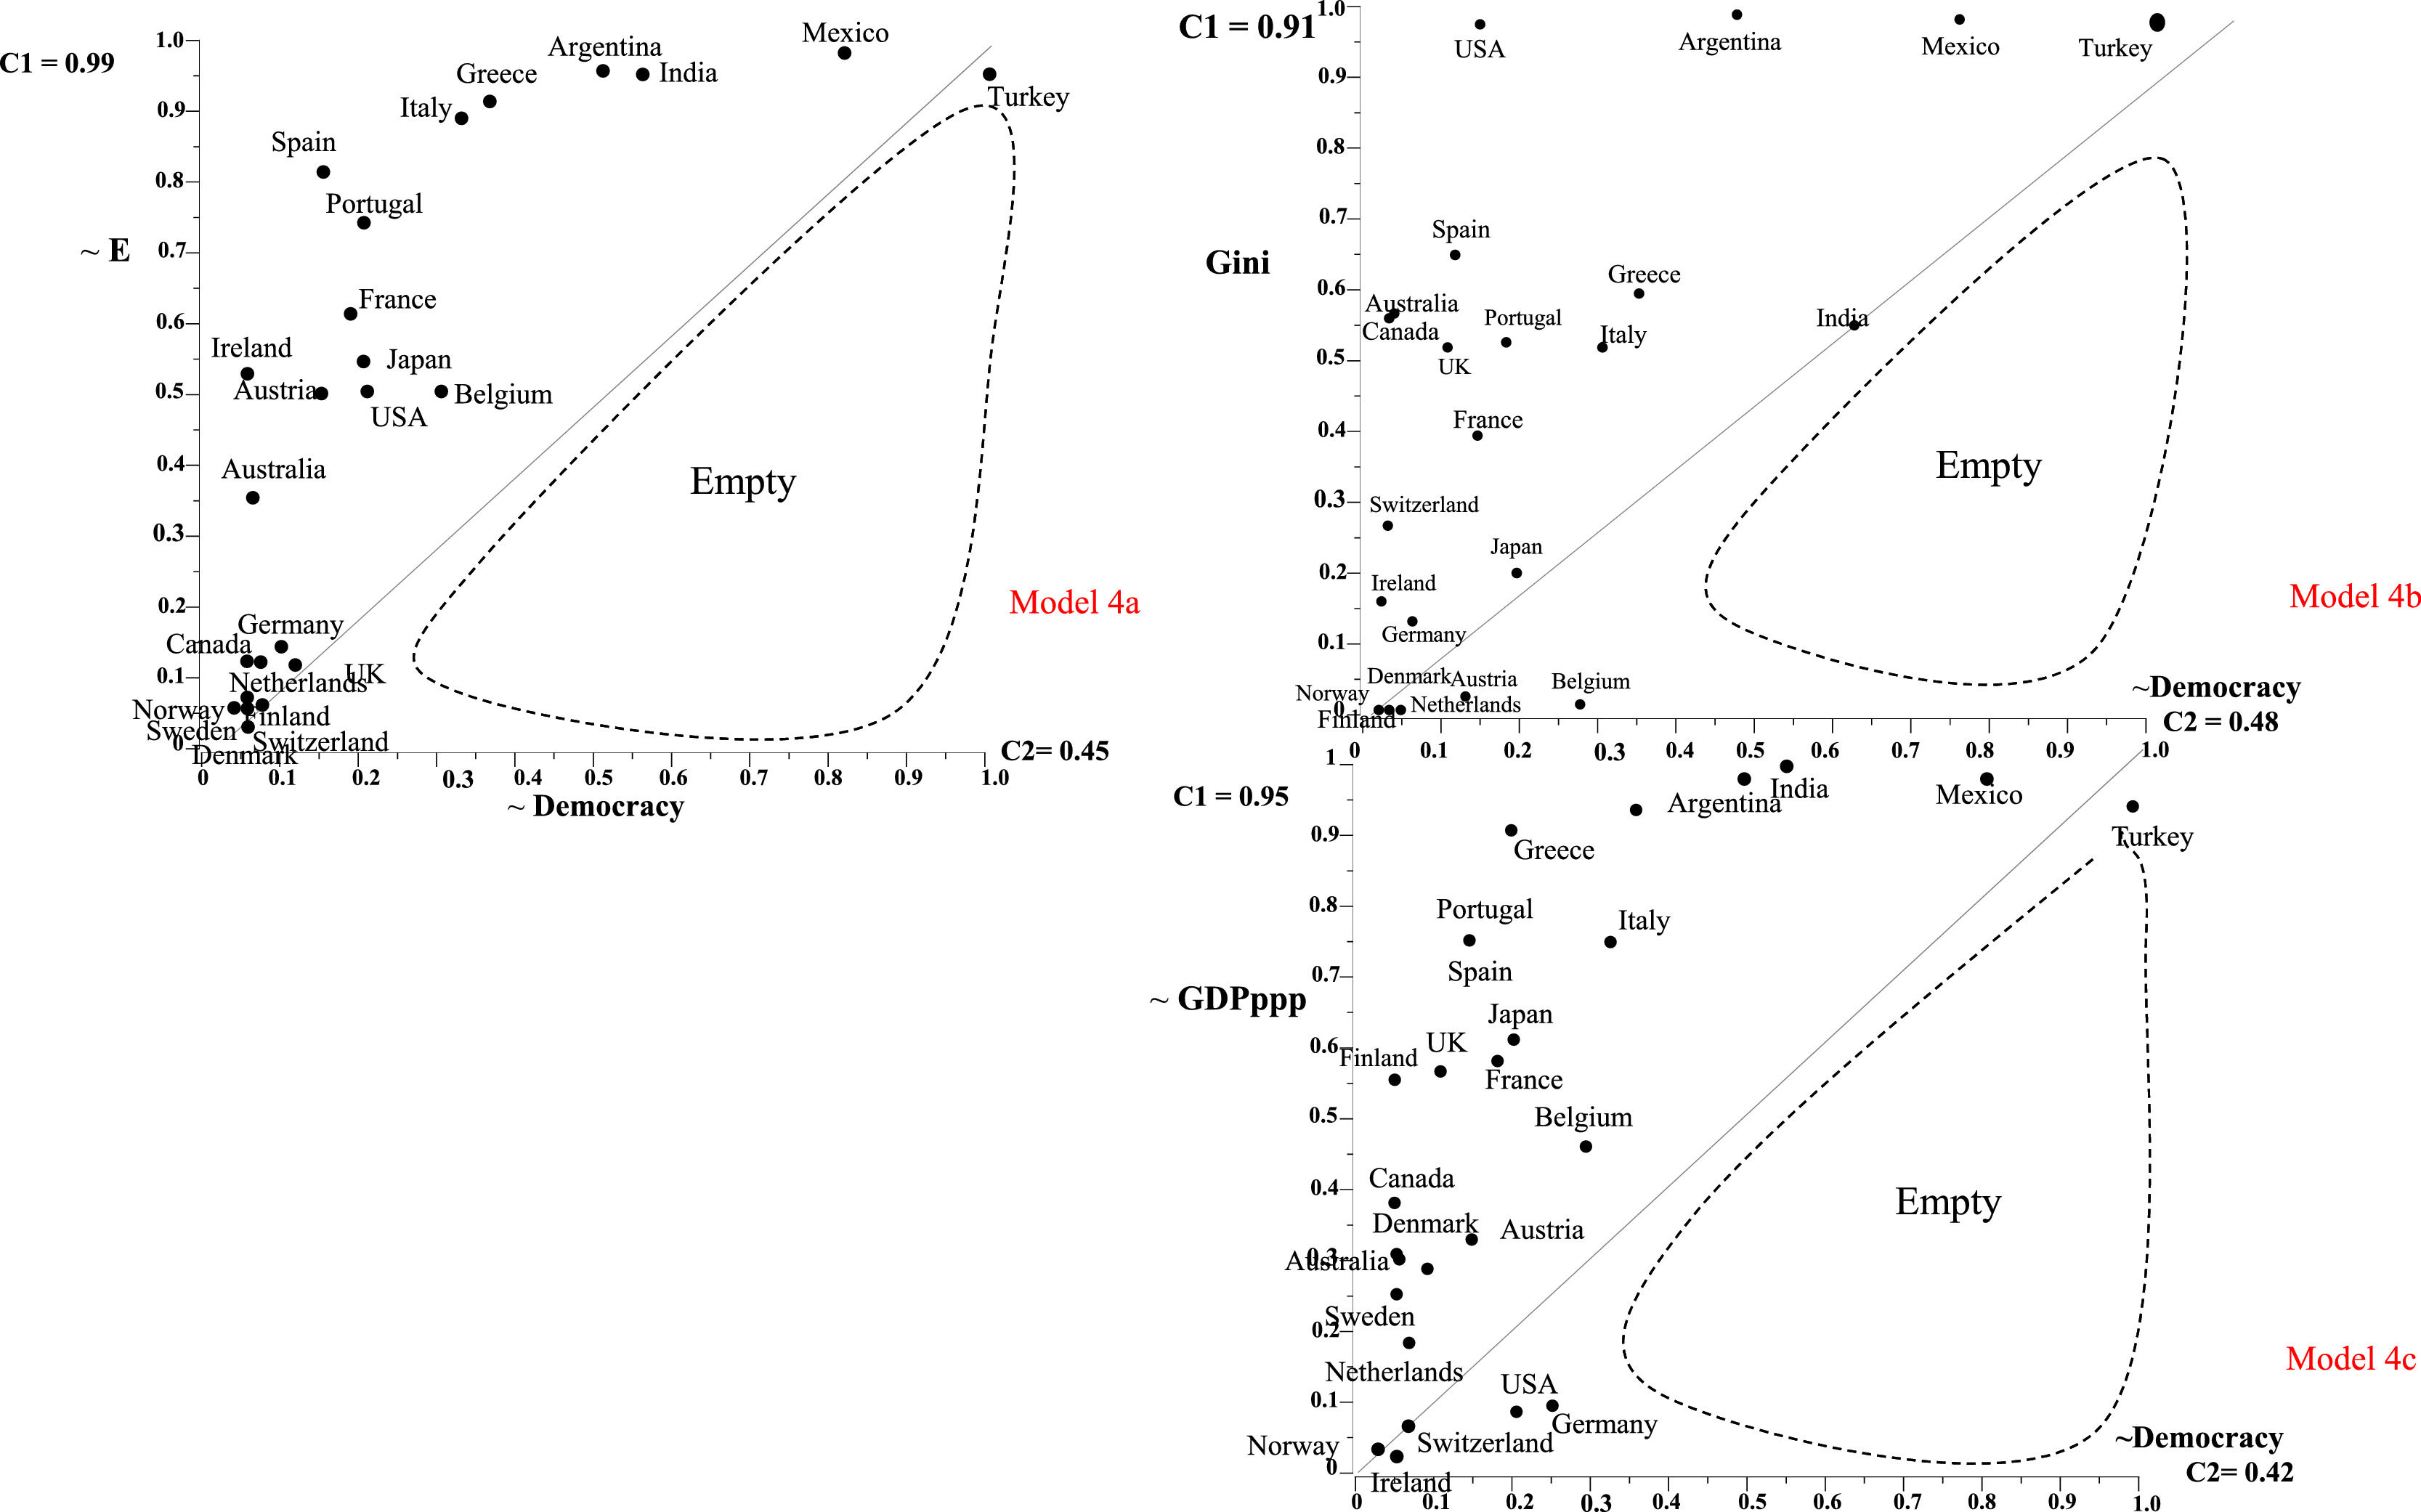
Findings for the adhocracy wilting model (Stage 1): full adhocracy and the three wiltsThe findings support all four parts of stage 1 of the adhocracy wilting model: high adhocracy nations consistently exhibit comparatively low ethical behavior (A→ ∼E), high Gini index scores (A→ Gini), and low GDPppp (A→ GDPppp). Consequently, the wilting bouquet as an outcome of high authoritarian (model 4d) receives support: (A→ ∼E●Gini●GDPppp). Fig. 9 includes the XY plots for models 4a, 4b, and 4c. Fig. 10 shows the XY plot for the complex wilting bouquet findings (model 4d).


Individually for the three models in Fig. 9, the consistency indexes are greater than 0.90 and the coverage indexes of all three models are greater than 0.40. Thus, the models are highly accurate in predicting that high scores in authoritarian indicates high scores in the three wilting features. Turkey and Mexico are standouts in being highly adhocracy and high in each wilting characteristic. Fig. 10 supports the generalization that authoritarianism nurtures the complex wilting bouquet consistently.
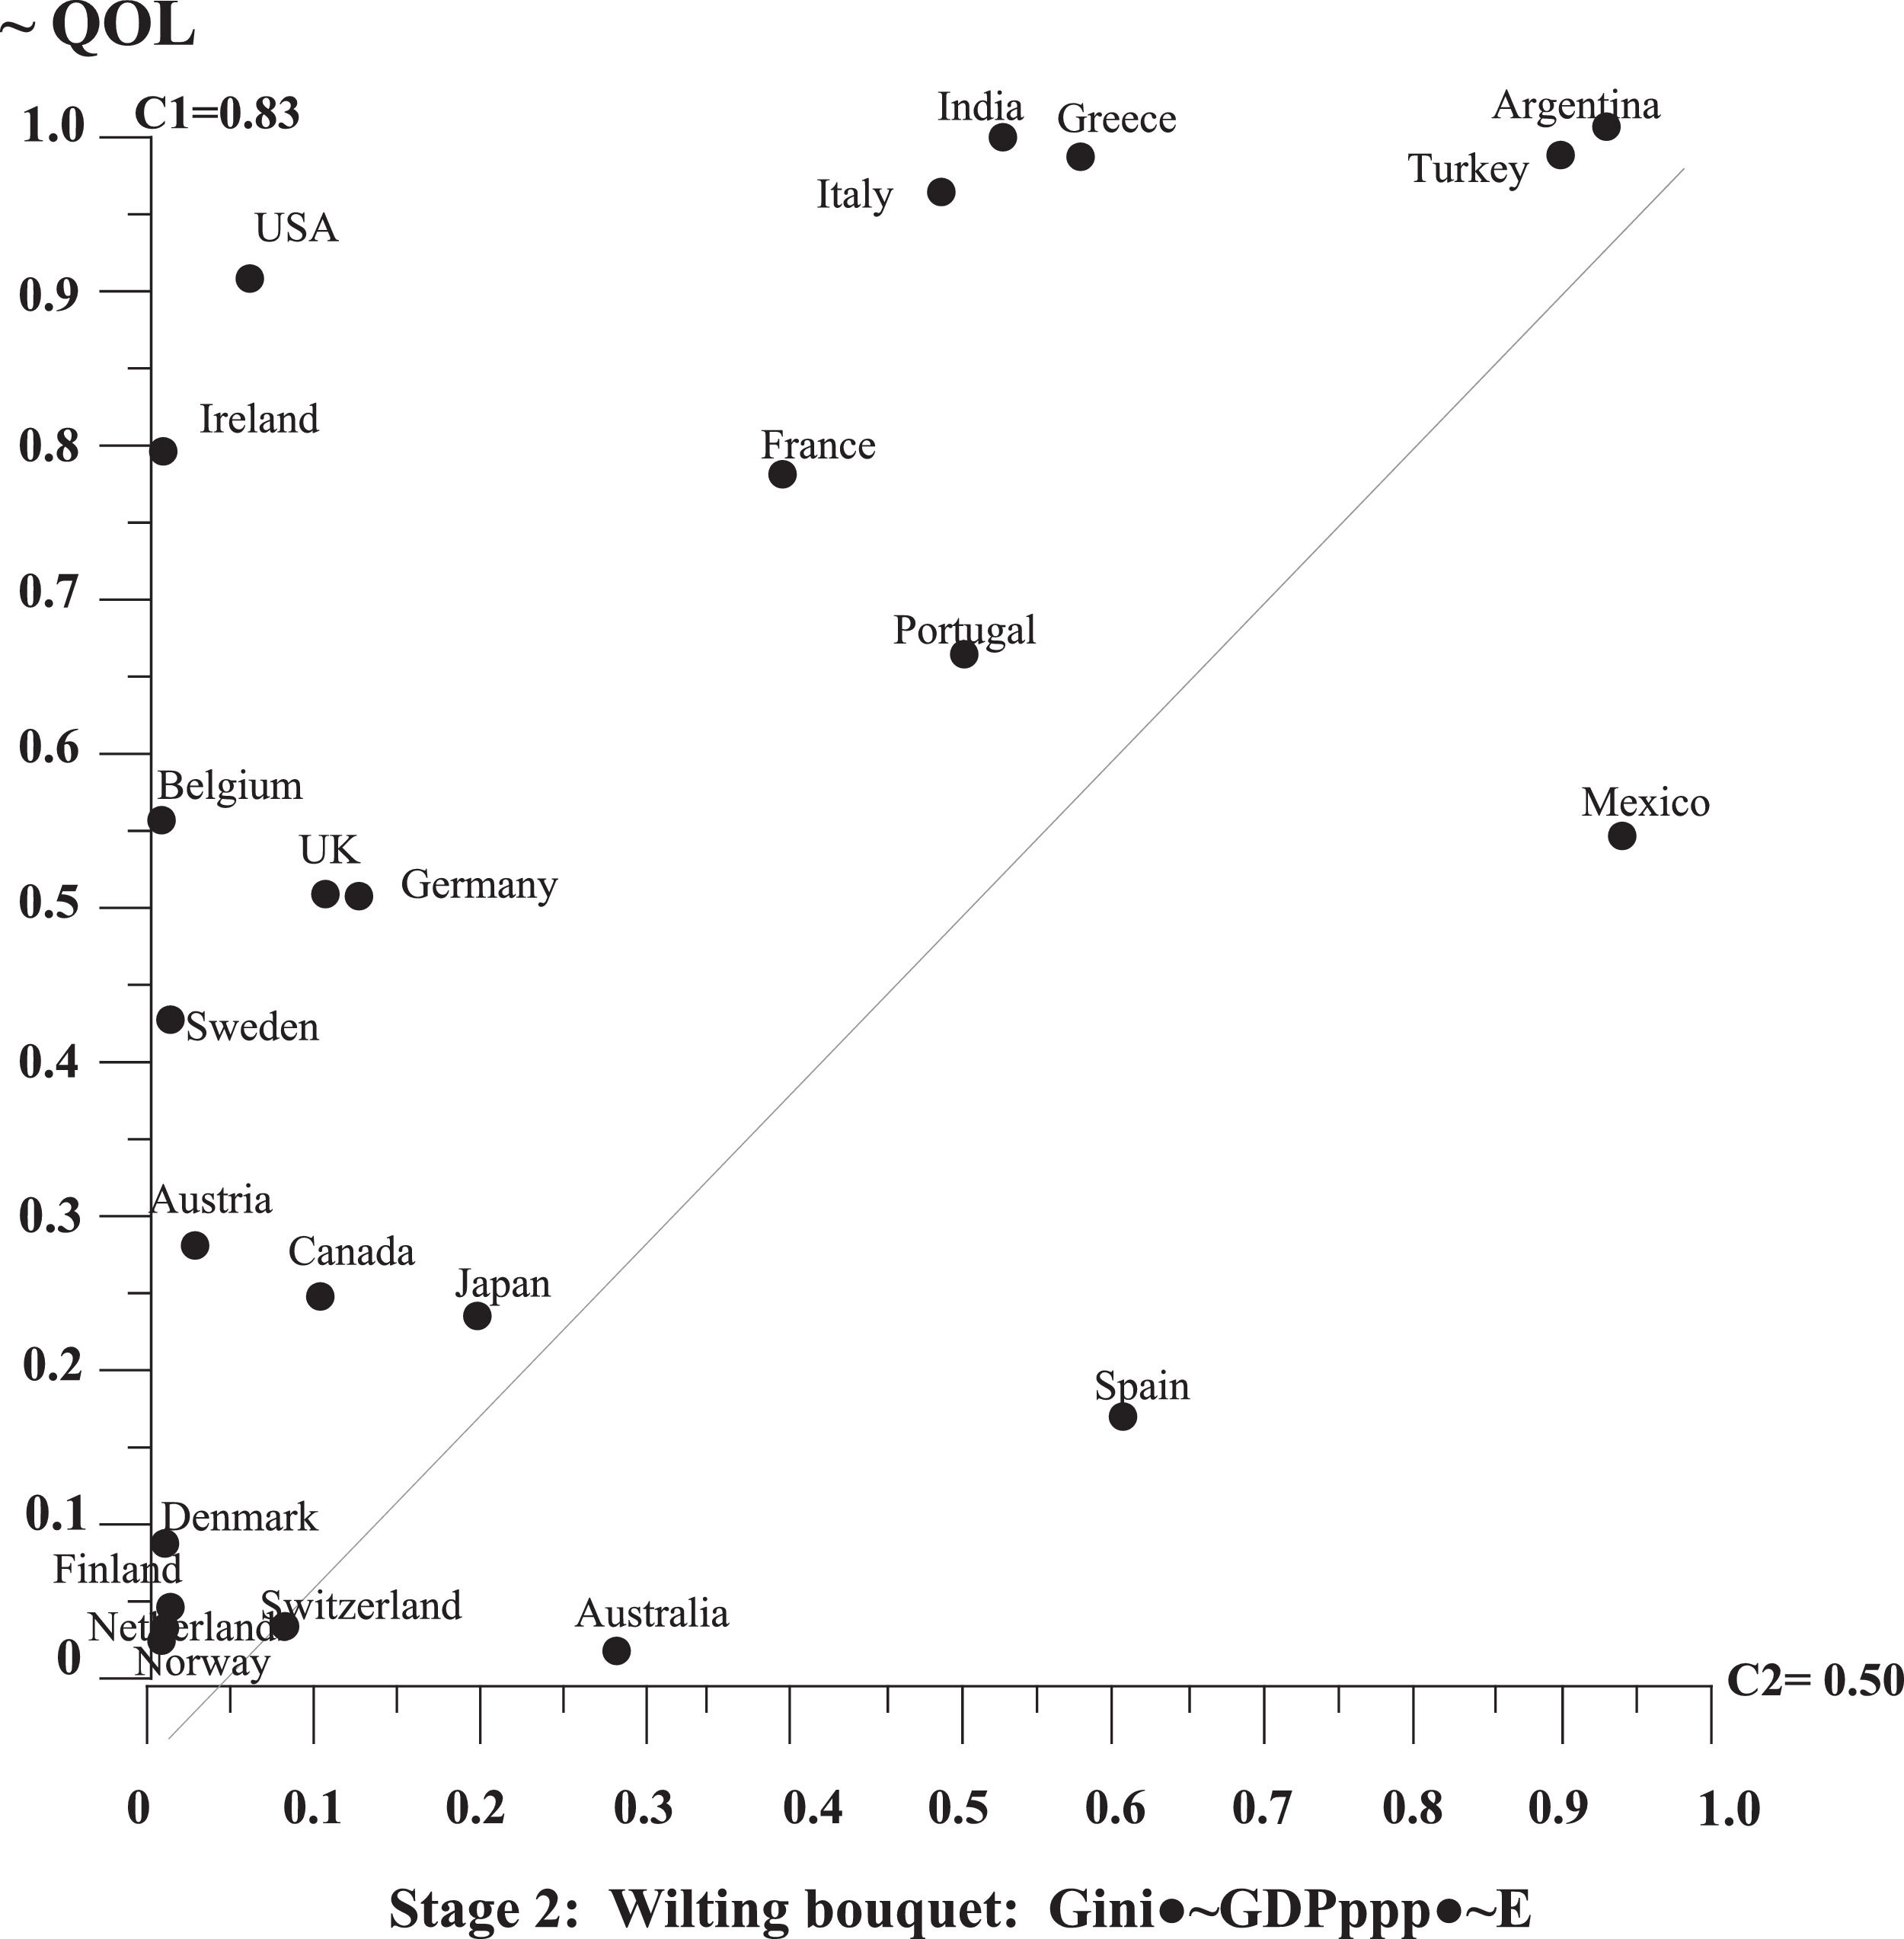
Findings for stage 2 of authoritarianism wilting model: the wilting bouquet indicates low QOLThe findings strongly support model 5—nations with high wilting bouquet scores are high in the negation of QOL. For model 5, the consistency index equals 0.90 and the coverage index equals 0.55. Argentina, Mexico, and Turkey are standout wilting bouquet nations with high scores in low QOL. Fig. 11 includes details for the findings for model 5.
Findings for stage 3 of authoritarianism wilting model: negation of QOL indicates high negation in happiness (∼QOL →∼H)
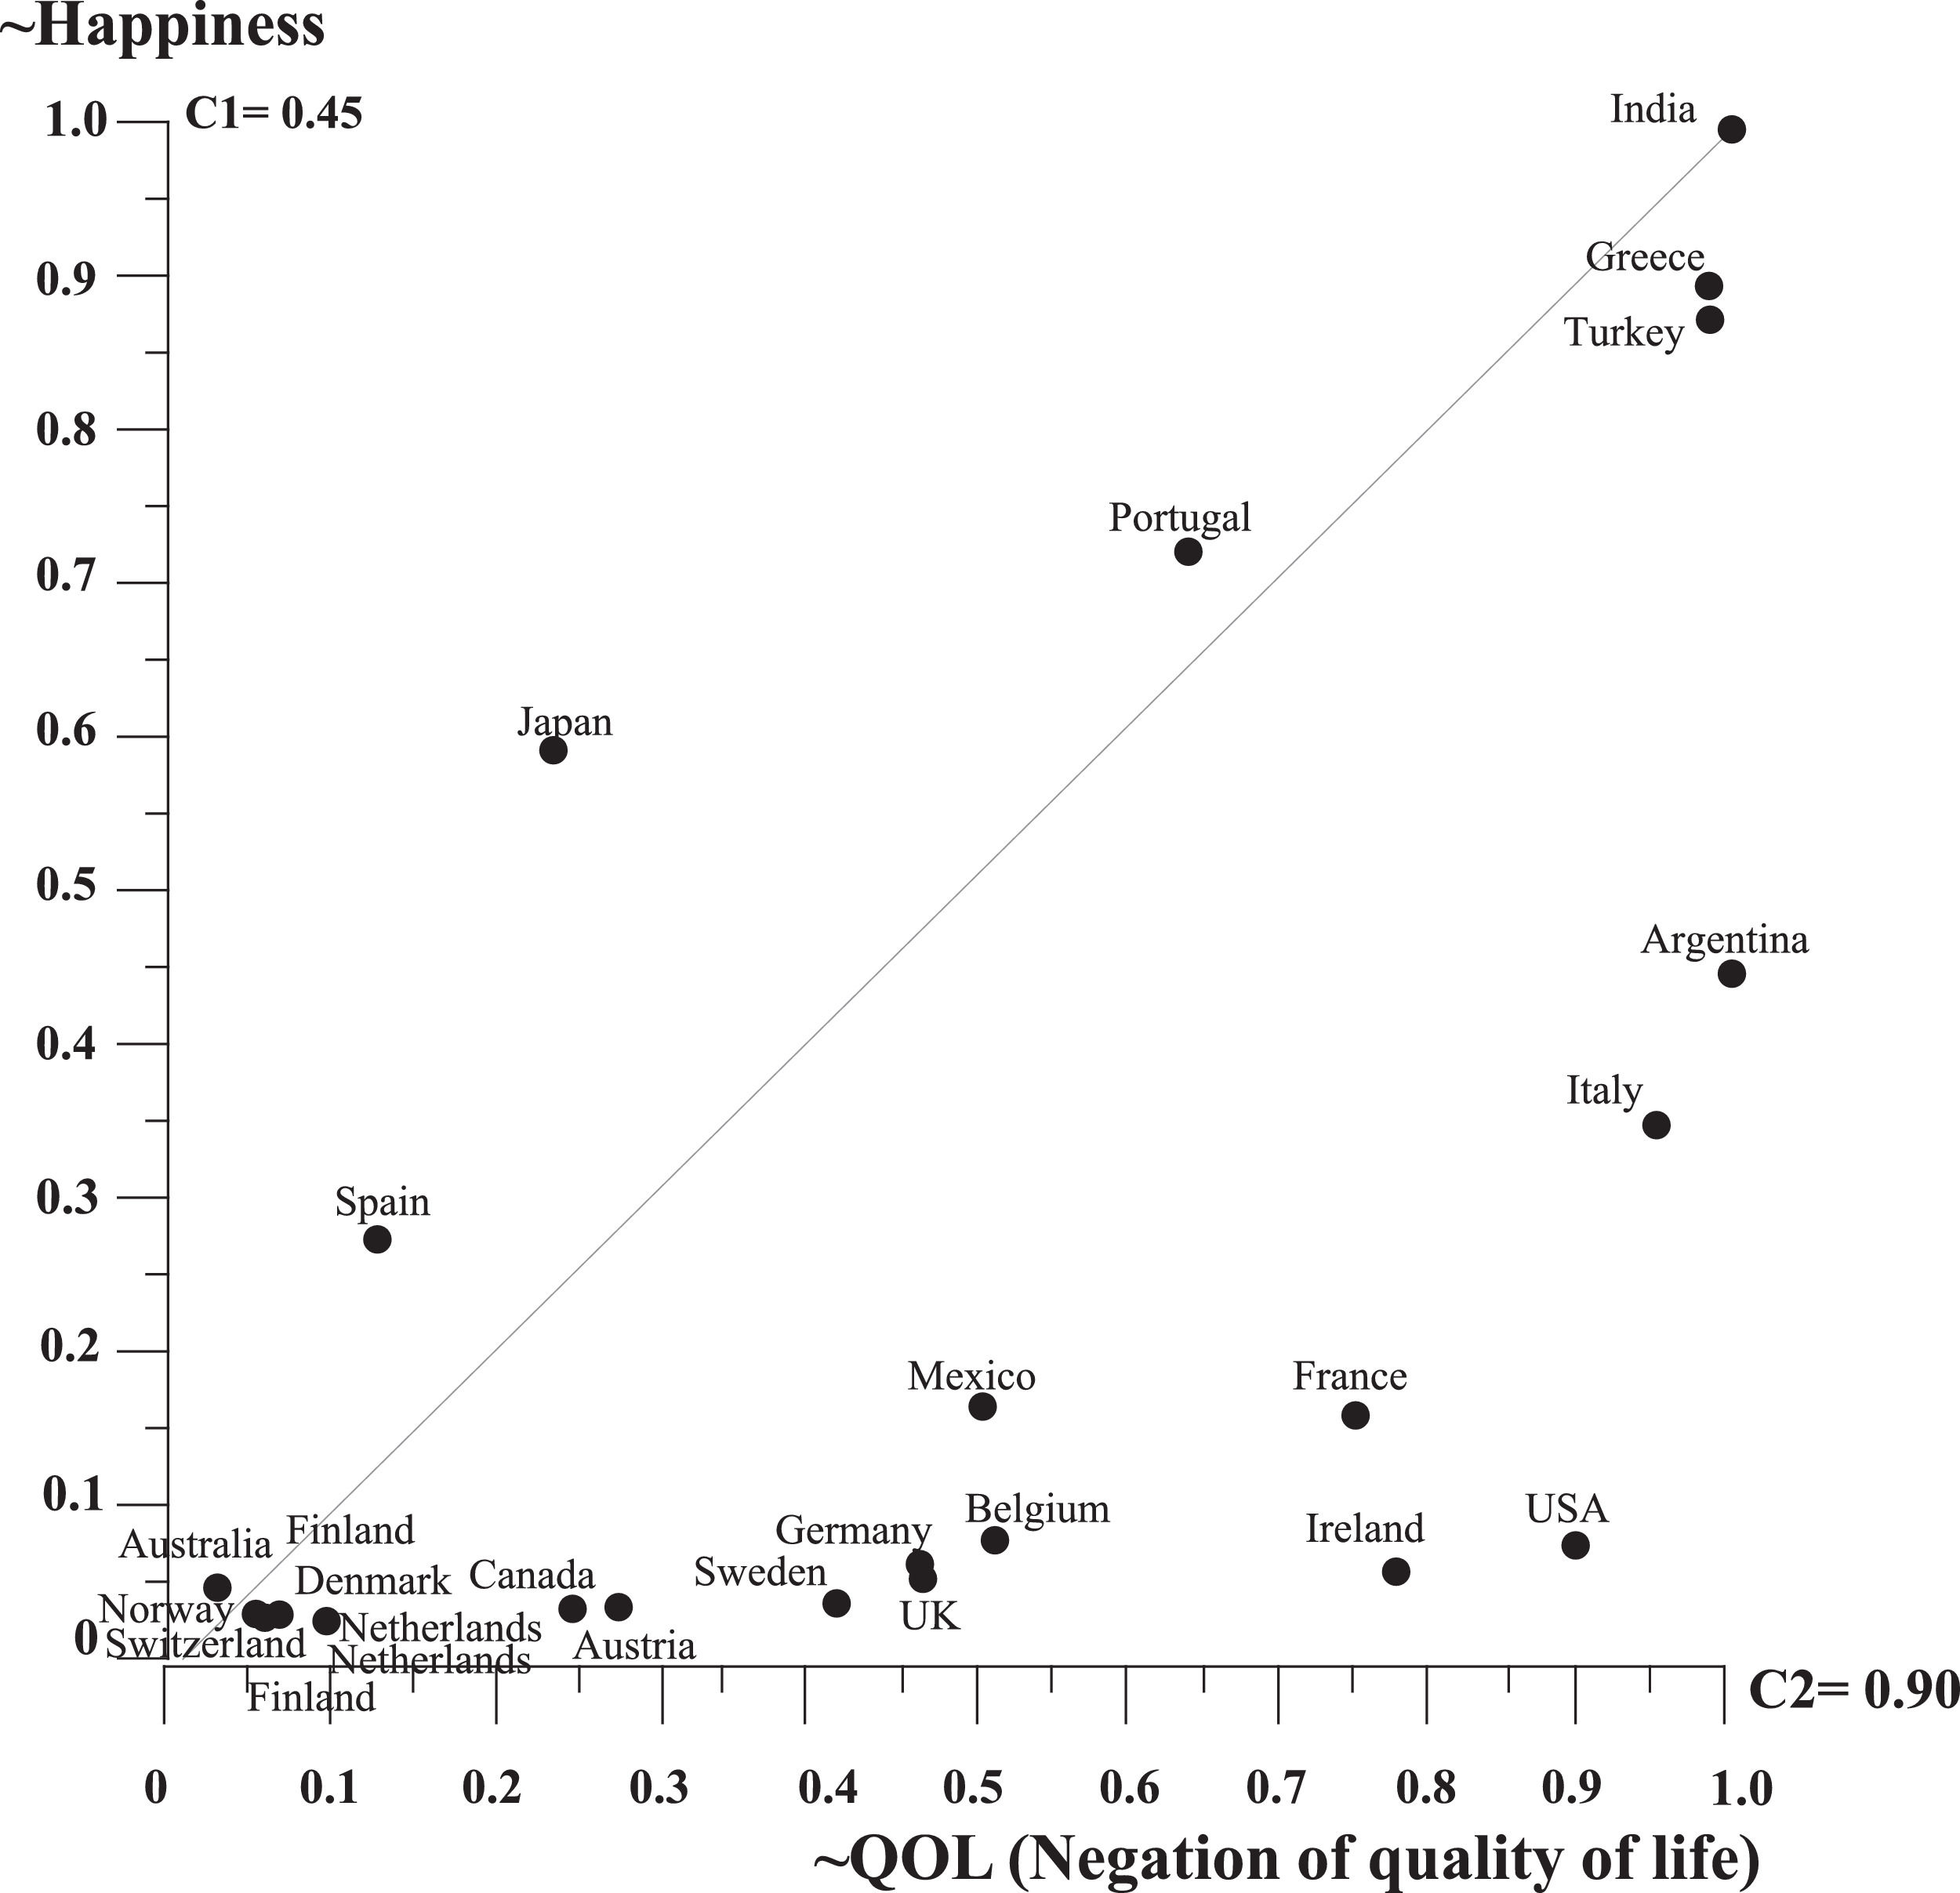
Model 6 is that nations having low QOL consistently have high unhappiness: ∼QOL→∼H, where ∼H is the negation of happiness (i.e., unhappiness). Fig. 12 includes the XY plot and consistency and coverage indexes that test model 6. The findings include six nations high in ∼QOL who have high ∼H scores: India, Greece, and Turkey. However, three of the six nations have low scores in ∼H scores: Argentina, Italy, and Mexico. Thus, model 6 does not receive support: the consistency index for model 6 is equal to 0.46—well below the a priori set index to indicate high consistency.

Apply abductive reasoning in comparing the two sets of nation having very high scores in ∼QOL. How do the two sets of nations differ? One difference: the cultural heritage of all three nations in the bottom right quadrant of Fig. 12 is Western Christian Catholic (WCC, aka “Roman Catholic”) and none of the nations in the top right quadrant of Fig. 12 are Western Christian Catholic. Possibly, WCC culturally based nations’ profound focus on the tenet that high happiness is a result of eternal salvation and not an outcome of Earth-bound QOL (Wells, 1978) is a basis for distinct set of nations with low QOL and high happiness. The occurrence of such a contrary low QOL and high happiness linkages is a worthy topic for future research.
General discussionThe findings support the democracy blooming and adhocracy wilting modelsGenerally, the findings in the present study support for the democracy blooming and adhocracy wilting QOL and H outcomes. However, the findings indicate that full democracy alone is insufficient in indicating nations high in QOL—several nations are full democracies and do not have high QOL (as Fig. 1 indicates). The findings are clearer for the two fully adhocracy nations: Mexico and Turkey have high memberships in low QOL (i.e., ∼QOL in Fig. 2). Mexico is a standout in being a high happiness nation with low QOL.
As Fig. 5 shows, full democracy is a necessary but insufficient condition for indicating each of the three democracy blooming conditions (E, ∼Gini, and GDPppp). In combination, democracy is necessary but insufficient for indicating the complex blooming bouquet (Fig. 6). The findings for the adhocracy wilting model provide stronger support for stage 1 of the model than the findings provide for stage 1 of the democracy blooming model. Figs. 9 and 10 of the authoritarianism wilting model indicate that the authoritarianism full membership nations consistently have full membership in corruption, Gini, and negation of GDPppp as well as the complex wilting bouquet of these three conditions in a configuration (∼E●Gini●∼GDPppp).
Nations having full membership in the democracy blooming bouquet consistently have high scores in QOL—stage 2 of the democracy blooming model receives strong support (Fig. 7). The adhocracy wilting model—nations having high membership in the wilting bouquet are nations with low QOL—receives strong support as well (Fig. 11). Both the blooming and wilting bouquets are sufficient but not necessary for indicating QOL and ∼QOL full membership.
Stage 3 of the democracy blooming model—high QOL membership indicates high happiness (H) membership—receives strong support (Fig. 8). All nations having full membership in QOL have full membership in H. Stage 3 of the adhocracy wilting model does not fare as well—low QOL is a necessary but insufficient antecedent for high unhappiness (∼H) (Fig. 12). Among the six nations having full membership in ∼QOL, three have medium to high membership in H as an outcome condition: Argentina, Italy, and Mexico (Fig. 12). Among the six nations with high comparative scores in ∼QOL, these three nations are uniquely Western Christian Catholic (WCC); a core tenet of the WCC of being rewarded with every lasting life in the Kingdom of Heaven may be an implicit cultural belief supporting the linkage between ∼QOL and H for these three nations. This conjecture is highly speculative but worthy of addressing in future research.
Escaping symmetric bad science practices: this study shows how to construct and test theory by embracing complexity theory tenets and asymmetric theory constructionRecipient of the 1978 Nobel Prize in Economics, Simon (1978) offers a relevant explanation of what has been missing in shifting economics [and the behavioral sciences] away from illogical modelling (i.e., bad science practices) to something better. “There is a saying in politics that ‘you can't beat something with nothing.’ You can't defeat a measure or a candidate simply by pointing to defects and inadequacies. You must offer an alternative. The same principle applies to scientific theory. Once a theory is well entrenched, it will survive many assaults of empirical evidence that purports to refute it unless an alternative theory, consistent with the evidence, stands ready to replace it” (Simon 1978: 366). Simon's (1978) observations fit well with the rationale in the American Statistical Association (ASA) report on why symmetric theory construction and NHST continue to be taught in PhD programs in business, economics, and the behavioral science. The continuing focus in teaching symmetric statistical modeling tools (e.g., correlation, multiple regression analysis, and structural equation modeling) almost exclusively in undergraduate and graduate degree programs in business and social science disciplines is one of the primary causal conditions of the current bad state of research modeling practices—as the ASA report (Wasserstein & Lazar, 2016, p. 129) explains, “We teach it because it's what we do; we do it because it's what we teach.” Thus, adding good science practices on what to do while continuing to teach bad practices as what not to do would be a giant step forward to improving research practice quality generally. The present study illustrates shifting to good science practices.
Because the practices are invalid, beginning in 2015 Trafimow (2014); Trafimow and Marks (2015) banned the use of reporting p‐values and confidence intervals from publication in articles accepted for the Journal of Basic and Applied Psychology. Relatedly, in his legendary “Anscombe's quartet” of four different XY plots of four data sets each with 11 cases and having nearly the same mean, the same standard deviation, and the same correlation, Anscombe (1973) describes similar severe limitations in the use of correlations—another symmetric tool: highly positive (negative) correlations frequently fail to indicate highly positive or negative XY relationships. Anscombe (1973) stresses the necessity of visually examining XY plots to learn if a dependent (X) and independent (Y) variable relate linearly. Study and thinking about Anscombe's quartet supports an extension to his insight that researchers providing meta‐analytical reports of sizes of directional XY relationships serve to deepen McCloskey's (2002) “unspeakable sadness”—such meta‐analyses are more rubbish than substance because they fail to examine when X and Y relate positively, negatively, and not at all. The pervasive directional theoretical predicting, empirical reporting, and net effects reporting are shallow and insufficient in comparison to point and interval estimation of the configurations including the four corners of if/when high X indicates high Y, when high X indicates low Y, when low X indicates high Y, and when low X indicates low Y—a “four‐corner outcome analysis” (Woodside et al., 2018) based on complexity theory tenets and asymmetric model construction.
Benefits and limitationsCertainly, the proposals regarding full democracy's generating the three blooming conditions in the present study for achieving a deep understanding of the actions of full democracies and how these actions impact QOL and happiness are helpful ways forward theory and practice on these topics. However, the study has noteworthy limitations. First, the study includes only three blooming/wilting conditions. Future research needs to include additional immediate outcome conditions beyond the three blooming conditions in the present study, that is, conditions including and beyond ethical behavior, ∼Gini, and GDPppp.
Second, the small sample size of 24 nations is a limitation of the present study. The study needs to be replicated with a doubling or tripling of the sample size. A large number of nations in a future study will permit predictive validation by splitting the sample into two subsamples (each sample including 50+ nations) to learn the similarity of the asymmetric models in each subsample. Are they identical? If not identical, do the models achieving high accuracy in first sample achieve high accuracy in the second sample—and vice versa?
Third, the present study does not address antecedents to democracy and authoritarianism and how nations change direction among from full to flawed democracies to authoritarianism and the reverse paths. Scheidel (2017) informs that major shifts toward economic equality have not occurred without violence. “Violent shocks were of paramount importance in disrupting the established order, in compressing the distribution of income and wealth, in narrowing the gap between the rich and poor. Throughout recorded history, the most powerful leveling invariably resulted from the most powerful shocks. Four different kinds of violent ruptures have flattened inequality: mass mobilization warfare, transformative revolution, state failure, and lethal pandemics” (Scheidel, 2017: 6). However, while severe income inequalities are a characteristic of monarchies, over several peaceful decades, monarchial nations such as Sweden and Denmark have embraced laws and policies to limit the rise of income inequality. Future research that adopts a four-corner perspective would be beneficial: the causes of full democracies that permit high income inequality (apparently no nations have ever been in this corner), the causes of full democracies achieving low-income inequality, the cause of adhocracy nations achieving low-income inequalities (apparently no nations have ever been in this corner), and the causes of adhocracy nations with high income inequality. The findings of the present study support the perspective the laws and in-use policies to achieve ethical behavior generally (i.e., reduce and maintain low corruption aggressively, coupled with reducing and maintaining low-income inequality, associate with achieving and maintaining high national QOL.
Future research can contribute by providing direct comparisons of alternative theory construction and testing using symmetric versus asymmetric tools. This step is helpful for convincing newbies of double benefit of shifting away from bad science practices (i.e., symmetric theory construction and testing using NHST) to good science practices (i.e., asymmetric theory construction and “statistical sameness testing” (Hubbard, 2015) (aka “somewhat precise outcome testing” (SPOT) as appearing in the present study. Woodside (2019) provides an example of such a side-by-side theory construction and testing using symmetric versus asymmetric paradigms.
Reading Hubbard (2015), Gigerenzer et al. (2000), Meehl (1978), Ragin (2008), and Ziliak and McCloskey (2008) is a useful but an insufficient step for understanding the new and ongoing paradigm shift away from symmetric theory construction/testing and using NHST to using consistency indexes—a shift away from using matrix algebra based modeling to Boolean based algebra modeling that indicates high accuracy in predicting odds higher than 4‐to‐1 that a specific outcome occurs for cases fulfilling all requirements in an asymmetric (algorithm) model. Such somewhat precise outcome testing (SPOT) is in‐use in practice widely (e.g., use of stock brokerage screens in selecting stocks, consumers creating used‐car screens at Carguru.com, and other websites to create a limited number of purchase options in consideration sets of alternatives). Gigerenzer et al. (2000) offer training in constructing and testing “simple heuristics that make us smart.” Ragin (2008) is a primer on how to use “fuzzy‐set qualitative comparative analysis.” Going to the two websites, www.compasss.org and www.fsQCA.com, are additional useful steps for deepening understanding of, and for learning the latest developments in, asymmetric modeling (i.e., theory and analytics for using SPOT).
ConclusionDemocracies outperform adhocracy states in achieving high quality-of-life and high happiness. Nations that are full democracies are nations high in QOL, that is, full democracy is a sufficient condition for high QOL, but democracy is not a necessary condition for high QOL and high H. Representing democracy by the outcome (as well as antecedent complex condition) of low Gini and high ethical behavior, Fig. 13 shows that high democracy as a sufficient condition for the complex outcome of high QOL and high H . All, or nearly, all full democracies appear to embrace the tenet that implementing laws and policies that match actions of stated aims of democracy is sound practice for improving and maintaining high QOL and in achieving high happiness, and consequently, high QOL with high happiness.

Government leaders of full democracy nations (e.g., Denmark, Finland, Netherlands, and Switzerland) likely would be rather caught dead before agreeing with U.S. President Ronald Reagan's political philosophy express in his January 20, 1981, presidential inaugural address, “In this present crisis, government is not the solution to our problem, government IS the problem. It isn't so much that liberals are ignorant, it's just that they know so much that isn't so.” The U.S. public is split nearly 50–50 since its beginning in the 1780s until the present with nearly half the population supporting collective government actions to achieve the aims of democracy focusing on high QOL while the other half of the population supporting removal of government actions to achieve the aims of democracy focusing on individual freedoms (Lapore, 2018).
The nations actually achieving full democracy and enacting actions shifting nations to high QOL embrace the philosophy that government is part of the solution (e.g., Nordic nations and their laws and polices nurturing “gender mainstreaming” and lowering income inequality and the “New Deal” enactments during the 1930s in the U.S.). Government leaders nurturing government removal and absence from actions such as gender mainstreaming and lowering the Gini index contribute to the increases in corruption and reductions in the QOL of the residents (e.g., President Trump successes in reducing the functioning of government departments and agencies (Packer, 2020) during 2016–2020, and the fall of the U.S. from full to flawed democracy (cf. Lapore 2020). The Economist (2014) concludes that Japan's failure to reduce its misogynistic laws and policies is the nation's single biggest detriment to achieving comparatively high QOL.
Rather than being the problem, governments in the form of full democracies enable actions/conditions necessary for achieving high QOL. Unfortunately, members of minority groups needed to go into the streets to protest abuse and harmful laws and policies to stimulate government action (e.g., 60+ year suffragette movement globally starting around 1840s; civil rights for African Americans in the 1960s, gay rights in the 1970s, and national assault weapon ban demonstrations in nations in the 20th century all witnessed protests in the streets to cause government action). Government is more often part of the solution rather than being the problem.
The author(s) received no financial support for the research, authorship, and/or publication of this article.