


Test whether the development of abnormal venous-to arterial CO2 difference (ΔPCO2) during the early phases of postoperative care after a liver transplantation (LT) is related to multi-organ dysfunction and outcomes.
Materials and methodsProspective cohort study accomplished in a mixed intensive care unit (ICU) at a university hospital. We included 150 eligible patients after a LT between 2015 and 2018.
Patients were classified in four predefined groups according to the ΔPCO2 evolution during the first 6 h of resuscitation: (1) persistently normal ΔPCO2 (normal at T0 and T6); (2) decreasing ΔPCO2 (high at T0, normal at T6); (3) increasing ΔPCO2 (normal at T0, high at T6); and (4) persistently high ΔPCO2 (high at T0 and T6). Multiorgan dysfunction at day-3 was compared for predefined groups and a Kaplan Meier curve was constructed to show the survival probabilities using a log-rank test to evaluate differences between groups. A Spearman-Rho was used to test the agreement between cardiac output and ΔPCO2.
ResultsThere were no significant differences between the study groups regarding higher SOFA scores at day-3 (P = .86), Δ-SOFA (P = .088), as well as global mortality rates (χ² = 5.72; P = .126) and mortality rates at day-30 (χ² = 2.23; P = .5252).
A significantly poor inverse agreement between cardiac output and ΔPCO2 was observed (r2 −0,17; P = ,002) at different points of resuscitation.
ConclusionsAfter a LT, central venous-to-arterial CO2 difference was not associated with survival or postoperative adverse outcomes in a critical care patients population.
Evaluar la relación de la diferencia venoarterial de PCO2 (ΔPCO2) con la aparición de complicaciones en el manejo postoperatorio precoz del trasplante hepático (TH).
Materiales y métodosEstudio observacional y prospectivo realizado en una Unidad de cuidados intensivos (UCI) médico-quirúrgica de un hospital universitario.
Se incluyeron 150 pacientes adultos que recibieron un trasplante de hígado ortotópico entre enero 2015 a noviembre 2018.
Los pacientes fueron clasificados en cuatro grupos predefinidos de acuerdo a la evolución de la ΔPCO2 durante las primeras 6 horas de postoperatorio en UCI, al considerar ese periodo como el de mayor riesgo de alteraciones hemodinámicas: (1) ΔPCO2 persistentemente normal (normal en T0 y T6); (2) ΔPCO2 descendente (alta en T0, normal en T6); (3) ΔPCO2 ascendente (normal en T0, alta en T6); (4) ΔPCO2 persistentemente alta (alta en T0 y T6).
Se comparó la relación de dichos grupos con la aparición de disfunción multiorgánica a las 72 horas y las probabilidades de supervivencia globales y en el día 30 se describieron mediante curvas de Kaplan–Meier, calculándose las diferencias mediante un test log-rank. Para el estudio de la correlación entre índice cardiaco y ΔPCO2 se ha utilizado el coeficiente de correlación de Spearman.
ResultadosLa disfunción multiorgánica representada mediante el SOFA a las 72 horas (p = 0,86) y el Δ-SOFA (p = 0,088) no presentó diferencias significativas entre los cuatro grupos a estudio, de la misma forma que ocurrió con la mortalidad hospitalaria (χ² = 5,72; p = 0,126) y a los 30 días (χ² = 2,23; p = 0,5252).
Con respecto a la relación entre IC y ΔPCO2 se demostró una correlación inversa estadísticamente significativa, de valor bajo (Rho de Spearman: −0,17; p = 0,002).
ConclusionesEn pacientes críticos admitidos tras un TH, la diferencia venoarterial de pCO2 no predice la mortalidad ni la incidencia de complicaciones en el periodo postoperatorio inmediato.
Liver transplantation (LT) is the only universally accepted curative treatment for patients with severe, acute or chronic end-stage liver disease1. However, it is a complex procedure that is associated with several complications in the early postoperative period.
One of the management objectives in this period is to ensure adequate tissue oxygenation by correcting the imbalance between demand and supply. This haemodynamic balancing act is further complicated by several factors, including persistence of cirrhosis-related hyperdynamic circulation, hypovolaemia, reperfusion syndrome, and even cardiac dysfunction2.
Oxygen delivery is determined by cardiac output (CO) and arterial oxygen saturation, which is defined in turn by arterial O2 and haemoglobin saturation. Of these 3 factors, the aim of the vast majority of therapeutic interventions is to increase delivery by increasing CO3.
The correct CO value, therefore, will be that which delivers oxygen at a rate that closely matches metabolic demand. Nevertheless, the minimum CO value has yet to be determined4. Cardiac involvement, either in the form of cirrhotic cardiomyopathy or associated with metabolic alterations or hypovolaemia5, has been observed in LT patients; therefore, even high CO values might not be able to meet tissue oxygenation demand in the early postoperative period, so low flow is a key factor in immediate postoperative physical illness.
The mixed venous-to-arterial CO2 difference indicates the balance between CO2 produced in tissue and CO2 eliminated through the lungs. This CO2 difference can be rapidly calculated at the point of care by measuring the venous-to-arterial PCO2 difference (PvCO2 − PaCO2), known as the PCO2 gap, or ΔPCO26.
The ΔPCO2 is a marker of the adequacy of venous blood flow to eliminate CO2 produced by peripheral tissues7. In fact, it is inversely correlated with the cardiac index in various types of cardiovascular failure.
This correlation between ΔPCO2 and CO is explained by the fact that low CO leads to poor clearance of CO2 produced in the tissues, causing CO2 to accumulate in the venous compartment, which in turn increases ΔPCO2.
In other words, a decrease in CO for a given production of CO2 leads to an increase in ΔPCO2, and vice versa.
Both experimental studies8,9 and clinicians10 have confirmed that ΔPCO2 can be high or normal during tissue hypoxia, depending on the CO. Therefore, a normal ΔPCO2 cannot exclude tissue hypoxia in patients with high blood flow.
The main objective of this study was to determine whether changes in ΔPCO2 in the early postoperative period of LT can predict or be associated with the appearance of complications.
Patients and methodsDesignProspective, observational, single-centre, cohort study performed in the medical-surgical intensive care unit (ICU) of a university hospital. The study meets all the requirements of the WHO code of ethics (Declaration of Helsinki), and both its design and informed consent form were authorized by the hospital’s ethics committee (Clinical Research Ethics Committee, Research Institute, Hospital 12 de October; Reference CEIC 14/149).
PatientsAll adult patients (>18 years) who underwent orthotopic LT between January 2015 and November 2018 were included. Patients who received a multivisceral transplant or who died during surgery were excluded.
Overall management strategySurgical techniqueSurgical interventions were performed according to techniques described elsewhere11,12. Our sample includes both brain-dead donors and non-heart beating donors. The recipient's hepatectomy was performed using the vena cava preservation (piggy-back) technique without venovenous bypass. The University of Wisconsin solution was routinely used for liver preservation. Before cold perfusion, a liver graft biopsy was performed, and fibrotic grafts with macrosteatosis greater than 30% or in which the time exceeded that stipulated in the hospital’s clinical protocol were discarded.
In most cases, biliary reconstruction was performed by end-to-end choledochocholedochostomy without a biliary stent. The liver graft was reperfused through the portal vein after the hepatic and portal vein anastomoses had been completed. Hepatic artery anastomosis was performed after reperfusion.
Cold ischaemia time (CIT) started with donor clamping and ended when the liver was removed from the cold preservation solution before implantation. Warm ischaemia time (WIT) started when the graft was removed from the preservation fluid and ended with portal reperfusion.
After transplantation, all patients were admitted to the ICU and managed according to the hospital’s protocol. Recipients received tacrolimus and methylprednisolone for immunosuppression. If they presented renal failure or side effects of tacrolimus, the dose was reduced and mycophenolate mofetil was added to the immunosuppressive regimen.
Study protocolRecipient anthropometric variables were collected (age, gender, weight, height, and body mass index), together with the aetiology of their liver disease and their pre-transplant scores on liver disease prognosis scales (Child-Pugh, MELD, MELD-Na).
Intraoperative data, such as the type of donor and their age, ischaemia times, and transfusion needs, were collected.
Postoperative variables collected included the score from various severity of disease scales (Acute Physiologic and Chronic Health Evaluation, APACHE II, and the Simplified Acute Physiologic Score 2, SAPS-2), hospital and ICU length of stay, survival, and appearance of surgical or medical complications, particularly:
Primary graft failure was defined as graft dysfunction leading to retransplantation or death of the patient in the first 7−10 postoperative days13.
Acute graft dysfunction was defined according to the criteria of Olthoff et al.14 as the presence of one or more of the following alterations: 1) bilirubin higher than 10 mg/dL on postoperative day 7, 2) international normalized ratio (INR) > 1.6 on postoperative day 7, and 3) alanine aminotransferase or aspartate aminotransferase > 2000 IU/l on the first 7 postoperative days.
We defined a composite outcome (respiratory complication) that combined the need for reintubation and prolonged mechanical ventilation (MV), defined as MV lasting more than 24 h.
Acute kidney injury was defined according to the KDIGO criteria15.
Multi-organ failure was defined as the SOFA (Sequential Organ Failure Assessment) score at baseline (T0) and at 72 h (T72), and the T0/T72 ratio (Δ-SOFA) was defined as Δ-SOFA = SOFA 72 h – SOFA T0 and was used to quantify changes in organ dysfunction over the study period16. Overall and 30-day survival were also recorded.
In the operating room, an arterial catheter was placed in the radial artery and a pulmonary artery catheter was inserted through the jugular vein.
T0 coincides with the patient's arrival at the ICU. Haemodynamic and arterial and mixed venous blood gas determinations were performed at T0 and at 6, 12, 24, 48, and 72 h (T6, T12, T24, T48, and T72, respectively). Blood samples were drawn into 3 ml heparinised syringes and analysed using point of care systems (GEM Premier 3000, model 5700, Lexington, Mass, USA) at T0, T6, T12, T24, T48, and T72.
The ΔPCO2 was calculated at each study time point using the following formula:
where PaCO2 and PvCO2 are the partial pressures of arterial and venous CO2, respectively.Definition of study groupsTaking an ΔPCO2 value to indicate that cardiac output does not meet overall metabolic demand6, we divided patients into 4 groups according to the evolution of ΔPCO2 during the first 6 h of post-LT haemodynamic support, as studies in other critical patient populations have defined this as the period when patients are at greatest risk of haemodynamic instability17.
Group 1: persistently normal ΔPCO2 (normal at T0 and T6).
Group 2: decreasing ΔPCO2 (high at T0, normal at T6).
Group 3: increasing ΔPCO2 (normal at T0, high at T6).
Group 4: persistently high ΔPCO2 (high at T0 and T6).
Data collection and statistical analysisData were collected prospectively in a database designed specifically for the study and anonymised. SPSS 25.0 (IBM Corp., Armonk, NY, USA) was used for statistical analysis.
Continuous variables are shown as median and interquartile range (IQR). Qualitative variables are described as absolute frequency and relative percentage.
After ruling out the normal distribution of the sample using the Kolmogorov-Smirnov test, the Kruskal-Wallis test was used to compare continuous variables (followed by the Bonferroni correction for multiple comparisons) and the χ2 test (or Fisher's exact test, when appropriate) for discrete variables. Overall and 30-day survival probabilities were described using Kaplan-Meier curves, and differences were calculated using a log-rank test.
Spearman's correlation coefficient was used to study the correlation between cardiac index and ΔPCO2.
Statistical significance was set at less than 5% (P < .05).
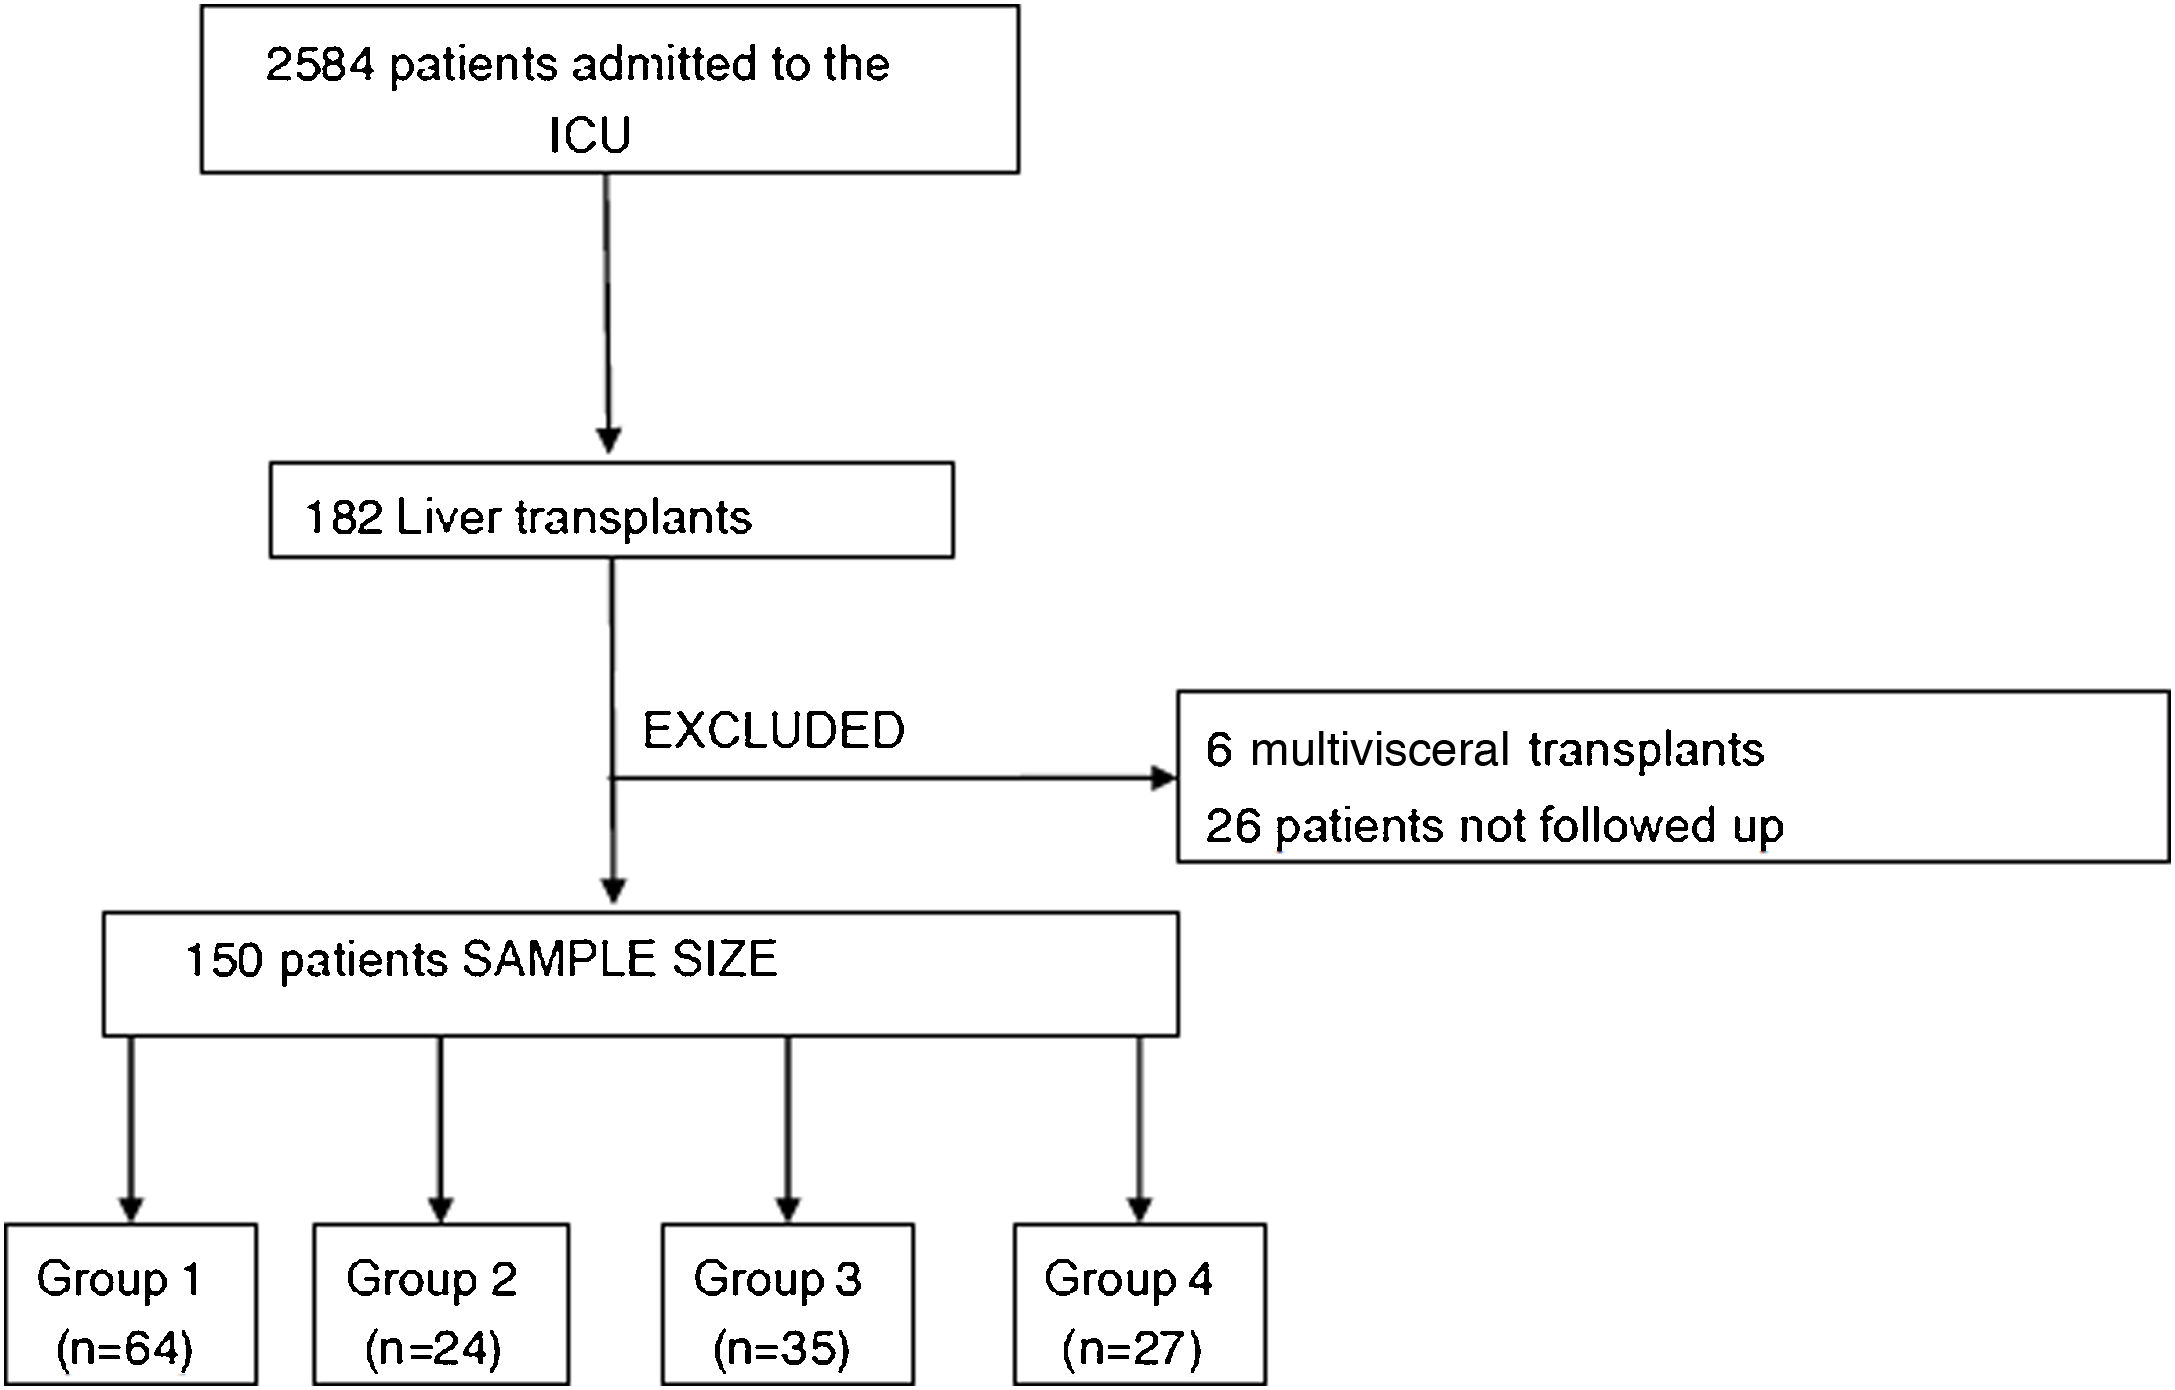
ResultsA total of 2584 adult patients were admitted to the ICU during the study (January 2015 to November 2018). During this period, 182 patients underwent LT, and 150 met the study criteria (Fig. 1).

The pre-transplant and surgical characteristics of each group are shown in Table 1. Median age of the study sample was 56.5 years, and with a majority of women (77.33%). The most frequent transplant was brain-dead donor (70.67%). Indications for transplant included alcoholic cirrhosis (58%), liver disease due to hepatitis C virus (40%), and hepatocellular carcinoma (46%). The median Child-Pugh, MELD, and MELD-Na scores were 8 (6−9), 13 (9−18), and 15 (111−19), respectively.
Comparison of pre-transplant and surgical characteristics between study groups.
| Total N = 150 | Group 1 N = 64 | Group 2 N = 24 | Group 3 N = 35 | Group 4 N = 27 | P | |
|---|---|---|---|---|---|---|
| Recipient anthropometrics | ||||||
| Age | 56.5 (51−63) | 57 (52−65) | 53§ (49−60.5) | 55 (47−60) | 61§ (53−66) | .030 |
| BMI | 26 (24−29) | 26 (24−30) | 26 (24−29) | 26 (23−29) | 25 (21−28) | .37 |
| BDD n/n (%) | 106/150(70.67) | 46/64(71.88) | 17/24(70.83) | 25/35(71.43) | 18/27(66.67) | .97 |
| Men n/n (%) | 116/150(77.33) | 48/64(75) | 19/24(79.17) | 27/35(77.14) | 22/27(81.48) | .92 |
| Comorbidities n/n total (%) | ||||||
| COPD | 7 (4.67) | 3/64(4.69) | 2/24(8.33) | 2/35(5.71) | 0 (0.00) | .55 |
| CKI | 35/150(23.33) | 16/64(25) | 2/24(8.33) | 7/35(20) | 10/27(37.04) | .10 |
| Hypertension | 31/150(20.95) | 9/64(14.06)* | 4/24(16.67) | 7/35(20.00) | 11/27(44.00)* | .017 |
| DM | 48/150(32) | 20/64(31.25) | 4/24(16.67) | 10/35(28.57) | 14/27(51.85) | .053 |
| Characteristics of liver disease n/n total (%) | ||||||
| HBV | 13/150(8.67) | 5/64(7.81) | 4/24(16.67) | 4/35(11.43) | 0 (0.00) | .18 |
| HVC | 60/150(40) | 25/64(39.06) | 16/24(66.67)§ | 12/35(34.29) | 7/27(25.93)§ | .020 |
| AH | 87/150(58) | 39/64(60.94) | 13/24(54.17) | 19/35(54.29) | 16/27(59.26) | .90 |
| HCC | 69/150(46) | 29/64(45.31) | 12/24(50) | 16/35(45.71) | 12/27(44.44) | .98 |
| FH | 8/150(5.33) | 1/64(1.56) | 1/24(4.17) | 2/35(5.71) | 4/27(14.81) | .083 |
| Toxins | 2/150(1.33) | 0 (0.00) | 0 (0.00) | 0 (0.00) | 2/27(7.41) | .026 |
| MELD | 13 (9−18) | 13 (9−19) | 12 (9.5−15.5) | 14 (9−19) | 12 (9−20) | .85 |
| MELD-Na | 15 (11−19) | 15 (10−20) | 13.5 (11.5−17.5) | 15 (10−20) | 13 (10−20) | .92 |
| Child–Pugh | .52 | |||||
| a | 51/150(34.00) | 20/64(31.25) | 6/24(25) | 12/35(34.29) | 13/27(48.15) | |
| b | 70/150(46.67) | 34/64(53.13) | 12/24(50) | 15/35(42.86) | 9/27(33.33) | |
| c | 29/150(19.33) | 10/64(15.63) | 6/24(25) | 8/35(22.86) | 5/27(18.52) | |
| Child–Pugh score | 8 (6−9) | 8 (6−9) | 8 (6−9.5) | 8 (6−10) | 7 (5−9) | .61 |
| Portal thrombosis | 22/150(14.67) | 10/64(15.63) | 3/24(12.50) | 5/35(14.29) | 4/27(14.81) | .99 |
| Time on waiting list (days) | 131.5 (62−248.5) | 117 (65−286) | 176 (129−361) | 137.5 (54−236) | 108 (58.5−156) | .10 |
| Characteristics of the surgical intervention | ||||||
| CIT (min) | 347.5 (290−460) | 335 (270−460) | 342.5 (292.5−477.5) | 362.5 (300−430) | 420 (295−480) | .49 |
| WIT (min) | 50 (45−60) | 50 (45−60) | 50 (45−60) | 55 (45−60) | 50 (40−55) | .52 |
| Colloids (ml) | 750 (500−1125) | 750 (500−1250) | 875 (750−1000) | 750 (500−1000) | 500 (500−1000) | .73 |
| Crystalloids (ml) | 1500 (1000−2300) | 1500 (875−2000) | 1500 (1000−2700) | 1485 (1000−2000) | 2000 (1000−3000) | .34 |
| RBC (ml) | 1000 (250−2000) | 1000 (500−2000) | 675 (125−1250) | 750 (250−1750) | 750 (250−2000) | .50 |
| FFP (ml) | 1250 (750−2500) | 1350 (750−2500) | 1000 (250−2000) | 1250 (750−2500) | 1750 (900−3000) | .39 |
| Platelets (ml) | 250 (0−500) | 250 (0−500) | 250 (0−500) | 250 (0−500) | 225 (0−250) | .68 |
Continuous variables are shown as median and interquartile range (IQR). Qualitative variables are described as absolute frequency and relative percentage.
AH: alcoholic hepatitis; BDD: brain-dead donor; BMI: body mass index; CIT: cold ischaemia time; CKI: chronic kidney injury; COPD: chronic obstructive pulmonary disease; DM: diabetes mellitus; FFP: fresh frozen plasma; FH: fulminant hepatitis; HBV: hepatitis B virus; HCC: hepatocellular carcinoma; HCV: hepatitis C virus; RBC: red blood cells; WIT: warm ischaemia time.
Regarding surgery, median CIT and WIT were 347.5 min (290−460) and 50 min (45−60), respectively.
Analysis of haemodynamics in the overall sample over the first 72 h showed no differences in terms of changes in blood pressure and cardiac index, but heart rate (HR) tended to decrease: median HR at T0 was 86.5 bpm (IQR: 75−98) vs. 80 bpm at T24 (IQR: 67.5−92.5; P = .033). We observed an inverse evolution between the systemic vascular resistance indices (SVRI), which at T0 was 1378.72 dynes·s·cm−5/m2 (IQR: 1045.68–1733.75) and at T12 was 1525.6 dynes·s·cm−5/m2 (IQR: 1156.3–1805.00; P = .036) and the pulmonary vascular resistance indices (PVRI), which at T48 increased significantly (233 dynes·s·cm−5/m2; IQR: 119.6–473.3) with respect to T0 (160 dynes·s·cm−5/m2; IQR: 96.2–241.5; P = .039).
Clinical outcomes are shown in Table 2. The most frequent complications were acute kidney injury (58.67%) and acute graft dysfunction (27.33%). Median ICU and hospital stay was 5 days (IQR: 4−8) and 17 days (IQR: 12−27), respectively, with a mortality rate of 6.67% and 8%, respectively. The SOFA score at 72 h was 4 (IQR: 3−5), with a Δ-SOFA of −4 (IQR: −7 to 5). Mean hospital stay was 39 days (IQR: 26–73).
Comparison of clinical outcomes between study groups.
| n/n total (%) | Total N = 150 | Group 1 N = 64 | Group 2 N = 24 | Group 3 N = 35 | Group 4 N = 27 | P |
|---|---|---|---|---|---|---|
| AKI | 88/150 (58.67) | 34/64 (53.13) | 12/24 (50.00) | 23/35 (65.71) | 19/27 (70.37) | .28 |
| Respiratory | 26/150 (17.33) | 10/64 (15.63) | 5/24 (20.83) | 3/35 (8.57) | 8/27 (29.63) | .17 |
| Infection | 12/150 (8.00) | 5/64 (7.81) | 3/24 (12.50) | 1/35 (2.86) | 3/27 (11.11) | .52 |
| AGF | 41/150 (27.33) | 17/64 (26.56) | 5/24 (20.83) | 10/35 (28.57) | 9/27 (33.33) | .79 |
| ICU stay in days | 5 (4−8) | 5 (3−8) | 5 (3.5−9) | 5 (4−6) | 6 (4−11) | .32 |
| Hospital stay in days | 17 (12−27) | 16.5 (12−25.5) | 15 (12−30.5) | 14 (11−20) | 24 (13−40) | .076 |
| ICU mortality | 10/150 (6.67) | 6/64 (9.38) | 3/24 (12.50) | 1/35 (2.86) | 0 (0.00) | .19 |
| In-hospital mortality | 12/150 (8.00) | 8/64 (12.50) | 3/24 (12.50) | 1/35 (2.86) | 0 (0.00) | .11 |
| SOFA T0 | 9 (8−11) | 1 (8−11.50) | 8 (8−11) | 9 (8−11) | 10 (8−12) | .38 |
| SOFA 72 h | 4 (3−5) | 4 (2.5−5) | 3 (2−6) | 4 (3−5) | 4 (3−5) | .86 |
| Δ-SOFA | −4 (−7 to 5) | 2 (−6 to 5) | −4 (−6.5 to 0.5) | −4 (−8 to 3) | −3 (−7 to 5) | .088 |
Continuous variables are shown as median and interquartile range. Qualitative variables are described as absolute frequency and relative percentage.
AGF: acute graft dysfunction; AKI: acute renal failure; SOPA: sequential organ failure assessment.
Regarding the distribution of patients in the study groups, 64 patients presented persistently normal ΔPCO2 at T0 and T6 (Group 1), 24 patients presented decreasing ΔPCO2 (Group 2), 35 presented increasing ΔPCO2 (Group 3) and 27 presented persistently highΔPCO2 (Group 4).
Group 4 patients had a significantly higher median age, as well as a higher incidence of arterial hypertension and toxic substances as the cause of liver disease.
However, no statistically significant differences were found between demographic characteristics, clinical evolution, incidence of complications, or haemodynamic parameters during the early hours of ICU stay (Table 3), except for higher baseline lactate in Group 4. The median number of hours under vasoactive support in Group 4 was 11.5 h, higher than that of the other 3 groups, although this was not statistically significant (0 [P = .69]), and the weighted dose of noradrenaline over the study period was also higher in this group (0.09 vs. 0 mcg/kg/min; P = .099).
Comparison of haemodynamic parameters.
| Total N = 150 | Group 1 N = 64 | Group 2 N = 24 | Group 3 N = 35 | Group 4 N = 27 | P | |
|---|---|---|---|---|---|---|
| Cardiac index (bpm/m2) | ||||||
| T0 | 4.50 (3.70−5.50) | 4.60 (4.10−5.50) | 4.20 (3.50−5.20) | 4.75 (3.50−5.90) | 4.30 (3.70−5.00) | .35 |
| T6 | 4.40 (3.60−5.25) | 4.65 (4.05−5.30) | 4.25 (3.40−4.70) | 4.55 (3.40−5.80) | 4.00 (3.50−4.50) | .073 |
| Lactate (mmol/l) | ||||||
| T0 | 2.2 (1.3−3.3) | 1.8**,¶ (1.25−3.05) | 2.45 (1.61−3.6) | 1.85 **(1.2−2.5) | 3.7¶ (2.7−4.6) | .004 |
| T6 | 1.9 (1.3−2.7) | 1.7 (1.3−2.75) | 1.75 (1.00−2.7) | 1.7 (1.15−2.15) | 2.6 (1.9−3.7) | .091 |
| pO2 (mmHg) | ||||||
| T0 | 345 (205.5−439.5) | 361 (307−460) | 345 (165−379) | 359 (254−448) | 222 (194−332) | .054 |
| T6 | 152 (121−182) | 150 (115−180) | 144 (119−184) | 153 (132−171) | 159.5 (125−188) | .93 |
| Mixed venous oxygen saturation (%) | ||||||
| T0 | 83 (80−90) | 85 (79−90) | 82 (80−87) | 85 (80−90) | 85 (69−93) | .87 |
| T6 | 79 (71−84) | 79 (72−85) | 78 (73−84) | 80 (69−83) | 74 (62−83) | .52 |
| Systolic blood pressure (mmHg) | ||||||
| T0 | 131 (118−146) | 133.5 (118−151) | 131 (120.5−149) | 130 (118−140) | 125 (116−141) | .42 |
| T6 | 128 (115−146) | 132 (114.5−152) | 120 (108.5−136.5) | 126 (118−146) | 132 (120−145) | .29 |
| Diastolic blood pressure (mmHg) | ||||||
| T0 | 65 (55−72) | 63.5 (55−73.5) | 68 (59−75) | 65 (56−76) | 63 (50−69) | .26 |
| T6 | 64 (56−73) | 64 (56−76) | 59.5 (55−63) | 67 (60−74) | 65 (55−72) | .079 |
| Mean blood pressure (mmHg) | ||||||
| T0 | 87 (77−97) | 88 (77.5−99.17) | 90 (80.5−99.5) | 85 (73−98) | 82 (73−90) | .20 |
| T6 | 86.5 (77.33−95) | 87.17 (76.33−99.5) | 80 (74−86.5) | 89 (82−97) | 88 (78−93) | .054 |
| CVP (mmHg) | ||||||
| T0 | 9 (7−12) | 9 (7−11) | 11 (8−13) | 9 (7−12) | 8 (7−10) | .10 |
| T6 | 9 (7−11) | 9 (7−11) | 8.5 (7−11) | 9 (7−11) | 10 (8−12) | .51 |
| PPm (mmHg) | ||||||
| T0 | 78.33 (67−87) | 79 (70−91) | 79.5 (67.5−88) | 76 (67−88) | 74 (65.33−83) | .32 |
| T6 | 76.17 (68−87) | 77.17 (67−89.5) | 69.5 (65.5−78.5) | 81 (74−88) | 77 (69−84) | .084 |
| PPd (mmHg) | ||||||
| T0 | 56 (46−64) | 54 (46.5−64.5) | 58 (48.5−63) | 57 (46−67) | 56 (42−59) | .57 |
| T6 | 54 (47−64) | 53.5 (46.5−67) | 49.5 (46−55) | 58 (51−65) | 53 (43−62) | .10 |
Continuous variables are shown as median and interquartile range. Qualitative variables are described as absolute frequency and relative percentage.
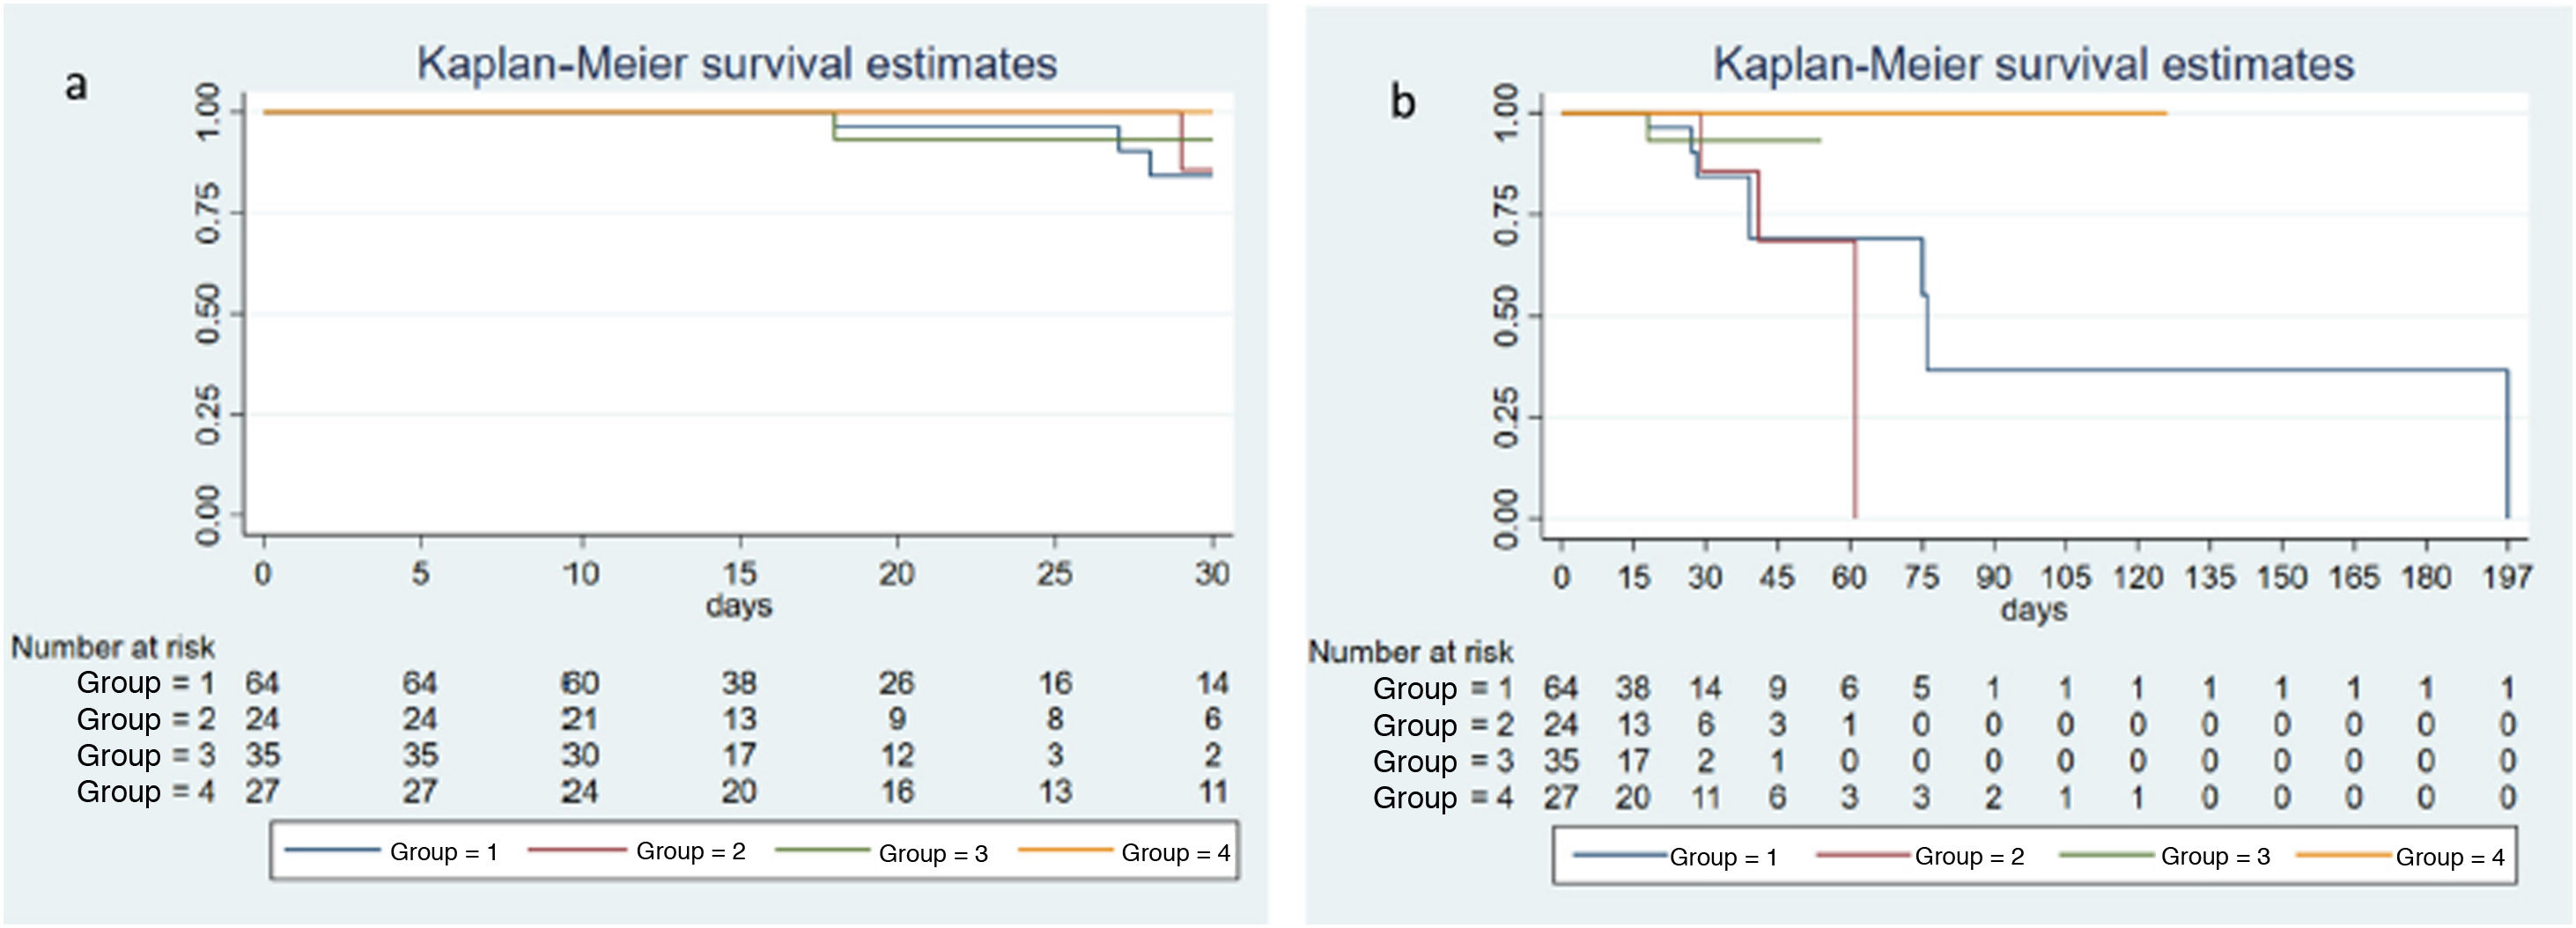
The incidence of multi-organ dysfunction determined by SOFA score at 72 h and by Δ-SOFA did not differ significantly among the 4 study groups. The same was true of overall mortality (χ² = 5.72; P = .126) and 30-day mortality (χ² = 2.23; P = .5252), shown as Kaplan-Meier curves (Fig. 2a and b).
 and overall (b) by study group. Log-rank: χ2 = 2.23; P = .5252 and χ2 = 5.72; P = .126, respectively.")
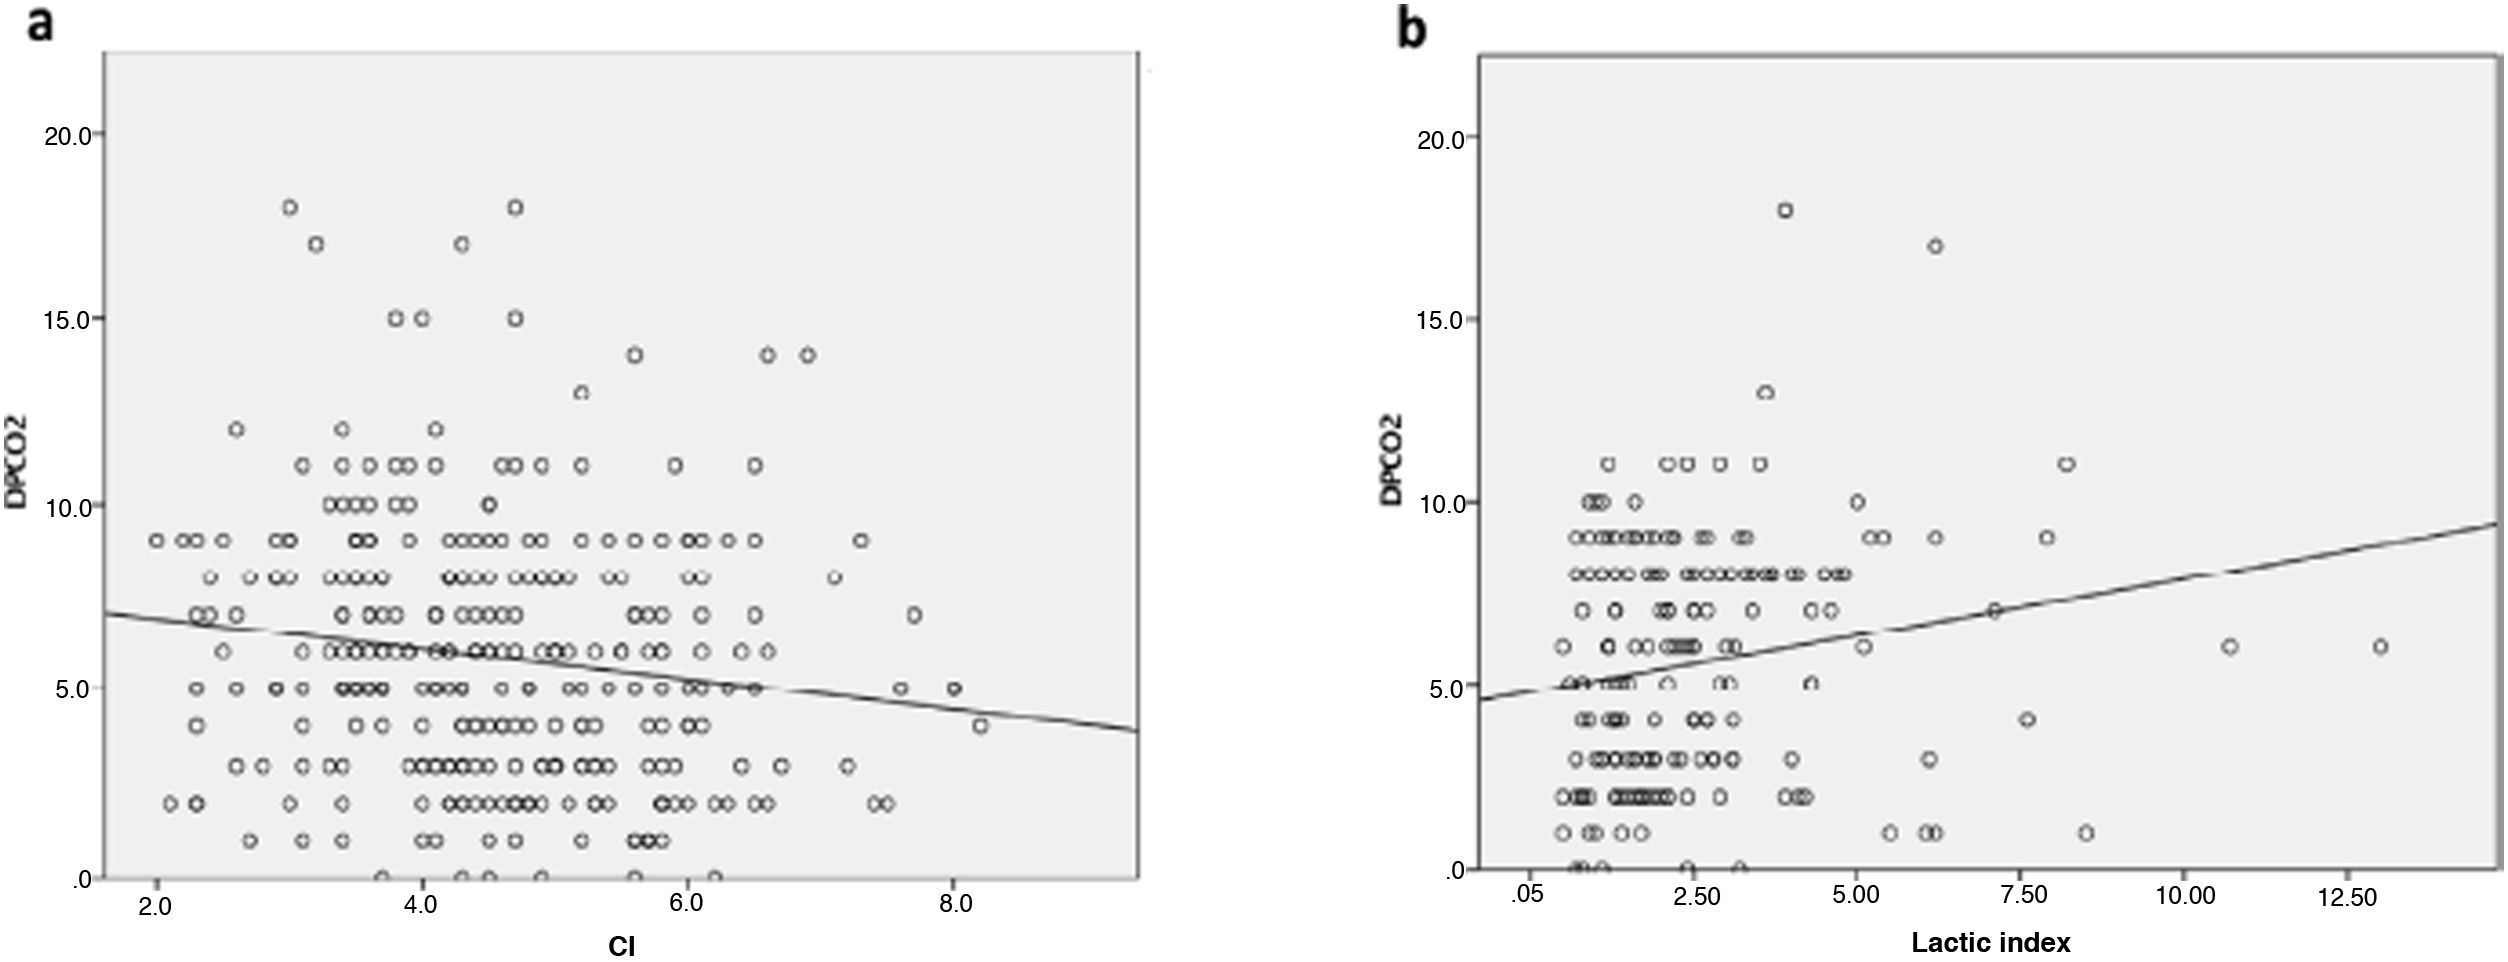
Finally, we analysed the correlation between ΔPCO2 and the cardiac/lactic index, and compared the values obtained for both parameters at T0, T6, T12 and T24. The result was a low, statistically significant inverse correlation (Spearman's correlation coefficient: −0.17; P = .002) in the case of the cardiac index, and a low statistically significant positive correlation (Spearman's correlation coefficient: 0.21; P = .005) in the case of lactic acid (Fig. 3a and b).
Discussion and cardiac index (CI) (a) and lactic index (b). All patients at T0, T6, T12 and T24. Spearman's correlation coefficient: −0.17; P = .002 (a) and 0.21; P = .005 (b) (P < .01, statistically significant).")
In this prospective, observational, single centre study in critically ill patients undergoing LT, we have shown that changes in ΔPCO2 in the early postoperative period of LT are not associated with the appearance of complications in that period.
Several authors have confirmed the benefit of determining ΔPCO2 in critically ill patients, and European guidelines recommend using this marker in the management of septic shock18.
In the field of complex abdominal surgery, various retrospective19 and prospective20,21 studies have associated high ΔPCO2 values in the immediate postoperative period with the subsequent development of complications, and even with higher mortality.
The authors of one such study20 conclude that ΔPCO2 “might be a useful and complementary tool to detect persistent tissue hypoperfusion that could be included as an additional step in the algorithms of early goal-directed therapy protocols”.
To the best of our knowledge, however, ours is the first study to attempt to analyse the utility of ΔPCO2 in the immediate postoperative period of LT.
In our cohort, the presence of persistently elevated ΔPCO2 during the first 6 postoperative hours did not correlate significantly with the appearance of clinical complications, a higher rate of organ failure, longer stays, or higher mortality rates. Mortality, in fact, was higher, though not significantly, in patients with persistently normal ΔPCO2 In our series, deaths occurred after the second month following LT, so there is little likelihood of a causal relationship between these factors.
Our results can be explained in several ways. Firstly, in line with other recent registries22–24, we were able to confirm the persistence of hyperdynamic circulation in our sample of cirrhotic patients with a predominance of Child-Pugh stage B. This haemodynamic pattern is characterized by a cardiac index of 4.5 bpm/m2, predominantly high mixed venous saturation (83%), no tendency towards arterial hypotension, but low systemic and pulmonary vascular resistance indices.
These alterations tended to normalize within the first 24 postoperative hours, in line with previously reported findings2, but the cardiac index remained above 4 bpm/m2 during the first 72 h.
Our study period spanned the first 6 h after admission to the ICU. This is the period in which tissue oxygenation is the most important factor25, and precedes the period in which other factors, such as immunosuppressants or infection, can contribute to the appearance of complications.
A persistently high cardiac index during this period, combined with the scant need for vasoactive support in our patients, suggests that therapeutic strategies to increase CO and improve oxygen delivery were of little use, and ΔPCO2 monitoring was therefore largely irrelevant.
In fact, the most common medical complications after LT, such as acute graft dysfunction and acute kidney injury, appear to originate from ischaemia-reperfusion injury instead of low CO26,27.
In the context of severe cellular hypoxia, CO2 production increases sharply with respect to oxygen demand due to the predominance of anaerobic metabolism28; therefore, ΔPCO2 can be normal or elevated, depending on the CO response. This would explain why patients with persistently high ΔPCO2 in our study showed higher lactate levels that were not derived from low CO but from tissue hypoxia associated or not with poor hepatic clearance.
Finally, the hyperoxia observed in our patients at the time of admission can artifact ΔPCO2 measurements by changes in microcirculation or by the Haldane effect6, among others, and this could contribute to the weak correlation found between cardiac index and ΔPCO2.
This leads us to conclude that low CO has very little pathophysiological impact on the appearance of complications after LT, and that monitoring CO on the basis of ΔPCO2 is ineffective. The use of this marker in a sample of patients with cardiac dysfunction might yield other results.
Our study has some limitations. First, we only collected data on macrohaemodynamic parameters, and ΔPCO2 is a global parameter that does not necessarily reflect tissue perfusion. Second, we assumed that the venous-to-arterial CO2 and PCO2 difference is linearly correlated, but this is not necessarily true. Finally, our observations were made on a small sample from a single centre and although they appear to be both logically and biologically plausible, they need to be confirmed in future studies.
Author contributionsAll the authors critically reviewed the intellectual content and approved the final version submitted. I. Sáez de la Fuente collected the data. I. Sáez de la Fuente, J. Sáez de la Fuente and C. Martín-Arriscado interpreted and analysed the data.
FundingNo external funding has been received for this study.
Conflict of interestsNone of the authors declare any type of conflict of interest with the contents of this manuscript.
We would like to thank the staff of the polyvalent ICU of Hospital 12 de Octubre for their work and help in preparing the study.
