An intervention to promote the development of an allergen control plan (ACP) and preventive measures for the management of allergens in school food services was implemented in all schools of Barcelona city over a three-year period (2013–2015) by the public health services. The present study aimed to assess changes regarding the management of food allergens in school food services in Barcelona after an intervention conducted by the public health services of the city.
MethodsSchool meal operators of a random sample of 117 schools were assessed before and after the intervention using a structured questionnaire. The questionnaire collected general information on the students and their demand for special menus, and included 17 closed questions regarding the implementation of specific preventive measures for the management of allergens. Based on these 17 questions, a food safety score was calculated for each school. The improvement in these scores was evaluated.
ResultsThe results showed positive increments in the percentage of implementation of 12 of the 17 preventive measures assessed. The percentage of school food services with an implemented ACP increased by 49%. Schools with external and internal food supplies increased their scores by 16.5% and 19.6%, respectively. The greatest improvements were observed in smaller food services and in schools located in districts with low gross household incomes.
ConclusionsThe intervention was effective in improving school food services’ management of allergens and in reducing the differences found among food services in the pre-intervention survey. We must also focus efforts on reducing socio-economic inequalities linked to the management of allergens.
Food-induced allergic reactions are considered to be an emerging problem for which children are at higher risk than adults.1
In recent decades, lifestyles changes have increased the number of children who have lunch at school,2 with schools becoming a higher risk environment for allergen exposure. Some studies have estimated that 20% of food allergy reactions occur in schools.3 Schools in Spain with pupils with allergies or food intolerances, diagnosed by specialists, shall develop special menus adapted to these allergies or intolerances or when facilities do not allow to meet the guarantees required for the elaboration of special menus, be provided to students the means of cooling and warming for foods supplied by the family.4 Also, depending on allergy type and severity, schools must establish measures for an allergen-free diet and guidelines for action against adverse reactions. Ensuring food safety for students is a responsibility of food service operators that produce or serve meals in school canteens. According to current European legislation, food operators must integrate allergen assessment into their self-control system following good practices guides or the principles of a Hazard Analysis Critical Control Point (HACCP). These regulations are applicable to commercial food services and to collective catering services.5,6 However, public administrations may encourage and ensure that food safety standards are met. In Barcelona city, the Public Health Agency of Barcelona (ASPB) is the health authority that carries out the control and surveillance of food establishments, including school canteens, through its inspection services.
The latest amendment of the Spanish food labeling rule in 20087 established that allergenic ingredients had to be declared on food labels. Since then, the ASPB inspection services began to inform and distribute guidelines on good practices on managing food allergens to food services. However, the ASPB did not have data regarding the real implementation of specific preventive measures or control plans for allergens in schools.
In 2012, a descriptive study conducted in a sample of schools in Barcelona8 showed that 89% of the schools were serving allergen-free menus in their canteens. In addition, the study confirmed heterogeneous implementation of food standards among canteen operators and low implementation (36%) of a specific allergen control plan (ACP) as part of their self-assessment system.
In view of those results, the potential impact of improving food safety practices in school food services operations to reduce allergen risk might be significant. Therefore, the ASPB designed a program called “Monitoring of Allergy and Food Intolerance in School Canteens” which included an intervention to promote the implementation of ACPs through regular visits of sanitary inspectors to schools.
The potential positive effects of food safety-related interventions in school food services have been described previously.9 However, to our knowledge, no studies have been conducted focusing on allergens as a specific prerequisite.
The main objective of the present study was to assess changes regarding the management of food allergens in school food services in Barcelona after an intervention conducted by the public health services of the city.
Material and methodsInterventionThe assessed intervention aimed to improve managing of food allergens through the implementation of a new prerequisite in schools. It comprised three steps and was implemented over a three-year period (2013–2015) to all schools in the city of Barcelona (n=764) through the visits of ASPB's sanitary inspectors (Fig. 1).
First stage: agreement of the minimum content for an Allergen Control Plan (ACP)Two models (one for each food supply system: external or internal) of ACP were designed by ASPB inspectors, based on current European regulations and good practice guides10–12 (models are available as additional material on the online version). These models summarize the main items to be considered in schools to minimize the risk for food allergens.
Second stage: documenting school preventive proceduresDuring 2013 and 2014, sanitary inspectors conducted a first visit to schools to check whether they had an ACP or not. Those without a written plan had the possibility of adapting the ACP models developed by the ASPB. After a maximum of three months, all ACPs were reviewed to verify that the main procedures for allergen management were correctly described. Non-conformities were detected and requested to be included in the ACP.
Third stage: implementation of the ACPDuring 2014–15, sanitary inspectors conducted a second visit to verify, in person, that all the items described in each school's ACP were actually being implemented in their daily work. When inadequacies were detected, inspectors required corrective actions.
Once the intervention finished, the follow-up of ACPs was integrated within the regular official control system of food operators already being conducted by inspectors for other prerequisites, with a variable frequency of inspections in each case according to a risk ranking.
Study design, sampling and data collectionA non-experimental pre/post-evaluation study was conducted using a structured questionnaire.
Sampling was stratified by city districts, school types (pre-school, primary school and high schools, covering the ages of 0–18 years), the number of meals served daily and the management of the food service (internal when managed by the school management and external when outsourced to a private company). Food supplying of schools included “internal supplying” (meals were prepared and cooked with school equipment) or “external supplying” (meals were distributed by an external kitchen).
On a convenience basis, sampled schools were chosen from five districts with different socioeconomic indexes out of 10 of the city districts. An initial representative sample of these five districts (n=129 schools) was obtained randomly from schools included in the “Food control information system of Barcelona” census in 2012.
At the end of the intervention (in 2015), 117 of the 129 schools were re-interviewed giving a loss rate of 10%. The causes of losses in the final sample were as follows: nine schools that closed, one school that stopped offering the canteen service, and exclusion of two schools as they changed their food supply system (external/internal). Differences of main variables between the final sample and lost schools were not significant.
In the present study, the results are given for the 117 schools for which we obtained a pre- and post-intervention survey.
Food services were assessed before and after the intervention, through a questionnaire applied by ASPB trained staff who conducted face-to-face interviews with school food operators.8
The questionnaire was structured in two modules: the first module consisted of seven questions collecting general information about the students, such as the number of students with food allergy or intolerance that used the school canteen; the second module consisted of 17 closed questions (yes/no questions) concerning the implementation of preventive measures for the management of allergens in five areas (self-assessment documentation; staff knowledge on allergens; receipt and storage of allergenic ingredients; handling, processing and serving of meals; and equipment and utensils).
Variables and data analysisThe percentage of positive answers to the 17 items on preventive measures was calculated before and after the intervention. The McNemar test was used to verify differences between pre- and post-intervention percentages (statistical significance at p<0.05).
Based on these 17 questions, a food safety score was calculated for each school to determine an overall assessment for purposes of comparisons. Food safety scores were assessed by assigning one point for each compliant condition. Schools with internal food supply could achieve a general score from 0 to 17, and schools with a catering service could achieve a score from 0 to 10 as items on menu processing, and the receipt and storage of raw ingredients did not apply to these schools.
Mean scores were stratified by the management of food services (internal/external), the meals served daily (as an indicator of food service size) and the territorial household income.
The variable “school ownership” was not used as an independent variable due to a correlation with the variable “management of food services” (food services in public schools were all managed externally).
The quantitative variable “meals served daily” was categorized into two ranges over and under the median: 200 meals/daily for schools with an internal food supply and 70 meals/daily for schools with a catering service. The index “territorial distribution of household disposable income per capita”13 was categorized into two ranges, considering the mean household income of the whole city of Barcelona in 2012 (mean value=100). Three districts (n=66 schools) were classified as having a lower territorial income than the city average and two districts were classified as having a higher territorial income than the city average (n=51 schools).
T-tests (p<0.05) were used to verify differences between mean score increases. All analyses were performed with SPSS v18.0.
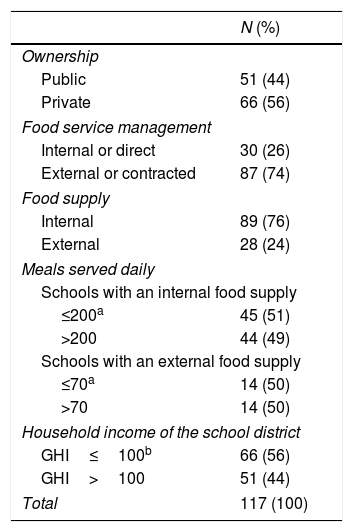
ResultsSome characteristics of the schools sampled at the end of the intervention are described in Table 1.
Characteristics of school food services. Barcelona, 2015.
| N (%) | |
|---|---|
| Ownership | |
| Public | 51 (44) |
| Private | 66 (56) |
| Food service management | |
| Internal or direct | 30 (26) |
| External or contracted | 87 (74) |
| Food supply | |
| Internal | 89 (76) |
| External | 28 (24) |
| Meals served daily | |
| Schools with an internal food supply | |
| ≤200a | 45 (51) |
| >200 | 44 (49) |
| Schools with an external food supply | |
| ≤70a | 14 (50) |
| >70 | 14 (50) |
| Household income of the school district | |
| GHI≤100b | 66 (56) |
| GHI>100 | 51 (44) |
| Total | 117 (100) |
GHI: gross household income.
The sampled schools showed wide diversity in the number of students (mean value=401±437) and in the number of students with a food allergy (mean value=19±28). The general attendance rate at the school canteen was 61% (28,509/46,962 students). On average, school food services served 1988 allergen-free meals daily, representing 7% of the total number of menus served (data not shown in Tables).
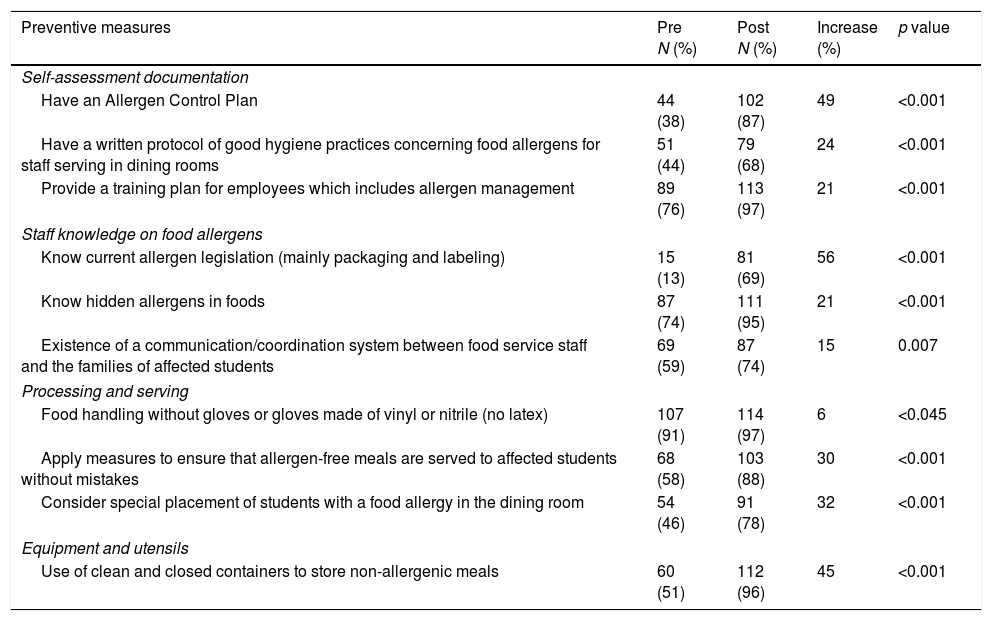
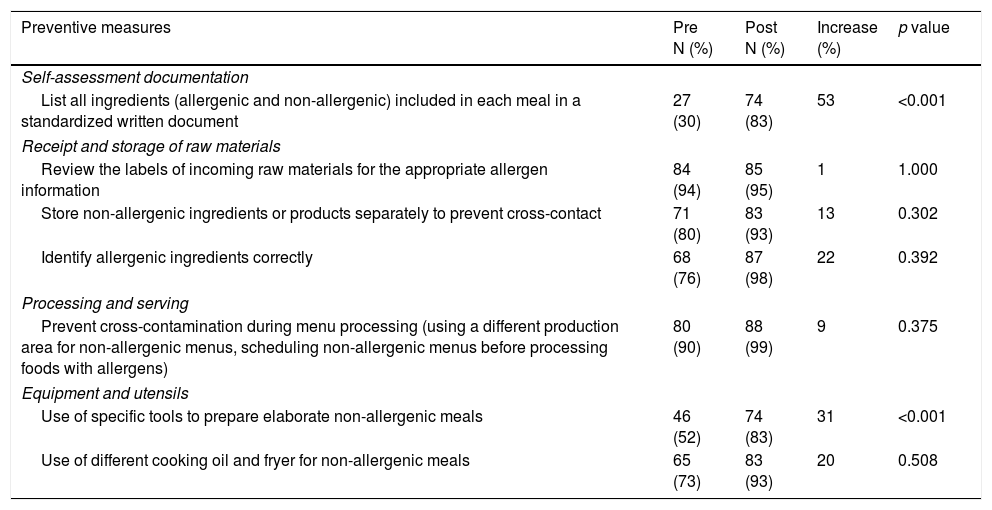
The percentages of affirmative answers to the items included in the food safety score are shown separately for items applying to all schools (Table 2a) and items applying only to schools with an internal food supply (Table 2b).
Percentages of schools implementing preventive measures for the management of allergens before and after a public intervention. Measures applying to all schools (n=117). Barcelona, 2012–2015.
| Preventive measures | Pre N (%) | Post N (%) | Increase (%) | p value |
|---|---|---|---|---|
| Self-assessment documentation | ||||
| Have an Allergen Control Plan | 44 (38) | 102 (87) | 49 | <0.001 |
| Have a written protocol of good hygiene practices concerning food allergens for staff serving in dining rooms | 51 (44) | 79 (68) | 24 | <0.001 |
| Provide a training plan for employees which includes allergen management | 89 (76) | 113 (97) | 21 | <0.001 |
| Staff knowledge on food allergens | ||||
| Know current allergen legislation (mainly packaging and labeling) | 15 (13) | 81 (69) | 56 | <0.001 |
| Know hidden allergens in foods | 87 (74) | 111 (95) | 21 | <0.001 |
| Existence of a communication/coordination system between food service staff and the families of affected students | 69 (59) | 87 (74) | 15 | 0.007 |
| Processing and serving | ||||
| Food handling without gloves or gloves made of vinyl or nitrile (no latex) | 107 (91) | 114 (97) | 6 | <0.045 |
| Apply measures to ensure that allergen-free meals are served to affected students without mistakes | 68 (58) | 103 (88) | 30 | <0.001 |
| Consider special placement of students with a food allergy in the dining room | 54 (46) | 91 (78) | 32 | <0.001 |
| Equipment and utensils | ||||
| Use of clean and closed containers to store non-allergenic meals | 60 (51) | 112 (96) | 45 | <0.001 |
McNemar's test (p<0.05).
Percentages of schools implementing preventive measures for the management of allergens before and after a public intervention. Measures applying to schools with internal food supply (n=89). Barcelona, 2012–2015.
| Preventive measures | Pre N (%) | Post N (%) | Increase (%) | p value |
|---|---|---|---|---|
| Self-assessment documentation | ||||
| List all ingredients (allergenic and non-allergenic) included in each meal in a standardized written document | 27 (30) | 74 (83) | 53 | <0.001 |
| Receipt and storage of raw materials | ||||
| Review the labels of incoming raw materials for the appropriate allergen information | 84 (94) | 85 (95) | 1 | 1.000 |
| Store non-allergenic ingredients or products separately to prevent cross-contact | 71 (80) | 83 (93) | 13 | 0.302 |
| Identify allergenic ingredients correctly | 68 (76) | 87 (98) | 22 | 0.392 |
| Processing and serving | ||||
| Prevent cross-contamination during menu processing (using a different production area for non-allergenic menus, scheduling non-allergenic menus before processing foods with allergens) | 80 (90) | 88 (99) | 9 | 0.375 |
| Equipment and utensils | ||||
| Use of specific tools to prepare elaborate non-allergenic meals | 46 (52) | 74 (83) | 31 | <0.001 |
| Use of different cooking oil and fryer for non-allergenic meals | 65 (73) | 83 (93) | 20 | 0.508 |
McNemar's test (p<0.05).
The results indicated that proper preventive measures were being followed in most school food services after the intervention. Significant increases were observed in 12 of 17 preventive measures.
The highest increases were found in the items on knowledge of allergen legislation (56%), the use of standardized recipes (53%) and the development of an ACP (49%). At the end of the intervention, 87% of the school food services had an implemented ACP.
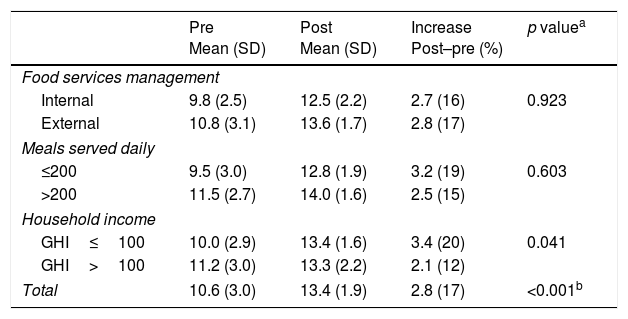
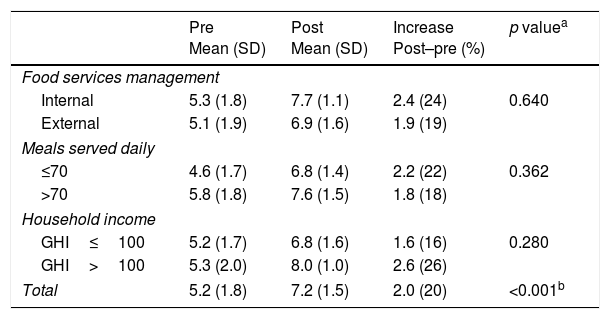
The mean food safety scores increased 2.8 and 2.0 points in schools with internal and external food supplies, respectively (Tables 3a and 3b).
Mean food safety scores and increase between pre- and post-intervention results for schools with an internal food supply (n=89).
| Pre Mean (SD) | Post Mean (SD) | Increase Post–pre (%) | p valuea | |
|---|---|---|---|---|
| Food services management | ||||
| Internal | 9.8 (2.5) | 12.5 (2.2) | 2.7 (16) | 0.923 |
| External | 10.8 (3.1) | 13.6 (1.7) | 2.8 (17) | |
| Meals served daily | ||||
| ≤200 | 9.5 (3.0) | 12.8 (1.9) | 3.2 (19) | 0.603 |
| >200 | 11.5 (2.7) | 14.0 (1.6) | 2.5 (15) | |
| Household income | ||||
| GHI≤100 | 10.0 (2.9) | 13.4 (1.6) | 3.4 (20) | 0.041 |
| GHI>100 | 11.2 (3.0) | 13.3 (2.2) | 2.1 (12) | |
| Total | 10.6 (3.0) | 13.4 (1.9) | 2.8 (17) | <0.001b |
Mean food safety scores and percentage of increase between pre- and post-intervention results for schools with external food supply (n=28).
| Pre Mean (SD) | Post Mean (SD) | Increase Post–pre (%) | p valuea | |
|---|---|---|---|---|
| Food services management | ||||
| Internal | 5.3 (1.8) | 7.7 (1.1) | 2.4 (24) | 0.640 |
| External | 5.1 (1.9) | 6.9 (1.6) | 1.9 (19) | |
| Meals served daily | ||||
| ≤70 | 4.6 (1.7) | 6.8 (1.4) | 2.2 (22) | 0.362 |
| >70 | 5.8 (1.8) | 7.6 (1.5) | 1.8 (18) | |
| Household income | ||||
| GHI≤100 | 5.2 (1.7) | 6.8 (1.6) | 1.6 (16) | 0.280 |
| GHI>100 | 5.3 (2.0) | 8.0 (1.0) | 2.6 (26) | |
| Total | 5.2 (1.8) | 7.2 (1.5) | 2.0 (20) | <0.001b |
Schools with cooking units (Table 3a) were not affected by the type of food services management, but greater improvements were detected in schools located in districts with a lower territorial gross household income (GHI) and in smaller food services.
DiscussionIn recent years an increasing demand of special diets has been detected in schools.14 Prerequisite programs based on HACCP principles are mandatory and useful to improve the safety of meals prepared or served at schools.
The food safety literature demonstrates that food operators face a diversity of difficulties to implement a successful HACCP system or prerequisites programs. Internally managed canteens and smaller canteens tend to implement less general preventive measures and prerequisites programs.15,16 The limited resources of small schools (human, financial or technical) and the lack of qualified staff are considered some of the barriers to the adoption of prerequisites.17,18
Focusing on allergen management in Barcelona city, a previous study reported a high percentage of schools serving special diets to students suffering food allergies or intolerances, and the low degree of implementation of a specific control plan for allergens.8 This study confirmed the importance of having an implemented control plan for allergens to improve preventive measures and minimize the risk for affected students.
Results show the positive effects of a food safety-related intervention in school food services.
Significant increases were observed in 12 of 17 preventive measures and for the remaining item the percentage of affirmative answers also increased but not significantly due to its already high percentage of adequacy in the pre-intervention survey.
At the end of the intervention, 87% of the school food services had an implemented ACP, confirming the achievement of the main objective of the intervention.
Most school food services were following proper preventive measures after the intervention. All items showed a percentage of affirmative responses above 68%. The lower scores were observed in the use of a protocol of good hygiene practices for staff serving in dining rooms (68%) and the knowledge of allergen legislation (69%). Although a training plan was required by the intervention, the specific content of this training on good hygiene practices could vary among schools, and therefore could differ in the inclusion to references about allergen legislation.
Regarding the protocol for staff serving in dinner rooms, it was found that despite following good preventive practices, in some cases they did not have these practices included in a protocol or they did not have the protocol available in the school.
Although all type of schools improved their allergens’ management, better results were detected in schools with lower food safety scores in the pre-intervention survey. Therefore, the intervention helped to reduce the initial differences found. This could be explained either because they had greater room for improvement, or by the availability and simplicity of the ACP models and the continuous support of ASPB inspectors during the intervention, which could have especially favored smaller food services and schools located in districts with a lower GHI, at least for schools with cooking units (Table 3a). In a previous study the cooperation between food operators and local food control authorities was pointed to as a factor to support small food businesses in overcoming their conceptual barriers for prerequisites implementation.19 This positive cooperation could also be applicable for the schools located in districts with low socioeconomic indicators. Differences among Barcelona's districts and their impact in health have been largely studied.20 These schools may confront a higher diversity of that schools located in other districts.
The main limitation of the present study was the absence of a comparison group, although this is common in public health interventions,21 especially in studies of public health programs with wide coverage.21,22 A possible bias due to a “pre-test effect” in the sample of schools studied was considered,23 since sampled schools could have obtained a higher score due to the extra visit and information obtained with the pre-intervention test. However, the intervention was later extended to all schools in Barcelona, and those that did not complete the pre-test questionnaire, had a similar proportion of applied preventive measures. Therefore, it can be assumed that this bias did not affect our results.
In brief, our data show that interventions by public health authorities can be effective in improving school food services’ management of allergens and in reducing the inequalities among foodservices.
The intervention also had some collateral positive aspects: on the one hand, the process led to the homogenization of inspectors’ criteria, and on the other hand, the constant follow-up and availability of inspectors became an unexpected via to improve staff knowledge on the topic.
However, efforts on reducing socioeconomic inequalities linked to the management of allergens must be kept up.
To the best of our knowledge, this is the first intervention focusing on allergen management that has been evaluated prospectively following an important number of schools and using the same questionnaire.
Conflict of interestThe authors have no conflict of interest to declare.
The authors would like to thank Julia Durán for her assistance and support in the design of the study.


