Introduction
During the last decade many studies have been published on the prevalence of urinary incontinence (UI) in older people living in the community.1,2 However, few studies have looked at the incidence, spontaneous remission and risk factors for UI in this population.2 Studies done in Japan, New Zealand, and Sweden found annual incidence rates of UI that ranged from 2% to 7%.3-5 Higher incidence rates (15%-28%) and remission rates (10%-25%) have been reported for older people in the USA and southern Australia.6-8
Knowledge of the natural history of UI can have important repercussions on its prevention and treatment. If slight UI progresses often to more severe degrees, early treatment should be started. But if a large percentage of slight forms remit spontaneously, a wait-and-see attitude is appropriate.
In recent years 3 studies in Spain have looked into the prevalence of UI in older people living in the community.9-11 To date, however, no studies have been published on the natural history of UI in this population. The present study was designed to determine, in older people in Spain, the prevalence, incidence, remission rate and pattern of changes in UI over a 5-year period to evaluate the factors associated with changes in continence status.
Methods
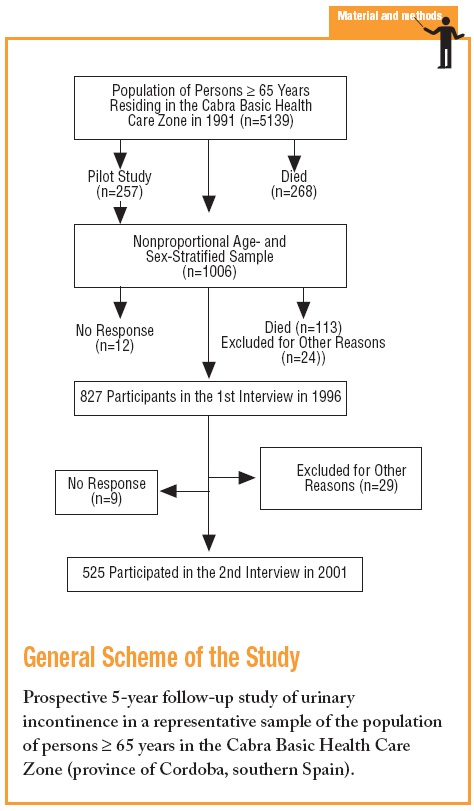
The study was carried out in the Cabra Basic Health Care Zone in the province of Cordoba, southern Spain, with 2 home interviews. The study population consisted of 5139 persons aged 65 years or more, according to the 1991 municipal census. This population included older persons living in residential care facilities. The first interview took place in June or July 1996. To refine the questionnaire and estimate sample size, we performed a pilot study with a nonproportional sample of 5% of the 5139 subjects (n=257). One third of these participants were assigned to each of the 3 age strata (65-74, 75-84, and >=85 years). This was done to include as many subjects as possible in older age groups. After we had determined the prevalence rates for each age group in the pilot study, the final sample for each age group was obtained by interviewing additional subjects until the required number was reached (the final numbers included those interviewed in the pilot study). The size of the final sample and of each age group was calculated to estimate prevalence with a precision of ±3% and a 95% confidence level. The results of the first interview were reported in an earlier publication.10
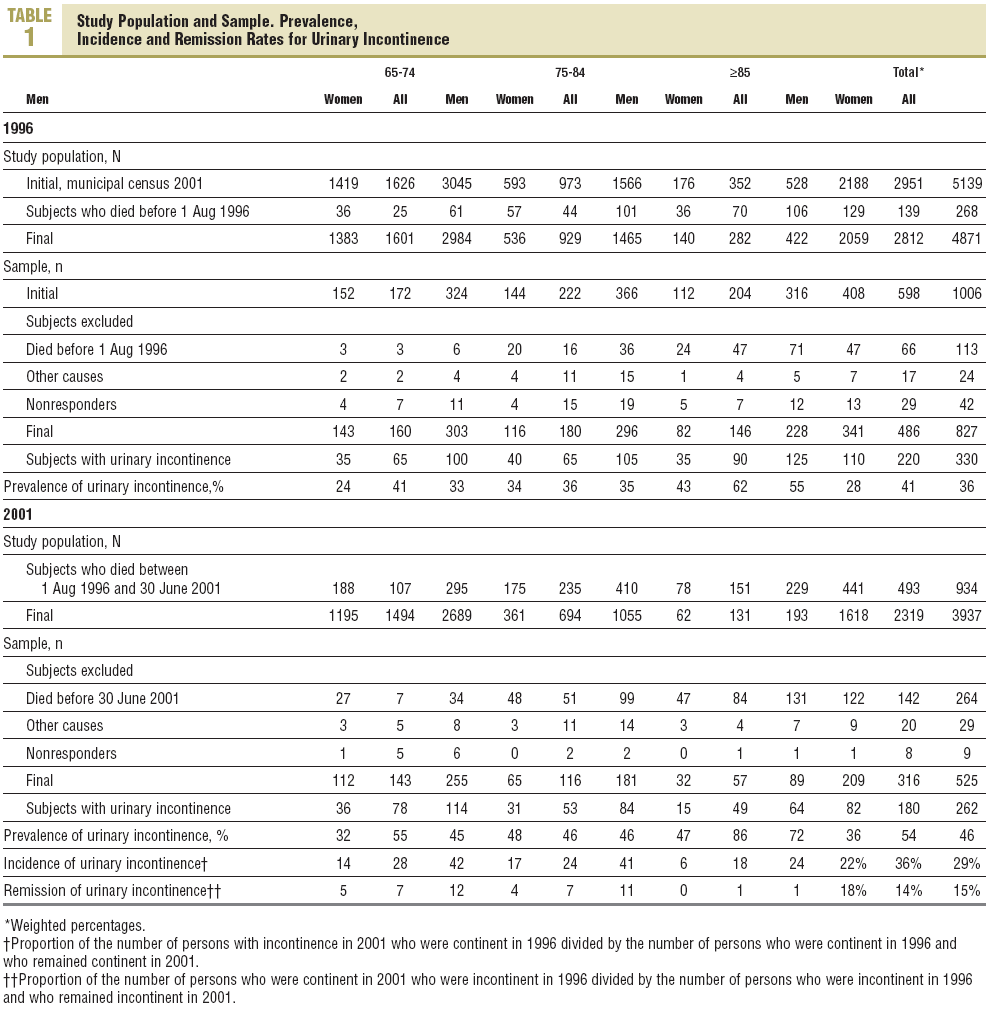
The second interview took place in May or June 2001. The data reported here were obtained for a total of 525 subjects who took part in both interviews, and 302 subjects who participated in the first interview but died during the ensuing 5 years, or who were excluded from the second interview (Table 1).
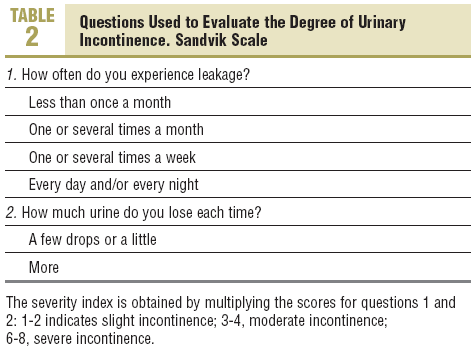
One week before the interview a letter was sent to each person. If the individual was hospitalized at the time, the interview was scheduled for 30 days after discharge. Data were recorded by 3 interviewers who were specially trained for this study. If the subject had a hearing impairment, aphasia or cognitive impairment, answers provided by a close relative or friend were recorded. To detect UI we used 2 questions: "Do you have involuntary or unexpected losses of urine without being able to help it?" and "Do you wet your underwear, street clothes or bedclothes unintentionally?" We defined UI as an affirmative answer to either of the 2 questions or as the use of a urethral catheter12,13 or pads. Only persons with incontinence completed the rest of the questionnaire. To grade the severity of UI we used the Sandvik scale,13 which categorizes UI as slight, moderate or severe (Table 2). The questionnaire also contained items covering sociodemographic information and functional status, which was evaluated with the Barthel Index as modified by Shah.14 The item on this index dealing with UI was omitted, so that the maximum score was 90 points.
The data were analyzed with basic statistical measures (mean and standard deviation for quantitative data, percentages for qualitative data) with the SPSS. To compare functional characteristics at the beginning and the end of the study we used Student's t test and Wilcoxon's nonparametric one-tailed test. Two logistic regression models were developed to identify variables that explained the likelihood of being alive and of developing UI. Because of the type of sampling used in this study, we used weightings to ensure proportionality when the overall results were reported. To estimate the proportion (p) of UI we considered sampling to be nonproportional with 3 age groups, such that where N was population size, N1, N2, and N3 were the number of persons in each age stratum, and n1, n2, and n3 were the respective sample sizes.
Results
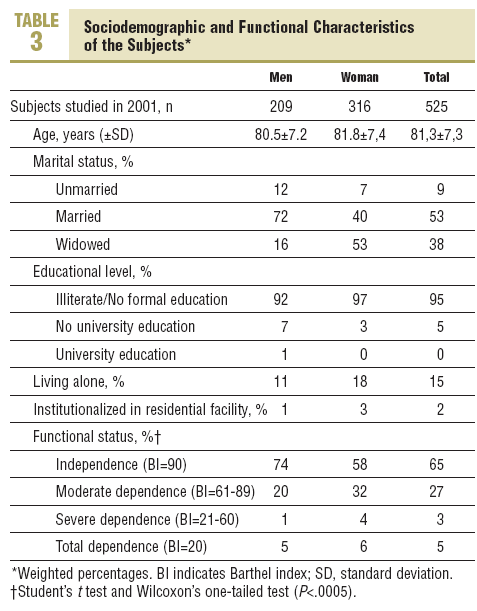
At the start of the study in 1996 we selected 1006 persons, 827 of whom we were able to interview. Five years later, 293 subjects (35%) were excluded from the 2001 survey (264 had died and 29 had moved out of the health care zone). The percentage of persons who died was higher (P<.05) among men (27% vs 18%). Of the remaining 534 participants, 9 (2%) did not respond (7 could not be located after 2 visits and 2 declined to participate). We therefore interviewed a total of 525 subjects, for a response rate of 98% (Table 1). The sociodemographic and functional characteristics of the 525 subjects are summarized in Table 3.
In 1996 the prevalence of UI was 36% (95% CI, 33%-38%) in the general population, 41% (95% CI, 38%-44%) in women, and 28% (95% CI, 24%-33%) in men (Table 1). Five years later the prevalence had increased to 46% (95% CI, 43%-50%) in the general population, to 54% (95% CI, 50%-57%) in women, and to 36% (95% CI, 30%-43%) in men. At both times the prevalence was higher among women (P<.001). Overall prevalence and the prevalence in women were significantly higher (P<.001 and P<.01, respectively) in 2001, although the increase in prevalence in men was not significant.
During the period from 1996 to 2001, 107 persons became incontinent (29%; 95% CI, 27%-30%) and incontinence remitted in only 24 (15%; 95% CI, 14%-16%). The incidence was higher (P<.01) in women (36%; 95% CI, 34%-37%) than in men (22%; 95% CI, 19%-25%) and decreased significantly (P<.025) with age. However, the remission rate was higher in women (14%; 95% CI, 13%-15% vs 18%; 5% CI, 17%-19%), although the difference was not significant and also decreased as age increased (P<.05).
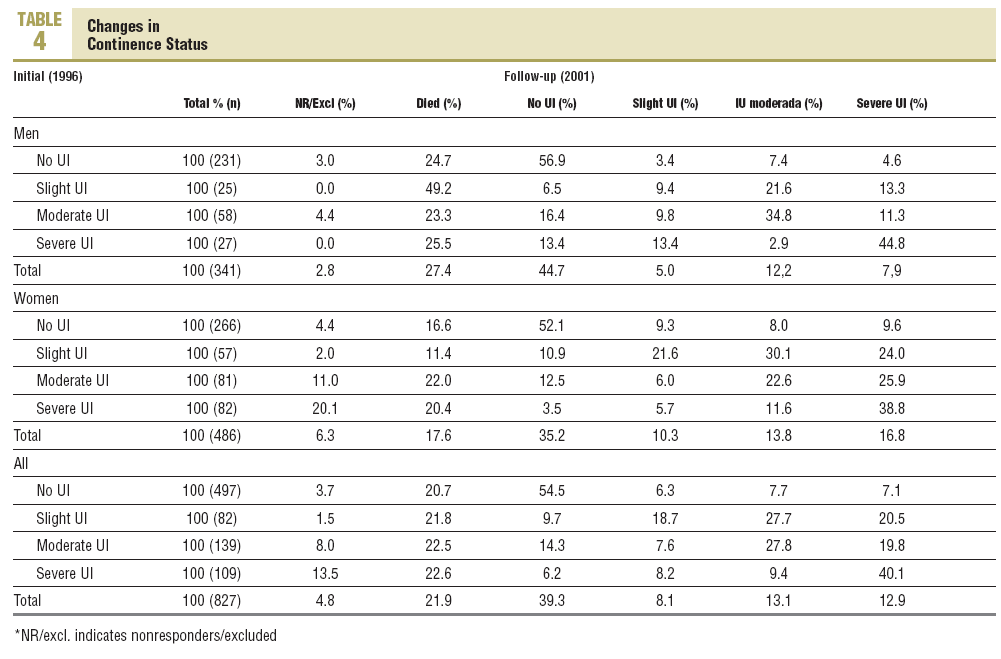
Of the 497 continent subjects in 1996, 54.5% remained continent 5 years later and 21% progressed (in similar proportions) to slight, moderate or severe grades of UI (Table 4). Women who became incontinent developed, in almost equal proportions, slight or severe incontinence, whereas men more frequently progressed to moderate incontinence. In both sexes slight and moderate UI progressed mainly toward more severe grades (moderate and severe, respectively). Patients with severe UI in 1996 showed the smallest changes in degree of severity (40.1% also had severe incontinence 5 years later), and tended to show improvement to slight incontinence, whereas women tended to improve only toward moderate incontinence. Remission rates were low in persons with severe incontinence (6.2%) and higher in those with moderate UI (14.3%) than in persons with slight UI (9.7%). Mortality rates were similar in continent and incontinent persons.
In 1996 the most frequent form of UI in both sexes was moderate, followed by slight and severe incontinence (Table 4). In 2001 the predominant types of incontinence were moderate in men, and severe in women. After 5 years slight UI showed little or no decrease in men or women (1.2%), moderate UI showed a small increase (2.1%), and severe UI became twice as common. In 1996 and 2001 the percentage of women with slight or severe UI was twice the percentage in men, and the percentage of women with moderate UI was also greater than in men, but only slightly so (by less than 1%).
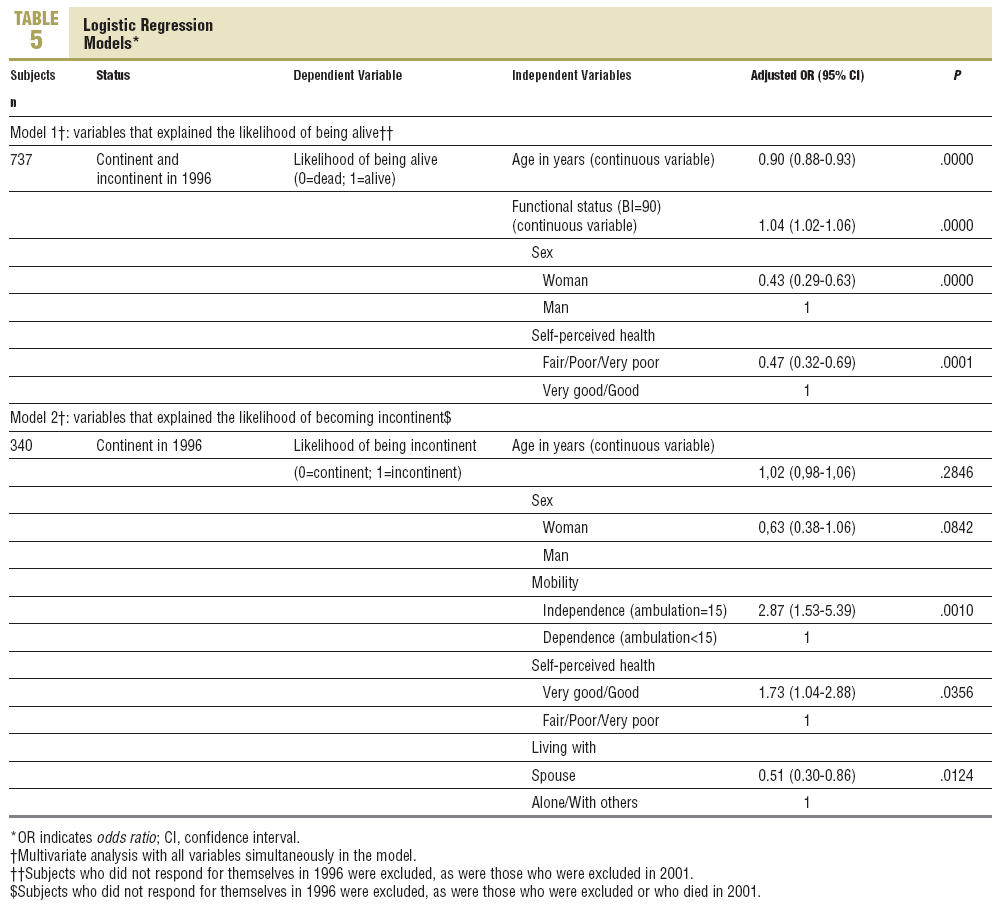
Table 5 presents the logistic regression models used in this study. In the first model, younger age, female sex, better functional status, and a positive perception of ones own health increased the likelihood of being alive 5 years later. In the second model, impaired mobility, poor self-perceived health, not living with a spouse or partner, and female sex were risk factors for the appearance of UI 5 years later.
Discussion
This is the first Spanish study designed specifically to investigate the natural history of UI in older people. Our most relevant findings are the elevated response rate, the high prevalence, moderate incidence and low rate of remission of UI. In most cases remission was considered spontaneous, as our health care zone did not operate a program for the detection, diagnosis and treatment of UI until 1 March 2001.15
Those few studies that have investigated the natural history of UI can be divided into 2 groups. One comprises studies involving older people in the USA and Australia,6-8 and reporting high rates of prevalence (from 23% to 41% depending on the type of UI), incidence (10%-20% annually, and 20%-30% over 3 years) and remission (from 12% to 30% annually, and 22%-25% over 3 years). These studies used a broad definition of UI, and the diagnosis was confirmed by clinical examination only in the study by Herzog et al.6 The second group consists of studies in Scandinavian, New Zealand, and Japanese populations,3-5,16 reporting low rates of prevalence (generally below 17% except for the study by Holtedahl and Hunskaar,16 which reported a prevalence of 47%), incidence (from 0.6% annually to 11% over 20 years), and remission (0% annually, 13% over 3 years, and 0% over 20 years). These studies also used a broad definition of UI, although most of them confirmed the diagnosis by clinical examination. Our study, with methods similar to those of the first group, found a prevalence rate as high as in those earlier studies, but our incidence and remission rates were much lower than in this group. However, our figures were higher than in the second group of studies.
Our figures deserve some comment. The incidence we found was practically twice the remission rate, a situation that led to a steady increase in the prevalence of UI. In 5 years the overall prevalence of UI increased by 10% and UI was found in 46% of all survivors, with a much greater increase in women (54%). These data show that in older
people, UI is a problem related with age and sex.8
Only Herzog et al6 studied the patterns of change in the degrees of severity of UI in detail. Our results are similar to theirs in that practically half of the continent subjects had never been incontinent, the incidence was higher then the remission rate, remission rate was higher in men, and severe forms of UI remained more stable with time than slight or moderate forms. The longer time period of our study (5 years) compared to the study by Herzog et al (1 year) may account for the differences in the changes in severity patterns with time. In 1996 and 2001, the most frequent degree of UI in our study was moderate, followed by severe and slight. Herzog et al found,6 in contrast, that slight UI was the most frequent form, followed by moderate and severe UI. Unlike Herzog et al, we found that severe UI was more stable in men, and coursed mainly with remission or to slight UI. This may be because the most frequent types of UI in men were functional incontinence and urgency incontinence, often caused by physical or cognitive impairment, neurological problems (diabetes, stroke, Parkinson's disease), benign hyperplasia of the prostate, and intestinal infection or dysfunction, all of which are relatively amenable to treatment.2 As a result UI can be cured or may evolve toward slight incontinence in more than 25% of the cases. The lower remission rate for severe UI in women may be explainable because women are less likely to tell health care professionals about the problem,17 because of its multifactorial origin, and the greater difficulty of treating female incontinence.
As in many earlier studies of UI,4,7,18-21 the variable most strongly associated with the appearance of UI in the older people we studied was impaired mobility. This finding corroborates the importance of the functional component of UI in older persons--a factor that is modifiable and preventable, but that is rarely mentioned in the literature.22
In our setting, mortality, as in other studies,23,24 affected continent and incontinent persons alike; in other words UI in the older people we studied was not a risk factor for mortality. However, others4,5,25 have found that UI is an independent risk factor for mortality. Some of the factors that influence survival in our population of older people were also noted by Herzog et al6 (age and self-perceived health), Nakanishi et al25 (age, female sex, self-perceived health) and Koyano et al5 (independence in performing basic activities of daily living).
Our study is not without limitations. Firstly, incontinence was not demonstrated objectively. However, the prevalence of UI determined with objective measures differs only slightly from that found with questionnaires.19 Secondly, we did not estimate the reliability of the questions used by different interviewers. Nonetheless, the same health professionals were interviewers on both occasions, and were trained specifically for this study. Thirdly, the survey did not inquire about the type of UI or record information on comorbidity.
Urinary incontinence in older people is frequent, becomes more frequent as the population ages further, has a low rate of spontaneous remission, tends to worsen, and is associated with functional dependence. These factors mean that health care professionals are faced with a two-fold task. On one hand they must try to prevent or delay functional disability and other modifiable risk factors for UI with early identification and treatment. In addition, they should initiate a program for the detection, diagnosis and treatment of urinary incontinence that will lead to remission or at least slow its progression to more severe forms.


