
Unstable fluctuations in financial markets caused by the 2008 financial crisis and currently by the Covid-19 crisis have generated greater concern among investors regarding their capital protection. In view of this situation, the consideration of alternative investments has taken a relevant position to protect their wealth and obtain profits. Due to the relevance of these investments in these times, this study proposes using artificial intelligence to predict the value of alternative investments, specifically the numismatic asset the Walking Liberty Half Dollar. To achieve this objective, the use of Generalized Regression Neural Networks has been proposed over a sample 25 coins of the Walking Liberty Half Dollar with several qualities valued in the period 2000-2019. Two models were proposed, one for the entire selected sample and the other one for each type of coin depending on its year of minting. Thus, it has been found that the model proposed for the entire sample has a success rate of between 86.12% and 97% while the approach for each type of coin obtained success rates that even reach 100%. The variables that have the greatest influence within the model are the state of conservation of the coin, its age, and its exclusivity. In this way, these results provide fundamental information to investors to understand the behaviour of these assets, and to be able to formulate more profitable investment portfolios, especially in times of great economic instability.
The current economic situation is causing investors to seek new investment alternatives to protect their capital. In this economic framework, the main world powers have invested heavily in alternative products to protect their investments, with collectibles occupying a relevant position. In this sense, McAndrew (2018) affirms that the art market obtained its second-best result in the last decade in 2018. The reason for this is due to the return of these assets. In long-term time horizons, the average returns of the main alternative products are between 50% and more than 200%, reflected in the reports made by the consulting firm Knight Frank (2018).
Several studies have shown the suitability of investing in alternative assets. Regarding the art market, studies such as those by Stein (1977) analyse the performance obtained by artworks by deceased authors. Other studies focused on the numismatic market show how investment portfolios that included numismatic assets were more profitable than those that did not (Lombra, 2004; Prado Román, 2012). Framing ourselves in the auction markets, several studies have highlighted the high returns of the philatelic and numismatic markets (Brown, 2005; Knaus, 2007; Mochon, 2003, 2005).
However, and despite the different studies on the return of alternative investments, investors are wary of an investment market that they do not understand. In this line, studies have been carried out that made it possible to classify numismatic assets from the point of view of American investment assets (Berman & Shulman, 1983). Also, Investments in currencies have been studied, focusing on American financial assets (Sharpe & Alexander, 1990), as well as the behaviour of the prices of Latin American artworks at Sotheby's and Christie's auction houses in New York to the period 1977-1996 (Ekelund et al., 2001), and the numismatic assets minted in gold (Prado Román, 2009). Also, the return of the American stamp market was studied, and it was determined that said investment was estimated based on economic variables (Cardell et al., 1995). Thus, inflation is a variable that significantly affects the appreciation of stamps (Coca Pérez, 1998).
Having analysed this, it is necessary to formulate a more complete model that enables to determine the behaviour of international numismatic investments. In this way, the investor will have a tool that will allow him/her to determine the future values of numismatic alternative investments within such an unstable world economic framework. To this end, we propose developing a model based on Generalized Regression Neural Networks to predict the future value of investments in collectors´ items. This methodology has been applied in several subjects and it stands out in the financial field in predicting the exchange rate (Chen & Leung, 2004), currency crises (Yu et al., 2006), bank insolvency (Al-Shayea & El-Refae, 2012) and stock market returns (Shahpazov et al., 2013), among others.
In this study, we propose to build a Generalized Regression Neural Networks model to predict the value of the Walking Liberty Half Dollar. For this purpose, a sample of 25 coins issued between 1916 and 1947 of different types of quality, for the valuation period from 2000 to 2019 has been selected. Two models were proposed, one for the entire selected sample and the other one for each type of coin depending on its year of minting. Thus, it has been found that the model proposed for the entire sample has a success rate of between 86.12% and 97% while the approach to individual models for each type of coin obtained success rates that even reach 100%.
These findings are useful for investors as they enable them to predict the value of alternative investments, specifically numismatic investments, to obtain higher returns. In addition, a greater knowledge of the possible future value of these coins enables to increase investors´ confidence level in this type of asset.
From this point, the study is structured as follows:
In the Second section, the theoretical framework in which this study evolves is analysed. The methodology chosen is discussed in the Third section. The data used are explained and justified in the Fourth section. The Fifth section shows the results obtained and their discussion. And finally, the conclusions obtained in this study are exposed in the Sixth section.
2Theoretical frameworkThe analysis of the variables of a market can make it possible to predict its results (Leung et al., 2000) and increase investor confidence, which becomes a fundamental tool for making investment decisions, especially in situations of financial instability like the current one. Based on Marinao et al., and Torres (2012), we can define confidence in the investment field as the reliability of all the elements that can condition an investment process or following Paule-Vianez et al. (2020), as the reliability of investors on their expectations or judgments about the value of assets. Confidence can be built by knowing how different markets work and the factors that influence them, which can make the difference between the success or failure of an activity. According to this, it has been shown that in any market there is a variable that is essential for any type of stable and lasting commercial relationship to be established: trust (Moorman et al., 1993). Confidence can be built by knowing how different markets work, and the factors that influence them, which can make the difference between the success or failure of an activity.
Several investigations have been formulated to predict future stock returns through the behavior of their respective prices (Lo & MacKinley, 1988), a certain activity (Fernández, 2008; Luera Peña & Minim, 2001), or the behavior of the stock market indices themselves (Chopra et al., 1992; Parisi et al., 2003; Poterba & Summers, 1988).
Returns from a market are the result of variables that relate to each other within it (Ferson & Harvey, 1991). Therefore, the analysis of the variables of a market may allow predicting the results of it (Leung et al., 2000), which becomes a fundamental tool for investment decision-making, especially in situations of financial instability (Cardell et al., 1995; Pommerehne, 1997; Prado Román, 2009).
Corresponding to the above, the investigations have focused on deepening any type of variable that directly or indirectly affects it. In 1952, the acclaimed economist Harry Markowitz (1952) determined that if investors can act rationally, they will select those portfolios that allow them to obtain the maximum profit with the least possible risk. In the same decade, Darling (1955) made a great discovery, pointing out that the relationships between dividends and profits in investments can be determined by the mood of investors. Thus, several authors confirm that the mood of investors has a great impact on the return of investments (Corredor et al., 2013; Gómez-Martínez & Prado-Román, 2014; Hirshleifer & Shumway, 2003; Nofsinguer, 2005; Sun et al., 2020; Zhang, 2014).
The consideration of investment in collectibles such as art, numismatics, philately, etc.is not a residual issue. Chanel (1995) analyses the relationship between the art market and financial markets, finding that financial crisis situations cause damage to stock markets and highlighted investing in art as a suitable alternative. Also, regarding the art market, Mei and Moses (2002) observe how investment in works of art had a higher return than some investments in fixed income and how the consideration of works of art could be a good option to build long-term diversified investment portfolios. Campbell (2008) analyses art investments as a type of alternative asset over a 25-year period, observing that, although accessibility to this type of investment is not within the reach of any conventional investor, it is an alternative that provides benefits by including these types of assets in an investment portfolio. Regarding the philatelic market, Torres Pruñonosa and Coca Pérez (2005) compared philatelic investment with real estate investment in times of economic recession, showing that return on investment in real estate was negative and lower than on philatelic investment. This issue led authors to suggest the possible safe-haven role played by philately. Prado Román et al. (2012) proposed building different portfolios composed of gold and noble metal numismatic assets (gold, silver, platinum, palladium and rhodium). They conclude that investments in non-financial assets can be used as risk diversifiers as they do not belong to the financial market. Öztürkkal and Togan-Eğrican (2020) studied the behaviour of investment in Turkish art and its possible consideration for diversifying investment portfolios. Their results showed how investment in this type of collectible assets offered a low or negative correlation with other investment assets, concluding that investing in collectibles can be considered a hedging option to reduce portfolio volatility in times of uncertainty.
The key to the market for alternative investments is the lack of investor awareness of the functioning of the market, which generates distrust of it. Research has therefore been conducted to try to reduce this uncertainty. In this regard, Macías Guillén (2015) conducted an in-depth bibliographic review on all the possible factors that could be relevant for the value of art as an investment. Prado Román et al. (2018) also formulated a neural network model for alternative investments, by using five explanatory variables. They show that is possible to predict the future value of these investments with an accuracy rate greater than 90%. Subsequently, Santos and González (2019) studied the ECUs issued by Spain in the period 1989-1996, analysing their emergence in Spanish numismatic auctions from 2011 to 2019.
Therefore, in order to increase investor confidence in these types of alternative investments and due to their own characteristics, such as high return and their safe haven nature, this study proposes a model to predict the value of this type of investment, specifically, the Walking Liberty Half Dollar. This American collector coin is highly significant in the numismatic market due to its years of minting, coinciding with moments or periods of historical importance such as the World Wars or the Crash of 1929.
3MethodologyThe method chosen to predict the value of the Walking Liberty Half Dollars Artificial Neural Networks and within it, Generalized Regression Neural Networks.
With the rapid progress of computing and the growing popularity of artificial intelligence, more and more researchers and professionals are adopting Artificial Neural Networks for financial forecasting (Chen & Leung, 2014), showing its suitability for forecasting time series with a high accuracy level (Shahpazov et al., 2013).
Artificial Neural Networks have similar characteristics to those of the human brain, such as the ability to learn from experience, the generalization of past events in relation to new events, and the ability to abstract the main characteristics of data series (Paule-Vianez et al., 2020). Some of the advantages they have are their ability to learn and adapt to a set of data, capture non-linear relationships between variables and the absence of the need to know functional forms beforehand (Wilson & Sharda, 1994).
Within the various types of neural networks, in this study, the Generalized Regression Neural Network proposed and developed by Specht (1991) has been selected. This network is used for the estimation of continuous variables like in standard regression techniques and is related to radial-based networks.
Generalized Regression Neural Networks require supervised learning and can estimate any arbitrary relationship from historical data. The following are included as the advantages of this technique: simple and fast learning, discriminatory capacity against outliers, ability to handle linear and non-linear data, optimal regression with a large number of samples, etc.
This type of network is based on estimating the most probable output value from an input vector. To do this, during training, the Generalized Regression Neural Networks establish the joint density function for each x-y sample. In this way, these networks are based on the following formula:
Where y is the output value estimated by the Generalized Regression Neural Network, x is the input vector for the estimation of y, E[y/x] is the value of the expected output, given the input vector x, and f(x,y) is the joint probability density function of x and y that the Generalized Regression Neural Network learned from the set of training data.
In Figure 1, the basic architecture of a Generalized Regression Neural Network can be observed.

Fig. 1 shows how Generalized Regression Neural Networks consist of four layers of neurons: input, pattern, summation and output layer. In the first layer (input layer), an input vector of x is presented to the network for processing. Therefore, the number of neurons contained in this layer coincides with the number of pelements of the input vector. The input data pass to the second layer (pattern layer), where each training vector is represented by a single neuron. The output of the neurons of the pattern layer θi, is generated by transforming the input of the neurons of the input layer following the multivariate extension of Cacoullos (1966) for the Gaussian function and is represented as:
Where θiis the output of the i-th neuron of the pattern layer, σ is a set of smoothing parameters and ϕixis the input portion of the i-th neuron in the pattern layer.
Subsequently, the neurons of the pattern layer are connected with each of the neurons of the third layer (summation layer), where the neurons are added. Two groups of neurons can be distinguished among the neurons of the summation layer, the numerator and the denominator neurons. The group of numerator neurons is responsible for calculating the weighted sum of the outputs of the pattern neurons as shown in the following formula:
Where Sjis the output of the j-th numerator neuron, and wijis the weight assigned to the connection of the i-th neuron in the pattern layer and the j-th neuron in the summation layer.
The value of the wijweight is established by learning in training. During supervised training, training samples are presented one by one to the input layer and a single neuron is established for each training vector. The assignment of weights follows the values of the output portion of each training vector ϕiy such that:
Where yjiis the j-th element of the output portion of the training vector ϕi.
Regarding the other group of the summation layer, the denominator group, it only has one neuron that is calculated as the simple arithmetic sum of the pattern neurons:
Where Sdis the output of the denominator neuron.
In the last layer (output layer), each of the neurons is a mathematical processor that performs the division of the outputs, calculated by the numerator neurons and the denominator of the summation layer. So each output neuron would be expressed as:

This process is repeated until all cases have passed the network.
In this study, this methodology has been implemented to predict the value of the Walking LibertyHalf Dollar of all its coins issued jointly, as well as for those coins issued in different years independently. Thus, we were not only able to get much closer to the real value of the coin issued in a year by taking only records of that coin, but we were also able to compare the coins depending on the predictability of their value based on the selected variables.
To build the different models proposed to determine the value of the Walking Liberty Half Dollar, the sample has been divided into 80% for the training set and 20% for the test set. NeuralTools software has been used.
4DataWith the aim of building a model to predict the future value of numismatic assets, in this study, one of the most representative collector coins at international level has been selected for this study: Walking Liberty Half Dollar. The reason for choosing numismatic investments is because it is one of the assets that has the best long-term returns, as indicated in The Wealth Report in 2018 made by the consultancy firm Knight Frank, with only the return of investment in vintage cars being higher but having a higher maintenance cost. The reason for choosing this collector coin over others lies in the fact that this coin is one of the most emblematic in the US market, which is, together with China and the UK, one of the main alternative investment markets according to Art Basel. Its relevance is due to the high revaluations that these coins have during the period selected for the study, which covers from 2000 to 2019. Dividing the sample by year of minting, we find the following revaluations:
- •
Coins minted between 1916 and 1920: 200%-250%.
- •
Coins minted between 1921 and 1929: 200%-329%.
- •
Coins minted between 1931 and 1940: 200%-317%.
- •
Coins minted between 1941 and 1947: 200%-300%.
Walking Liberty Half Dollar sample taken amounts to a total of 25 coins of different qualities, issued from 1916 to 1947 and valued in the period from 2000 to 2019. The justification for selecting this period is that during this period there are both crises and times of economic prosperity. The corresponding valuations of the coins in the sample belong to the prestigious catalogue of “Standard Catalogue World Coins”. This catalogue is produced annually by experts in the sector and collects the valuations of coins based on the economic variations of each one, recorded during the corresponding year in the numismatic market.
To build the model with which to predict the value of the Walking Liberty Half Dollar, the following have been considered as explanatory variables of the value of this collector coin: (1) the quality of the coin; (2) the year the coin was minted; (3) the mintage of the coin; (4) the price of the metal in which the coin has been minted, in this case silver; (5) the price of one of the most representative stock indexes of its main market, in this case the Dow Jones Industrial Average has been selected; (6) the Gross Domestic Product (GDP) per capita of the United States; (7) the Consumer Price Index (CPI) of the United States; and (8) the Dollar-Euro exchange rate.
The justification for including the variables year of minting, coin quality and coin mintage lies in the fact that not all the Walking Liberty Half Dollar coins in circulation arouse the same interest in the alternative investment market over time. Walking Liberty Half Dollar is a coin that was in circulation between 1916 and 1947, so this coin collects very relevant world situations such as the Crash of 29 or World Wars. This leads to the fact that representative coins of certain events generate a greater interest than others. The quality of the coin is also a relevant factor in its valuation, with 8 types of the Walking Liberty Half Dollar qualities being found. The minimum quality of this coin is “G4”, which determines acceptable quality and “MS-65” reflects the maximum quality. Finally, the coin mintage (number of coins minted in the different minting years) has been considered because a higher or lower supply of these goods is highly related to their market value, so considering their mintage is decisive when valuing numismatic assets (Prado Román, 2009).
Regarding the price variables of the Dow Jones and silver stock indexes, the justification for including the Dow Jones is due to the fact that it is a reference index in the United States stock market, being representative of the value of traditional financial investments in this country. Thus, based on the consideration of collectors´ items as safe-haven assets, an inverse relationship between the price of traditional investments and alternative investments could be expected. Regarding the price of the composition metal of the coin, it is one of the fundamental variables considered by the literature to express the value of numismatic assets (Santos & González, 2019).
Regarding macroeconomic variables, including per capita income has been considered relevant because as indicated by Prado Román (2012), the performance of the auction market depends on the purchasing power of its investors or collectors, so if they don't have a high purchasing power, there may be a decrease in the value of the auctioned good. In turn, the CPI is a relevant variable to consider when evaluating investments as determined by Coca Pérez (1998), who demonstrated that inflation is a variable that affects the revaluation of stamps significantly. Lastly, the Dollar-Euro exchange rate was also included due to the influence of this exchange rate on the attractiveness of US investments compared to those of other countries.
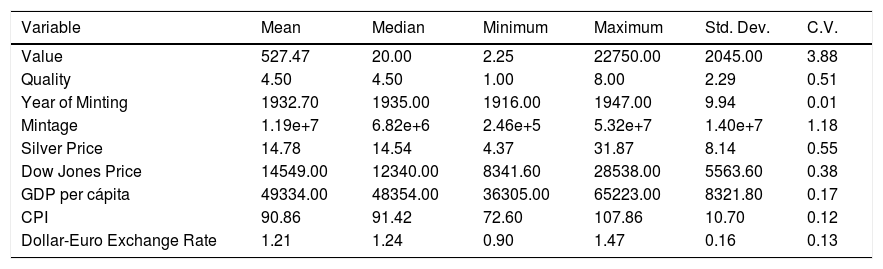
Following this, Table 1 shows the descriptive statistics of the variables under study. It is observed how the value of these coins is highly variable, being between a minimum of 2.25 dollars in the year 2000 for those coins of lower quality issued between 1940 and 1946, and a maximum of 22,750 dollars in 2016, corresponding to a higher quality coin issued in 1921. Therefore, the value variable is the variable under study that shows a greater dispersion measured by the coefficient of variation (C.V. = 3.88). Following the value, the mintage is the second variable with the greatest dispersion (CV = 1.18), finding that the average mintage is 11,900,000 units and the coin with the lowest mintage was issued in 1921, with 246,000 units, and the coin with the highest mintage was issued in 1943 with 53,190,000 units.
Descriptive statistics of the variables under study.
| Variable | Mean | Median | Minimum | Maximum | Std. Dev. | C.V. |
|---|---|---|---|---|---|---|
| Value | 527.47 | 20.00 | 2.25 | 22750.00 | 2045.00 | 3.88 |
| Quality | 4.50 | 4.50 | 1.00 | 8.00 | 2.29 | 0.51 |
| Year of Minting | 1932.70 | 1935.00 | 1916.00 | 1947.00 | 9.94 | 0.01 |
| Mintage | 1.19e+7 | 6.82e+6 | 2.46e+5 | 5.32e+7 | 1.40e+7 | 1.18 |
| Silver Price | 14.78 | 14.54 | 4.37 | 31.87 | 8.14 | 0.55 |
| Dow Jones Price | 14549.00 | 12340.00 | 8341.60 | 28538.00 | 5563.60 | 0.38 |
| GDP per cápita | 49334.00 | 48354.00 | 36305.00 | 65223.00 | 8321.80 | 0.17 |
| CPI | 90.86 | 91.42 | 72.60 | 107.86 | 10.70 | 0.12 |
| Dollar-Euro Exchange Rate | 1.21 | 1.24 | 0.90 | 1.47 | 0.16 | 0.13 |
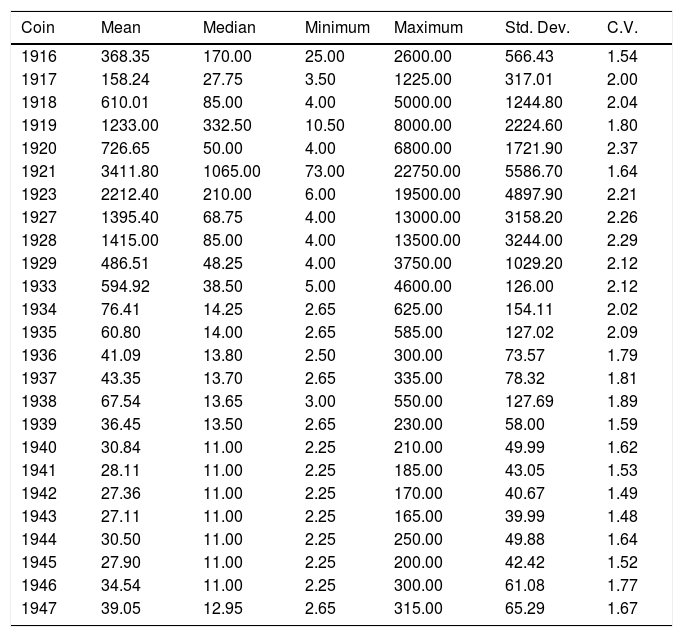
In line with our objective of building a general model to predict the value of the Walking Liberty Half Dollar and an individualized model by year of minting, it is important to make a prior descriptive analysis of the coin value by year of minting.
Table 2 shows the descriptive statistics of the value of the coins issued in different years. Thus, with this analysis we can see that on average, the coin issued in 1921 has the highest value ($ 3,411), followed by the one issued in 1923 ($ 2,212.40). On the contrary, the coins that have a lower average value are those issued in 1941, 1942, 1943 and 1945, which are below 30 dollars. In line with the above, a positive relationship is shown between the age of the coin and its value. However, the great variability of the value of these coins compared to other assets is striking, which supports the high returns found in investing in numismatic assets compared to more traditional investments (Lombra, 2004; Maslar et al., 2020; Prado Román, 2009; Stein, 1977). Regarding dispersion, it is shown that in percentage terms, the dispersion of the expectation against its deviation is between 1.48, corresponding to the coin issued in 1943, and 2.37 corresponding to the coin issued in 1920.
Descriptive statistics of the value of coins issued between 1916 and 1947.
| Coin | Mean | Median | Minimum | Maximum | Std. Dev. | C.V. |
|---|---|---|---|---|---|---|
| 1916 | 368.35 | 170.00 | 25.00 | 2600.00 | 566.43 | 1.54 |
| 1917 | 158.24 | 27.75 | 3.50 | 1225.00 | 317.01 | 2.00 |
| 1918 | 610.01 | 85.00 | 4.00 | 5000.00 | 1244.80 | 2.04 |
| 1919 | 1233.00 | 332.50 | 10.50 | 8000.00 | 2224.60 | 1.80 |
| 1920 | 726.65 | 50.00 | 4.00 | 6800.00 | 1721.90 | 2.37 |
| 1921 | 3411.80 | 1065.00 | 73.00 | 22750.00 | 5586.70 | 1.64 |
| 1923 | 2212.40 | 210.00 | 6.00 | 19500.00 | 4897.90 | 2.21 |
| 1927 | 1395.40 | 68.75 | 4.00 | 13000.00 | 3158.20 | 2.26 |
| 1928 | 1415.00 | 85.00 | 4.00 | 13500.00 | 3244.00 | 2.29 |
| 1929 | 486.51 | 48.25 | 4.00 | 3750.00 | 1029.20 | 2.12 |
| 1933 | 594.92 | 38.50 | 5.00 | 4600.00 | 126.00 | 2.12 |
| 1934 | 76.41 | 14.25 | 2.65 | 625.00 | 154.11 | 2.02 |
| 1935 | 60.80 | 14.00 | 2.65 | 585.00 | 127.02 | 2.09 |
| 1936 | 41.09 | 13.80 | 2.50 | 300.00 | 73.57 | 1.79 |
| 1937 | 43.35 | 13.70 | 2.65 | 335.00 | 78.32 | 1.81 |
| 1938 | 67.54 | 13.65 | 3.00 | 550.00 | 127.69 | 1.89 |
| 1939 | 36.45 | 13.50 | 2.65 | 230.00 | 58.00 | 1.59 |
| 1940 | 30.84 | 11.00 | 2.25 | 210.00 | 49.99 | 1.62 |
| 1941 | 28.11 | 11.00 | 2.25 | 185.00 | 43.05 | 1.53 |
| 1942 | 27.36 | 11.00 | 2.25 | 170.00 | 40.67 | 1.49 |
| 1943 | 27.11 | 11.00 | 2.25 | 165.00 | 39.99 | 1.48 |
| 1944 | 30.50 | 11.00 | 2.25 | 250.00 | 49.88 | 1.64 |
| 1945 | 27.90 | 11.00 | 2.25 | 200.00 | 42.42 | 1.52 |
| 1946 | 34.54 | 11.00 | 2.25 | 300.00 | 61.08 | 1.77 |
| 1947 | 39.05 | 12.95 | 2.65 | 315.00 | 65.29 | 1.67 |
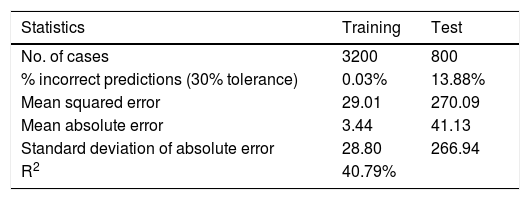
This section shows the results obtained with the Generalized Regression Neural Network to predict the value of the Walking Liberty Half Dollar.
Table 3 shows the results obtained using the entire sample. It can be seen how the proposed model makes about a 0.03% and 13.88% prediction error, that is, it has a success rate of about 97% and 86.12%, with a 30% tolerance. This result is in accordance with the success rates obtained by other models with neural networks for the prediction of numismatic goods such as Prado Román et al. (2018), among others, who achieved success rates higher than 90% with their models.
On the other hand, the mean squared error is 29.01 and 270.09 in the training and test subsamples respectively, and the mean absolute error is 3.44 in the training subsample and 41.13 in the test subsample. These errors allow us to see that although the error is minimumin the training subsample, in the test subsample, the values are more moderate. Similarly, the standard deviation is lower in the training subsample (28.80), taking into account the heterogeneity of the records analysed. However, in the test subsample there is a much higher standard deviation of absolute error (266.94). Based on these results, the model can be considered reliable, but with caution.
Regarding the explanatory capacity of the model, it is below 50%, with an R2 of 40.79%. This fact suggests that although the proposed model has a good predictive capacity, there are factors that explain the value of this collectors´ item that have not been considered. Another possible interpretation of the explanatory power of this model can be given by the significant number of different coinsthat have been included and which, as mentioned earlier, are not all valued equally and do not have to be affected in the same way by the same factors.
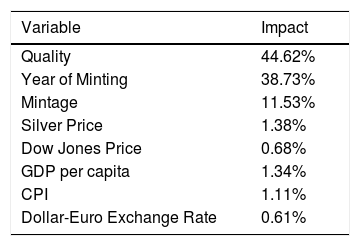
Taking into account the importance of each of the predictor variables in the model (Table 4), it is shown that the most important variable in the model to explain the value of the Walking Liberty Half Dollar is the quality of the coin (44.62%), followed by the year of minting (38.73%) and the mintage (11.53%). Therefore, the factors that most influence whether a coin has a higher or lower value are its state of conservation, its age and its exclusivity. In this way, it is evident that not all the Walking Liberty Half Dollar coins in circulation arouse the same interest in the alternative investment market over time and we support the statement of Prado Román (2009) that when it comes to valuing assets numismatics the coin mintage is a determining factor. On the contrary, it is found that the Dow Jones price and the Dollar-Euro exchange rate do not contribute even 1% to the model (0.68% and 0.61%, respectively). The low influence of the equity price is particularly striking, leading to question the safe haven nature associated with this numismatic asset.
However, not all coins have to behave the same. As shown, there are coins issued in some years that have a higher value than others which in turn, have experienced greater revaluations. This motivates the approach of individualized models for each coin according to its year of minting.
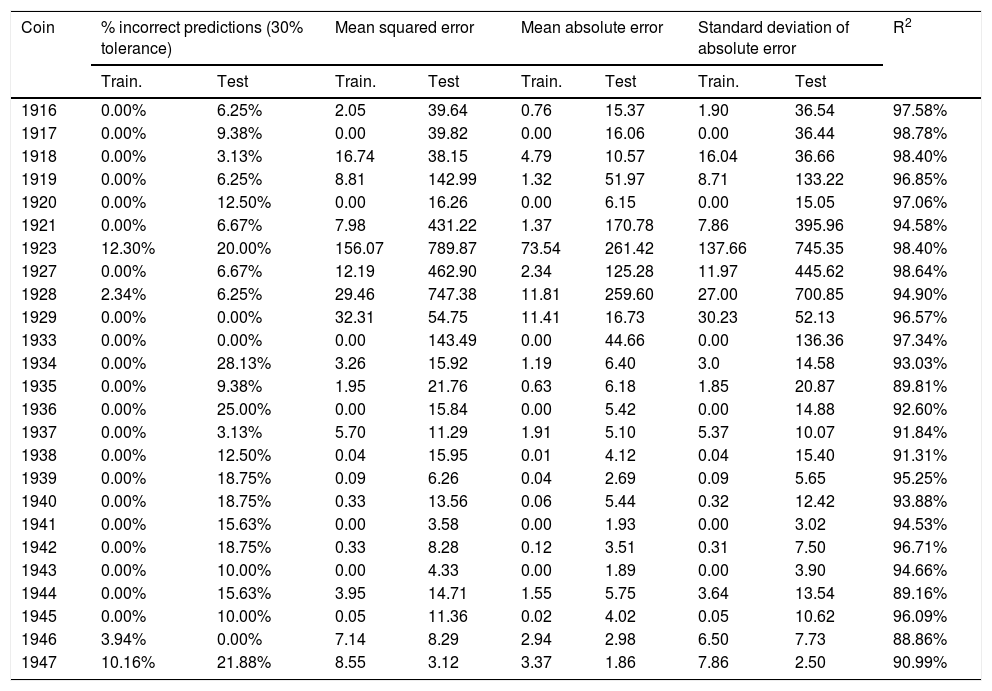
Table 5 shows the results obtained for the models built with Generalized Regression Neural Networks for each coin by year of minting. It is observed that when building individualized models, the coefficient of determination has been well above that obtained for the general model. Thus, we find that the model with a lower explanatory capacity regarding coin value is the one built for the coin issued in 1946, with an R2 of 88.86%, and that the model with a greater explanatory capacity has an R2 of 98.78%, corresponding to the coin issued in 1916. In addition, the success rate of these models has also improved significantly, in general terms, compared to that obtained in the general model. We find, for example, that the models proposed for the coins issued in 1929 and 1933 have a 100% success rate. Also, in general terms, it is shown that the mean squared error, the mean absolute error and the standard deviation of error show better values than for the general model. The above shows that not all coins behave the same, so it is important to predict their value to consider each coin individually, referring to each coin depending on the year when it was issued.
Results of Generalized Regression Neural Networks models for each coin by year of minting.
| Coin | % incorrect predictions (30% tolerance) | Mean squared error | Mean absolute error | Standard deviation of absolute error | R2 | ||||
|---|---|---|---|---|---|---|---|---|---|
| Train. | Test | Train. | Test | Train. | Test | Train. | Test | ||
| 1916 | 0.00% | 6.25% | 2.05 | 39.64 | 0.76 | 15.37 | 1.90 | 36.54 | 97.58% |
| 1917 | 0.00% | 9.38% | 0.00 | 39.82 | 0.00 | 16.06 | 0.00 | 36.44 | 98.78% |
| 1918 | 0.00% | 3.13% | 16.74 | 38.15 | 4.79 | 10.57 | 16.04 | 36.66 | 98.40% |
| 1919 | 0.00% | 6.25% | 8.81 | 142.99 | 1.32 | 51.97 | 8.71 | 133.22 | 96.85% |
| 1920 | 0.00% | 12.50% | 0.00 | 16.26 | 0.00 | 6.15 | 0.00 | 15.05 | 97.06% |
| 1921 | 0.00% | 6.67% | 7.98 | 431.22 | 1.37 | 170.78 | 7.86 | 395.96 | 94.58% |
| 1923 | 12.30% | 20.00% | 156.07 | 789.87 | 73.54 | 261.42 | 137.66 | 745.35 | 98.40% |
| 1927 | 0.00% | 6.67% | 12.19 | 462.90 | 2.34 | 125.28 | 11.97 | 445.62 | 98.64% |
| 1928 | 2.34% | 6.25% | 29.46 | 747.38 | 11.81 | 259.60 | 27.00 | 700.85 | 94.90% |
| 1929 | 0.00% | 0.00% | 32.31 | 54.75 | 11.41 | 16.73 | 30.23 | 52.13 | 96.57% |
| 1933 | 0.00% | 0.00% | 0.00 | 143.49 | 0.00 | 44.66 | 0.00 | 136.36 | 97.34% |
| 1934 | 0.00% | 28.13% | 3.26 | 15.92 | 1.19 | 6.40 | 3.0 | 14.58 | 93.03% |
| 1935 | 0.00% | 9.38% | 1.95 | 21.76 | 0.63 | 6.18 | 1.85 | 20.87 | 89.81% |
| 1936 | 0.00% | 25.00% | 0.00 | 15.84 | 0.00 | 5.42 | 0.00 | 14.88 | 92.60% |
| 1937 | 0.00% | 3.13% | 5.70 | 11.29 | 1.91 | 5.10 | 5.37 | 10.07 | 91.84% |
| 1938 | 0.00% | 12.50% | 0.04 | 15.95 | 0.01 | 4.12 | 0.04 | 15.40 | 91.31% |
| 1939 | 0.00% | 18.75% | 0.09 | 6.26 | 0.04 | 2.69 | 0.09 | 5.65 | 95.25% |
| 1940 | 0.00% | 18.75% | 0.33 | 13.56 | 0.06 | 5.44 | 0.32 | 12.42 | 93.88% |
| 1941 | 0.00% | 15.63% | 0.00 | 3.58 | 0.00 | 1.93 | 0.00 | 3.02 | 94.53% |
| 1942 | 0.00% | 18.75% | 0.33 | 8.28 | 0.12 | 3.51 | 0.31 | 7.50 | 96.71% |
| 1943 | 0.00% | 10.00% | 0.00 | 4.33 | 0.00 | 1.89 | 0.00 | 3.90 | 94.66% |
| 1944 | 0.00% | 15.63% | 3.95 | 14.71 | 1.55 | 5.75 | 3.64 | 13.54 | 89.16% |
| 1945 | 0.00% | 10.00% | 0.05 | 11.36 | 0.02 | 4.02 | 0.05 | 10.62 | 96.09% |
| 1946 | 3.94% | 0.00% | 7.14 | 8.29 | 2.94 | 2.98 | 6.50 | 7.73 | 88.86% |
| 1947 | 10.16% | 21.88% | 8.55 | 3.12 | 3.37 | 1.86 | 7.86 | 2.50 | 90.99% |
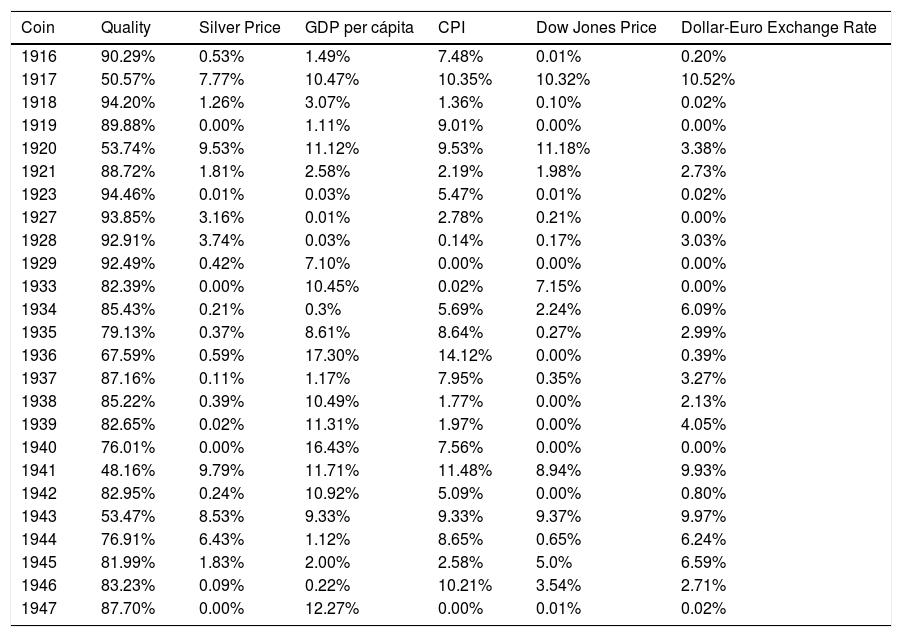
Table 6 below shows the importance that each variable has in the different models. In all cases, quality is found to be the most important factor in determining the coin value, reaching over 90% of the explanatory capacity of the model for coins issued in 1916, 1918, 1923, 1927, 1928 and 1929. However, the order of importance of the rest of the variables differs between the models of different coins. This shows how important it is to model these coins separately as they are shown to be influenced by the quality, silver price, GDP per capita, CPI, Dow Jones price and Dollar-Euro exchange rate differently. This issue may also lead to the fact that, although in general terms the previous literature has considered that numismatic assets could act as a safe haven, it is possible that only some types of coins present this characteristic.
Importance of each variable in the Generalized Regression Neural Network model for each coin by year of minting.
| Coin | Quality | Silver Price | GDP per cápita | CPI | Dow Jones Price | Dollar-Euro Exchange Rate |
|---|---|---|---|---|---|---|
| 1916 | 90.29% | 0.53% | 1.49% | 7.48% | 0.01% | 0.20% |
| 1917 | 50.57% | 7.77% | 10.47% | 10.35% | 10.32% | 10.52% |
| 1918 | 94.20% | 1.26% | 3.07% | 1.36% | 0.10% | 0.02% |
| 1919 | 89.88% | 0.00% | 1.11% | 9.01% | 0.00% | 0.00% |
| 1920 | 53.74% | 9.53% | 11.12% | 9.53% | 11.18% | 3.38% |
| 1921 | 88.72% | 1.81% | 2.58% | 2.19% | 1.98% | 2.73% |
| 1923 | 94.46% | 0.01% | 0.03% | 5.47% | 0.01% | 0.02% |
| 1927 | 93.85% | 3.16% | 0.01% | 2.78% | 0.21% | 0.00% |
| 1928 | 92.91% | 3.74% | 0.03% | 0.14% | 0.17% | 3.03% |
| 1929 | 92.49% | 0.42% | 7.10% | 0.00% | 0.00% | 0.00% |
| 1933 | 82.39% | 0.00% | 10.45% | 0.02% | 7.15% | 0.00% |
| 1934 | 85.43% | 0.21% | 0.3% | 5.69% | 2.24% | 6.09% |
| 1935 | 79.13% | 0.37% | 8.61% | 8.64% | 0.27% | 2.99% |
| 1936 | 67.59% | 0.59% | 17.30% | 14.12% | 0.00% | 0.39% |
| 1937 | 87.16% | 0.11% | 1.17% | 7.95% | 0.35% | 3.27% |
| 1938 | 85.22% | 0.39% | 10.49% | 1.77% | 0.00% | 2.13% |
| 1939 | 82.65% | 0.02% | 11.31% | 1.97% | 0.00% | 4.05% |
| 1940 | 76.01% | 0.00% | 16.43% | 7.56% | 0.00% | 0.00% |
| 1941 | 48.16% | 9.79% | 11.71% | 11.48% | 8.94% | 9.93% |
| 1942 | 82.95% | 0.24% | 10.92% | 5.09% | 0.00% | 0.80% |
| 1943 | 53.47% | 8.53% | 9.33% | 9.33% | 9.37% | 9.97% |
| 1944 | 76.91% | 6.43% | 1.12% | 8.65% | 0.65% | 6.24% |
| 1945 | 81.99% | 1.83% | 2.00% | 2.58% | 5.0% | 6.59% |
| 1946 | 83.23% | 0.09% | 0.22% | 10.21% | 3.54% | 2.71% |
| 1947 | 87.70% | 0.00% | 12.27% | 0.00% | 0.01% | 0.02% |
Different studies have shown the attractiveness of investments in collectors´ items as a way to protect capital in financial instability situations, but they have always been a type of investment that has not generated investor confidence due to a lack of information regarding their performance.
The aim of this study has been to build a model with which to predict the future value of investments in collectors´ items, specifically the numismatic asset Walking Liberty Half Dollar, with the aim of creating greater confidence in investors regarding these assets.
To achieve the proposed objective, Generalized Regression Neural Networks were applied to a sample of 25 coins issued between 1916 and 1947, with different types of qualities, for the valuation period from 2000 to 2019. In this regard, the quality, the year of minting and the coin mintage were considered explanatory variables of the Walking Liberty Half Dollar value, as well as the silver price and the Dow Jones, the GDP per capita, the CPI and the dollar-Euro exchange rate.
Two models were proposed, one for the entire selected sample and the other one for each type of coin depending on its year of minting. Thus, it has been found that the model proposed for the entire sample has a success rate of between 86.12% and 97%, with an explanatory capacity of 40.79%, with the quality of the coin, the year of minting and mintage the most important variables in the model. However, it has been shown how the approach to individual models for each type of coin improves the success rate and explanatory power considerably, finding that the explanatory power of these models is about 88.86% and 98.78%, and that success rates in some coins even reach 100%. Regarding the influence of the different explanatory variables, it has been shown in individual models, that although in all cases the most important variable to explain the value of the Walking Liberty Half Dollar has been quality, the order of importance of the rest of variables has differed between some coins and others. All this shows that not all coins behave the same, so it is important to predict their value to consider each coin individually. In addition, these results question the safe haven nature of all numismatic goods.
Therefore, we can conclude that the proposed model offers the investor a tool that allows them to reliably determine the value of alternative investments in an unstable international economic framework. In this way this finding allows to increase investor confidence by obtaining a higher control and management of this type of investment. The investor will be able to design the investment portfolio that best suits his characteristics, including not only traditional financial investments but also profitable alternative investments.
Based on what was found regarding the weak relationship between the equity price and the value of these collectors´ items, it would be interesting for future studies to delve into the safe haven nature associated with investment in collectors´ items. Furthermore, this issue is particularly significant today in which the Covid-19 crisis has caused outstanding crashes in equity markets around the world.
This research did not receive any specific grant from funding agencies in the public, commercial, or not-for-profit sectors.
Declarations of Competing Interest: none.