One of the most effective solutions to sustain an organization in competitive environments is the strategy of continuous improvement. Consequently, the proposed strategy needs a continuous performance evaluation measurements. A solution to evaluate service quality measurements is to rank the service providers. The ranking procedure in similar complex problems or selection problems can be efficiently implemented with the support of multiple attribute decision making (MADM) methods. This study aims at developing a comprehensive decision support system (DSS) based on multiple MADM methods along with an extended quality of service evaluation model to assess the service quality of certain cultural centers. The suggested service quality measurement model in this study is recognized as a valid and reliable tool based on statistical modeling and validation methods. Moreover, the suggested DSS model has been developed based on integration of target-based F-MULTIMOORA and Fuzzy Axiomatic Design (FAD) methods combined with the best-worst method (BWM). Accordingly, a case study was investigated regarding the assessment of seven art galleries in Tehran, Iran. Ultimately, an extensive managerial investigation of the DSS model has been presented based on the real-world examples to show the practicality of the propositions of the current study.
One of the major challenges in artistic careers, since the middle of the nineteenth century, is for the artists to display their artwork to an audience who could identify and differentiate the artists’ products from the others (Muñiz, Norris, & Fine, 2014). To obtain such results, artists usually work with various patrons. An important factor in the pathway of an artist is to deal with art dealers and managers. The main reason is that these individuals and groups are the channels between the artist and the audience. The subject of clients satisfaction from the perspective of the service industry is now at a critical level of importance (Kuo, Chen, & Cheng, 2016). In the perspective of the cultural centers, customer satisfaction has the same amount of importance as any other service provider. It is important for artists to acquire an understanding of their audience's perception of service quality to select the best place to display their artworks.
The substantial connection between service quality and customer satisfaction has been comprehensively overviewed in different applications throughout the years (Bhatt & Bhanawat, 2016; Cho, Kim, & Kwak, 2016; Yadollahi, Kazemi, & Ranjbarian, 2018). Moreover, based on many in-depth literature reviews that have been conducted in the past few years, it has been shown that the previous research on the service quality is narrow (Yarimoglu, 2014). The reason for this condition is the modality, consumption and evaluation of the service (Parasuraman, Zeithaml, & Berry, 1994; Rezaei, Kothadiya, Tavasszy, & Kroesen, 2018).
Parasuraman, Zeithaml, and Berry (1985) suggested the gap model which contains ten aspects of service quality that have been developed into one of the most common applied measurement models available; the SERVQUAL instrument includes five dimensions of service quality containing tangibles, reliability, responsiveness, assurance, and empathy aspects (Pena, da Silva, Tronchin, & Melleiro, 2013).
The SERVQUAL model is one of the most influential service quality measurement instruments, which is still used in many applications and developments of the service quality fields. Table 1 reveals the aspects of the five-dimensional SERVQUAL model based on the associated literature.
Description of the SERVQUAL dimensions.
| Dimension | Definition of SERVQUAL dimensions |
|---|---|
| Tangibles | The appearance of facilities, equipment and personnel of the service provider |
| Reliability | The ability to provide the assured service as guaranteed correctly and reliably |
| Responsiveness | The willingness to provide guidance to customers along with delivering prompt service |
| Assurance | The acquaintance and courtesy of employees and their ability to motivate trust and confidence |
| Empathy | The delivery of individualized and adjusted care and attention to customers |
Unfortunately, in view of the fact that cultural centers are considered as organizations which provide services, previous literature of such environments shows a narrow and limited area of research (Lagrosen & Lagrosen, 2017; Tkaczynski, 2014). The current study utilized an extended SERVQUAL model covering more aspects of service quality in the esthetic environments to an alternative service quality measurement model called the ARTQUAL model which has been developed by Ijadi Maghsoodi et al. (2019). Similar to banks, restaurants, hotels, and other service providers the quality of service in cultural centers also has a remarkable influence on the consumer satisfaction. Therefore, service quality measurement and assessment of cultural centers can result in optimization and improvement of the presented service quality. Moreover, whenever there is a similar complex problem in terms of selecting the optimal alternative, one of the main solutions is multiple attribute decision-making (MADM). It is clear that in MADM problems, decisions are made based on an assessment of multiple alternatives regarding various criteria. It has been shown that MADM approaches can be converted to an all-inclusive arrangement based on target valued criteria (Ijadi Maghsoodi, Mosavat, Hafezalkotob, & Hafezalkotob, 2019). One of the primary methods for increasing the robustness of the MADM approaches is to combine them with other mathematical models to establish a decision support system (DSS).
In the past few years there have been many developments to the SERVQUAL model considering various applications of the quality measurement model – since the year 1988 – such as SERVPERF (Cronin & Taylor, 1994), Retail Service Quality Scale (RSQS) (Choi, Chow, Shen, & Wan, 2017; Dabholkar, Thorpe, & Rentz, 1996), Social Networking Site Quality (SNSQUAL) (Phillips, Peak, & Prybutok, 2016). Also, many studies have combined the SERVQUAL developments with MADM approaches. Lupo (2013) proposed a fuzzy SERVQUAL based method with the Analytic Hierarchy Process (AHP) technique to measure the service quality in Italian higher education. Akdag, Kalaycı, Karagöz, Zülfikar, and Giz (2014) presented an extensive evaluation of the hospital service quality in turkey applying a hybrid approach based on The Technique for Order of Preference by Similarity to Ideal Solution (TOPSIS) method combined with Yager's min-max approach and Compensatory AND operators. Lupo (2015) suggested a fuzzy SERVPERF model consolidated with ELECTRE III (ELiminiation Et Traduisant la REalite) method to assess the service quality of international airports in Sicily. Rezaei et al. (2018) applied the best-worst method (BWM) along with the SERVQUAL instrument to evaluate service quality of baggage handling systems of multiple international airports worldwide. Still, to the best of authors’ knowledge, there is not a single study that present a DSS based on combination of multiple MADM methods and a service quality measurement of esthetic environments. There are only few studies that investigated the service quality of artistic events and cultural centers (Dorcic, 2015; Tkaczynski, 2014; Tkaczynski & Stokes, 2010). It is also worth mentioning that there is only one research study available that analyzed the relation between esthetic factors and service quality measures (Lagrosen & Lagrosen, 2017), but the proposed approach is not applicable in many service quality measurements of other cultural centers (Ijadi Maghsoodi, Saghaei, & Hafezalkotob, 2019).
As mentioned above, this study used a comprehensive service quality measurement model for cultural centers called the ARTQUAL model. Consequently, the current study proposed a comprehensive service quality measurement model for cultural centers based on the extended SERVQUAL which is called the ARTQUAL model. The principles of the ARTQUAL instrument are identified based on the legitimacy of the literature and the practicality of real-world concepts of quality in esthetic environments which are verified based on the structural equation modeling that also has been overviewed in this study. Furthermore, the originality of the current paper is not limited to the suggestion and application of a quality measurement model, but also, a novel and hybrid DSS approach combining Fuzzy Axiomatic Design (FAD) method and target-based fuzzy Multi-Objective Optimization on the basis of Ratio Analysis plus full MULTIplicative form (F-MULTIMOORA) approach combined with the BWM. None of the previous studies in the service quality and MADM literature have utilized such methodology to present an assessment of any service provider.
In this regard, the current study proposed a DSS based on target-valued MADM approaches to support an optimal assessment of cultural centers. Furthermore, to the best of the authors’ knowledge, not a single research study has measured an assessment of cultural centers of any kind with MADM methods, which makes this research study not only an exhibition of a novel hybrid DSS but also the presentation of a new application considering hybrid MADM techniques. In the current study, after the formulation and validation process of the ARTQUAL service quality measurement model based on the proposed case-study, the criteria of the decision matrix will obtain from the aspects of the ARTQUAL measurement model. Target values are defined by the decision-maker to operate the F-MULTIMOORA method with a target-based normalization technique. Consequently, after defining the system and design ranges, the computation of the FAD will be obtained. Moreover, the calculation of the weights from BWM will determine the significant coefficient of attributes. Ultimately, combining the suggested methods and procedures will result in a novel and hybrid DSS that has been applied in a real-world case-study considering cultural centers (i.e. art galleries) that compared the outcomes of the suggested methods.
The rest of the current research study was prepared as follows. The research methodology as well as a short literature overview of the proposed methods were demonstrated in Section 2. Then, Section 3 presents findings and results on the application of DSS model along with the ARTQUAL service quality measurement applied in a real-world case-study. Ultimately, Section 4 presents conclusions and recommendations for the future studies.
2Research background & methodologyIn MADM problems, the first step of the mathematical computing is to form a decision matrix in regard to multiple alternatives and criteria. In traditional methods, the types of criteria are based on two categories; beneficial and non-beneficial. The target-based valued criteria are also integrated with modern MADM methods. MADM methods with target-based valued criteria have acknowledged exceptional attention in the past recent years (Jahan, Mustapha, Ismail, Sapuan, & Bahraminasab, 2011). The target-based normalization techniques for MADM methods can be used either on a foundation of the distance among alternatives ratings and target values of attributes with normalization methods, or based on the common area of membership functions of alternatives ratings and target values of attributes. The current study has utilized both approaches for target-valued attributes to form a comprehensive DSS model. Few examples of previous developments of target-based MADM methods can be demonstrated as the following. Zeng, Li, and Yang (2013) modified the VIKOR method by proposing a normalization form based on the distance between target values which results in an improved VIKOR method with advanced accuracy for application in healthcare management. Jahan and Edwards (2013) developed the VIKOR method associated with the target-based criteria and considering interval numbers for the application of a material selection problem in biomedical implants. Jahan and Edwards (2015) presented an overview of the application of target-based normalization techniques in decision-making methods to Improve the material selection problems in engineering design. Hafezalkotob, Hami-Dindar, Rabie, and Hafezalkotob (2018a) suggested a decision support system based on the combination of three techniques including target-based WASPAS, target-based MULTIMOORA and BWM in an agricultural machines selection problem.
A target-valued MADM approach can be displayed by a decision matrix X which is obtained based on ratings of multiple alternatives Ai and multiple criteria Cj where i=1, 2, …n and j=1, 2, …m. In which, each criterion has a target value tj. Also, along with the target-values of each criterion, there is availability of the weights and significant confidents of each attribute wj based on the decision-makers perspective. In this study, a Triangular Fuzzy Number (TFN) is established to tackle the uncertainty in the modeling problems (Zadeh, 1965). The fuzzy set theory can be used on these specified problems considering uncertain environments. A TFN is defined if the membership function μa¯x:R→0,1 of the fuzzy set a˜ presents the following core features:
in which, lower value al, modal value a2 and the upper value a3 are the values of support in the fuzzy set a˜. The main structure of a TFN can be represented as a triplet a1,a2,a3 where the defined numbers are crisp values (−∞<a1<a2<a3<+∞) which are converted to fuzzy numbers as mentioned in Eq. (1). To present an integrated illustration of the mathematical formulations, the main structure of a TFN in this study is defined as x˜ij=xij1,xij2,xij3. Consequently, based on the above-mentioned inputs the fuzzy decision matrix X˜, fuzzy target values vector T˜, and the vector of significance coefficients of attributes (weights) W can be presented as the following:a target value can be defined as a set of beneficial I, non-beneficial J, and target-based valued K criteria (Ashkan Hafezalkotob, Hami-Dindar, Rabie, & Hafezalkotob, 2018b). Accordingly, the goal or target value for the criterion j can be assigned by the decision-maker with gj. Consequently, based on these assumptions a fuzzy target-value can be shown as follows:3Best-worst method (BWM)The best-worst method (BWM) is a novel and robust MADM approach, which determines the subjective weights of criteria based on a pairwise comparison of the best and worst attributes or alternatives with other attributes or alternatives, developed by Rezaei (2015). Accordingly, Rezaei (2016) proposed a linear model for BWM which lead to a unique solution. Hafezalkotob and Hafezalkotob (2017) suggested a novel approach for a consolidation of individual and group decisions considering the trade-off between democratic and autocratic decision-making styles based on FBWM. Askarifar, Motaffef, and Aazaami (2018) proposed a combination of the BWM and TOPSIS method in an investment development framework in five ports in Iran to evaluate investment opportunities in the region and to identify the necessary infrastructures to promote the entrepreneurial activities. Yadollahi et al. (2018) presented an application of the BWM in prioritizing the factors of service experience in the bank based on customers’ perception. Ijadi Maghsoodi et al. (2019) applied a hierarchical group BWM method integrated with the FAD approach in a conceptual loudspeaker prototype design selection problem. The pairwise comparison between the best and worst criteria is defined as the reference comparison where the best and worst criteria are calculated. Then, the secondary comparison take place when none of the selected criteria are defined as the best or the worst factor. The fundamental and necessary procedures to achieve the criteria weights utilizing the BWM can be demonstrated as the following steps:
Step 1. A set of criteria consisting of n objects should be determined by the decision maker which affects the decision-making process and can be defined as c1,c2,…,cj,…,cn.
Step 2. The best criterion (most favorable) signified as Cb and the worst criteria (least favorable) denoted as Cw should be measure by the decision-maker.
Step 3. The best criterion Cb should be compared to other criteria based on a preference using a number between 1 and 9. This process will determine the best-to-others vector AB=aB1,aB2,aB3,…,aBn,aB1 demonstrates the comparison and contrast amongst then best criterion and the first criterion.
Step 4. The worst criteria Cw have to be compared to other criteria considering a preference employing a number in the middle of 1 and 9, to obtain the others-to-worst vector AW=aw1,aw2,aw3,…,awn.
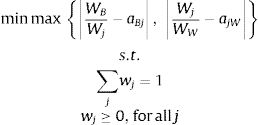
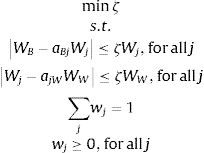
Step 5. The final step is to calculate the weights of criteria based on AB and AW preferences to calculate the weights considering WBWj=aBj and WjWW=ajW for all j. The optimal weights which satisfied the mentioned settings, are calculated by minimizing the maximum absolute differences between WBWj−aBj and WjWW−ajW for all j. Considering these conditions for weights determination, the ideal weights of criteria can be calculated by solving the following nonlinear programming problem:
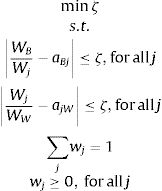
According to Rezaei (2016) the form of Eq. (4) can be transformed into the following nonlinear programming problem:
The suggested nonlinear programming problem of Eq. (5) can also alter into subsequent linear programming model:
Consequently, by solving the linear programming model presented in Eq. (6) the weight of each attribute (criterion) wj is determined as W=w1,w2,…,wj,…,wn.
3.1Target-based F-MULTIMOORA approachBrauers and Zavadskas (2006) developed the Multi-Objective Optimization on the basis of Ratio Analysis (MOORA) technique which has been extended into the MULTIMOORA method adding the full multiplicative form to the MOORA method. The suggested technique by Brauers and Zavadskas (2006) counts as one of the most effective MADM methods available in the MADM literature (Ijadi Maghsoodi, Azizi-ari, et al., 2018; Ijadi Maghsoodi, Ijadi Maghsoodi, Mosavi, Rabczuk, & Zavadskas, 2018) Ijadi Maghsoodi, Abouhamzeh, Khalilzadeh, and Zavadskas (2018). Hafezalkotob, Hafezalkotob, and Sayadi (2016) extended the MULTIMOORA approach with interval-valued numbers to tackle a material selection problem, selecting the most appropriate material for power gears. Deliktas and Ustun (2017) proposed a hybrid approach utilizing a combination of the F-MULTIMOORA and multi-choice conic goal programming to tackle a problem considering choosing the best students and defining the optimum assignments among predefined programs. Ijadi Maghsoodi et al. Ijadi Maghsoodi, Kavian, Khalilzadeh, and Brauers (2018e) proposed a hybrid novel approach tackling the decision-making problems in big data structures by combining K-means clustering method with the MULTIMOORA approach to evaluate a big data supplier selection problem in ICT-sector in Iran. Ijadi Maghsoodi et al. Ijadi Maghsoodi, Abouhamzeh, Khalilzadeh, and Zavadskas (2018) applied the MULTIMOORA method integrated with Shannon's entropy in an organizational performance appraisal method selection problem in Iran.
The first step to utilize the F-MULTIMOORA method is to form the fuzzy decision matrix X˜ which x˜ij=xij1,xij2,xij3 presents the performance index of ith alternative respecting jth attribute i=1, 2, …mandj=1, 2, …n. Nevertheless, the x˜ij values are aggregated by using fuzzy-weighted averaging (FWA) operator which is obtained based on Eq. (8) where Ψ˜k denotes the fuzzy coefficient of significance for the kth decision maker.
To compare performance indices, the calculation parameters of the F-MULTIMOORA technique should be dimensionless. The dimension dominator is performed by comparing appropriate values of fuzzy numbers which are calculated as follows, where x˜ij* shows the normalized performance index of ith alternative respecting jth attribute i=1, 2, …m and j=1, 2, …n.
One of the most important issues in practical applications is the objective of reaching a certain target value of a criterion where the obligation of defining target-based normalization procedures matters the most. The target values T˜j for all attributes based on the TFN structure T˜j=1,2,…n when T˜=T˜1,T˜2,…T˜n are characterized in the target-based decision making process as the input data. Furthermore, the current study has utilized the same norm calculations f˜ij which were used in VIKOR approach (Jahan et al., 2011) and MULTIMOORA method (Hafezalkotob & Hafezalkotob, 2015) instead of the standard fuzzy normalization suggested in Eq. (9). Consequently, the exponential target-based normalization method is employed along with the assessment indices and weights of criteria which have been obtained by the BWM. Eq. (10) measures the deviation of rating values that obtained from the target values based on TFN structure which is measured as an exponential formula to avoid insignificance of the assessment values of the target-based full multiplicative form in the MULTIMOORA approach.
Accordingly, as mentioned before in this study along with the target-based values, objective weights of the criteria wj*=w1*,w2*,…,wn* are calculated by the BWM as described in Eq. (6).
3.1.1The target-based weighted fuzzy ratio system (T-WFRS)The assessment values Y˜iTB of the T-WFRS as the first step of the target-based F-MULTIMOORA approach procedure is calculated in Eq. (11), where wj* is obtained based on BWM, and the optimal alternative considering ratio system AT-WFRS* is an ordinal ranking which has the highest assessment value Y˜iTB, obtained as demonstrated in Eq. (12):
3.1.2The target-based weighted fuzzy reference point approach (T-WFRP)The second part of the F-MULTIMOORA method is based on the deviations of target-based normalized ratings DijTB which can be determined using Eq. (13):
it is worth mentioning that, the greater value of the normalized ratings f˜ij results in a lower deviation DijTB. Nevertheless, the assessment value Z˜iTB of the target-based fuzzy reference point approach is based on the deviations DijTB and the optimal weights wj* computed from BWM, can be obtained as follows:ultimately, the optimal alternative AT-WFRP* of the T-WFRP based on the calculations of the assessment value Z˜iTB is demonstrated in Eq. (15).3.1.3The target-based weighted fuzzy full multiplicative form (T-WFFM)The assessment value of the T-WFFM has only one term of calculation, similar to the T-WFRS. The assessment value U˜iTB in T-WFFM considering the optimal weight wj* calculated from the BWM is determined based on the Eq. (16).
consequently, the optimal alternative AT-WFFM* for the T-WFFM based on the computed assessment value U˜iTB is established as follows:3.1.4The dominance theoryThe dominance theory has been suggested by Brauers and Zavadskas (2010) to rank the subordinate alternatives in the MULTIMOORA method. After the computation of the subordinate ranks, they can be unified into a final ranking, which is the main target of the dominance theory. In the dominance theory, a summary of an arrangement of three parts of the MULTIMOORA approach is completed consisting of cardinal and ordinal scales where rankings directions should be applied including dominated, transitivity and equability (Brauers & Zavadskas, 2012). For a more detailed explanation of the dominance theory, readers can refer to the study of Brauers and Zavadskas (2012).
4The Fuzzy Axiomatic Design (FAD)The theory of axioms is a systematic approach for engineers to overview the complete process of the design phase by utilizing the Axiomatic Design (AD) technique, developed and extended by Suh and Sekimoto (2008, 1990). An AD approach considering fuzzy structure has been suggested by Kulak and Kahraman (2005a), Kulak and Kahraman (2005b) to tackle MADM problems under uncertainty which is entitled Fuzzy Axiomatic Design (FAD) model. Kulak, Durmuşoğlu, and Kahraman (2005) extended the FAD approach by adding significance coefficients of attributes to the FAD model to produce the Weighted Fuzzy Axiomatic Design (WFAD) approach. By adding risk factors to rate the alternatives based on attributes to FAD method, Gören and Kulak (2014) suggested the Risk-Based Fuzzy Axiomatic Design (RFAD) technique which has been employed to identify the best supplier of classic travertine. Guo, Liu, Zhang, and Yang (2017) applied the FAD approach in a green supplier selection and evaluation problem considering apparel production in a sportswear manufacturing in Hong Kong. Oztaysi, Cevik Onar, and Kahraman (2018) applied a hierarchical intuitionistic FAD approach in an evaluation of integrated call center performances. Ijadi Maghsoodi et al. (2018) proposed a weighted risk-based FAD approach based on Shannon's entropy significance coefficients in a technology selection problem considering lubricant oil regenerative technology.
AD principles consist of two axioms; independence axiom which keeps the independence of the functional requirements (FRs) and information axiom which keeps the information content at the minimum level (Ijadi Maghsoodi, Hafezalkotob, Azizi-Ari, Ijadi Maghsoodi, & Hafezalkotob, 2018). However, the optimal design, based on the information axiom, has the lowest value of the information content. Moreover, The success probability of the design consists of two fundamental factors; design range, which is the achievement of the designer's considerations in terms of the expected domain and; system range, which is the capability of system delivery (Kulak, Goren, & Supciller, 2015). Consequently, the overlap of the design and system ranges is called common range, which is the domain of the acceptable design solution (Kulak & Kahraman, 2005a).
In real-world situations and problems, the functional data in decision-making is usually facing the uncertain information rather than precise data. The AD principles cannot intercept these practical matters because there is vagueness and ambiguity of the information, because there is no probability distribution function available. Therefore, uncertain information of the design and system ranges could be presented employing linguistic variables where they could be converted into fuzzy numbers. Consequently, the design and system ranges of the FAD approach based on the TFN structure are described as follows:
where i and j stand for alternatives and criteria, i=1, 2, …, mandj=1, 2, …, n respectively. As illustrated in Fig. 1 Common area cij is the overlap of the system and design ranges based on the TFN input structure. Nevertheless, Eq. (20) presents the calculation method of cij when the membership functions μx of system and design ranges have a similar shape which are considered as TFN structure in this case.The probability pij of satisfying design range d˜j for each alternative i, is specified by considering common area cij and system area x˜ij as following:
the information content Iij in the FAD approach is designated by computing logarithm with base 2 of the reverse of probability pij which is demonstrated in Eq. (22).consequently, the total information content of the FAD method is computed for each alternative as follows:where Ti defines the assessment value of the FAD method. Ultimately, the best alternative in the FAD technique has the minimum assessment value Ti, which is calculated as described in Eq. (24):5The Weighed Fuzzy Axiomatic Design (WFAD)The importance of criteria in real-world decision-making situations often varies. Therefore, to achieve an optimal realistic solution, the relative importance of the criteria should be considered. The weights can be computed using objective, subjective, or integrated techniques (Ijadi Maghsoodi, Mosavat, et al., 2019). Subjective weights are obtained from expert opinions while objective weights are calculated through employing the values of decision matrix without utilizing the judgments of experts. Accordingly, for adding weights to the FAD approach, the information content of the WFAD approach Iijw* combined with BWM obtains as the following:
the total information content Tiw* and the optimal alternative AWFAD* based on the WFAD approach integrated with BWM is calculated as:Ultimately, Fig. 2 summarizes the main procedure of the proposed DSS approach.
6Finding and results6.1The ARTQUAL measureThe case-study analyzed in the current study was originally assembled in the research study of Ijadi Maghsoodi et al. (2019b), in which the ARTQUAL model was generated. This study was conducted in 2017 amongst multiple art galleries based on various esthetic genres to collect the main data in Tehran, Iran. The sample included customers and audiences of seven art galleries all located in different areas of Tehran. Given that the success of a cultural center of any kind is considered from the viewpoint of the audience, the study population contains art enthusiasts. Accordingly, the suggested art galleries in this investigation were not selected aimlessly. It was planned and targeted to select a number of particular art galleries based on their reputation including well-known centers along with independent and less-known centers to be able to achieve a better acquaintance of the service quality in different conditions. For more information about the other case-studies related to the ARTQUAL model readers can refer to Ijadi Maghsoodi et al. (2019).
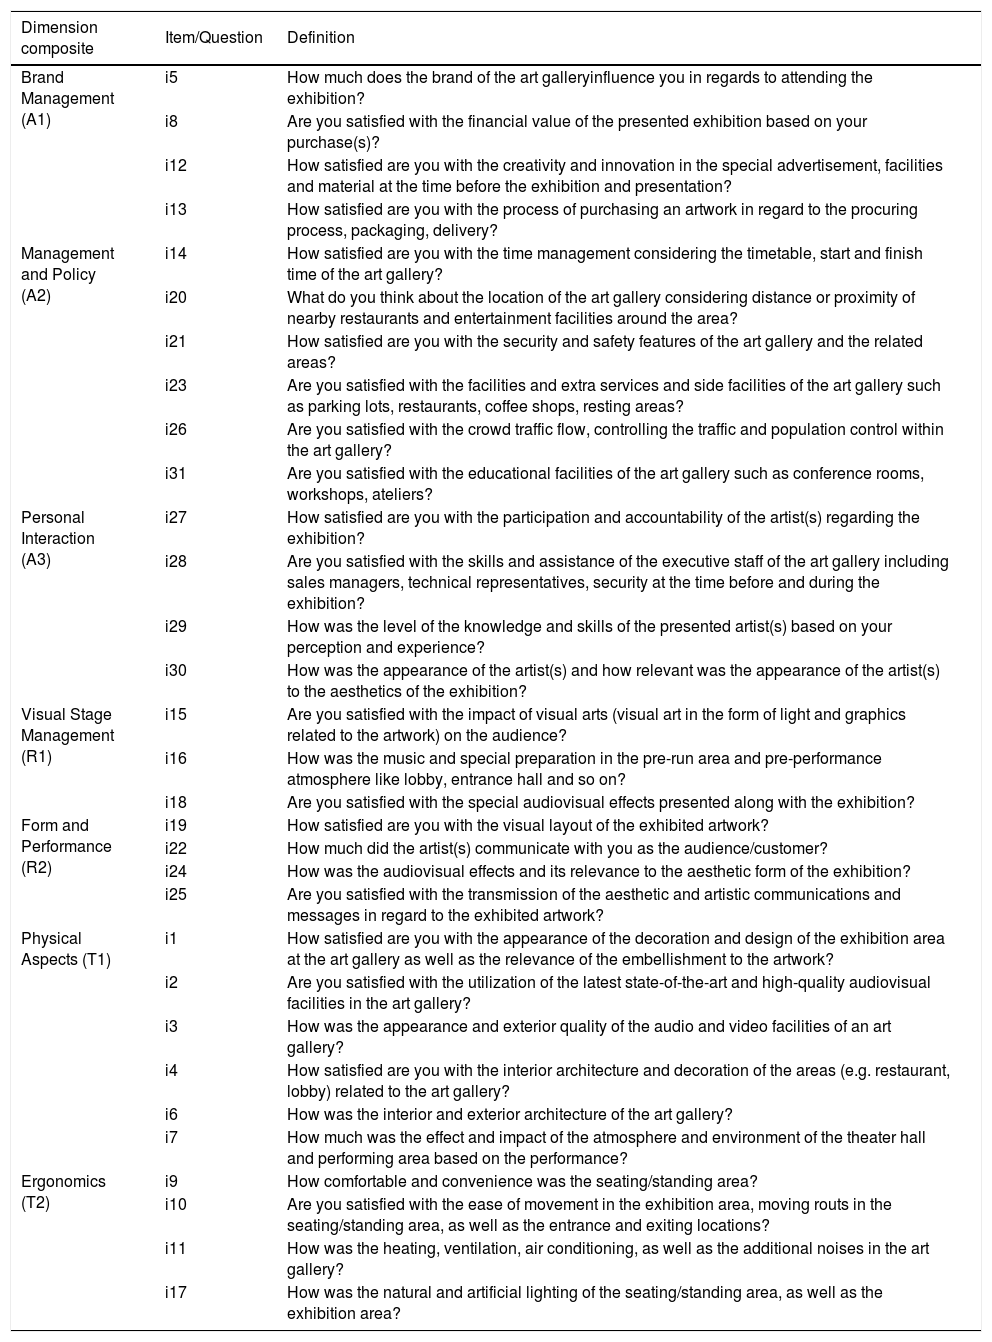
Similar to other service quality studies the essential data has been collected by using a quantitative survey in the form of a questionnaire. Appendix I presents the questionnaire which has been used in this study to measure the service quality (Ijadi Maghsoodi, Saghaei, et al., 2019). The respondents were approached and intercepted after each event took place near the associated cultural center by distributing the questionnaires within each center's premises as it was not allowed by almost any of the art galleries to associate with any kinds of third-party independent service quality evaluations.
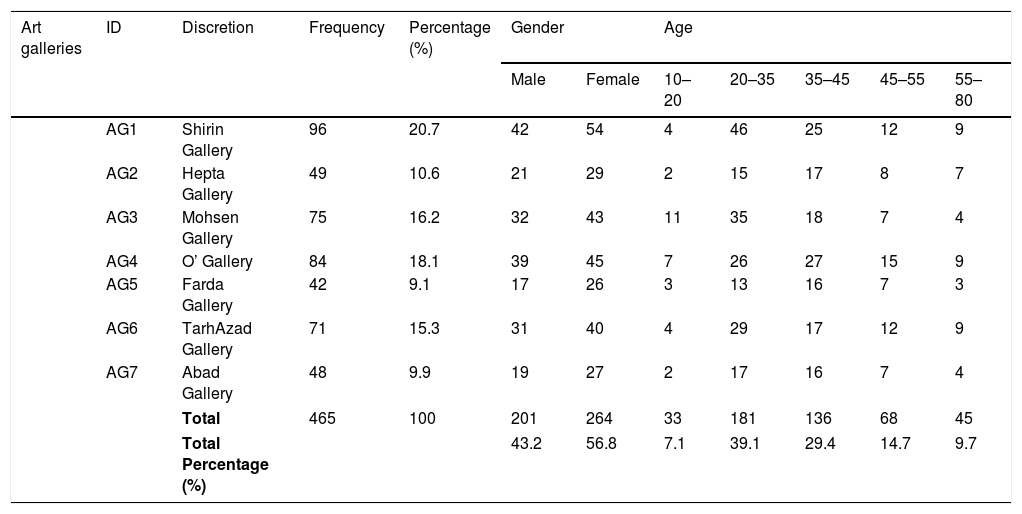
The questionnaires were equally distributed (120 questionnaires for each unit) across all art galleries. Out of the 840 questionnaires distributed out including seven art galleries, 465 forms were received back. The non-response rate is 55.35 percent. Incomplete responses have been counted as no response due to the unusable data. The measuring scale of the self-administrated questionnaire is organized on a five-point linguistic scale, ranging from A=much less than expected to E=much more than expected (C=as expected). Nevertheless, Table 2 shows the statistical population and features of the respondents in the surveyed art galleries.
Characteristics of the respondents in the art galleries.
| Art galleries | ID | Discretion | Frequency | Percentage (%) | Gender | Age | |||||
|---|---|---|---|---|---|---|---|---|---|---|---|
| Male | Female | 10–20 | 20–35 | 35–45 | 45–55 | 55–80 | |||||
| AG1 | Shirin Gallery | 96 | 20.7 | 42 | 54 | 4 | 46 | 25 | 12 | 9 | |
| AG2 | Hepta Gallery | 49 | 10.6 | 21 | 29 | 2 | 15 | 17 | 8 | 7 | |
| AG3 | Mohsen Gallery | 75 | 16.2 | 32 | 43 | 11 | 35 | 18 | 7 | 4 | |
| AG4 | O’ Gallery | 84 | 18.1 | 39 | 45 | 7 | 26 | 27 | 15 | 9 | |
| AG5 | Farda Gallery | 42 | 9.1 | 17 | 26 | 3 | 13 | 16 | 7 | 3 | |
| AG6 | TarhAzad Gallery | 71 | 15.3 | 31 | 40 | 4 | 29 | 17 | 12 | 9 | |
| AG7 | Abad Gallery | 48 | 9.9 | 19 | 27 | 2 | 17 | 16 | 7 | 4 | |
| Total | 465 | 100 | 201 | 264 | 33 | 181 | 136 | 68 | 45 | ||
| Total Percentage (%) | 43.2 | 56.8 | 7.1 | 39.1 | 29.4 | 14.7 | 9.7 | ||||
Being a young multicultural country, it is important to mention that the observation and understanding of art is very diverse in such population. Table 2 shows that most of the audience consists mostly of female respondents the majority of whom fell between the age groups of 20–35 (39.1%) and 35–45 (29.4%). The fact that most of the respondents were in between the ages of 20–35, is not surprising due to the nature of exhibitions presented in the proposed art galleries, because the target-domain of artists are young people. The ARTQUAL service quality measurement model has been developed by Ijadi Maghsoodi et al. (2019), influenced mainly by the SERVQUAL (Parasuraman, Zeithaml, & Berry, 1988; Parasuraman, Zeithaml, & Malhotra, 2005) and SERVPERF (Cronin & Taylor, 1994) instruments along with FESTPERF (Tkaczynski & Stokes, 2010) and few other measurement models (Dabholkar et al., 1996; Lagrosen & Lagrosen, 2017). There are altogether seven aspects considering 31 items/questions in the ARTQUAL measurement for art galleries (Ijadi Maghsoodi, Saghaei, et al., 2019). In the current study exploratory factor analysis (EFA) along with reliability tests using IBM SPSS 22 were utilized to show the formulation of the ARTQUAL model along with the initial tests of the reliability factors. Nevertheless, to validate the ARTQUAL approach the confirmatory factor analysis (CFA) based on a partial disaggregation technique has been examined by IBM SPSS AMOS 22.
It is important to mention that, the traditional structural equation modeling (SEM) method engages total disaggregation method, wherein the ARTQUAL model the partial disaggregation method was utilized as an alternative (Ijadi Maghsoodi, Saghaei, et al., 2019). The partial disaggregation method permits the investigator to progress with meaningful research by consolidating items into composites and fusions based on hierarchical factor structures (Dabholkar et al., 1996; Leen & Ramayah, 2011). Subsequently, to apply and operationalize the partial disaggregation technique, items that relate to an implicit dimension were consolidated based on experts interpretations to generate meaningful composite indicators for each construct instead of several single-item indicators.
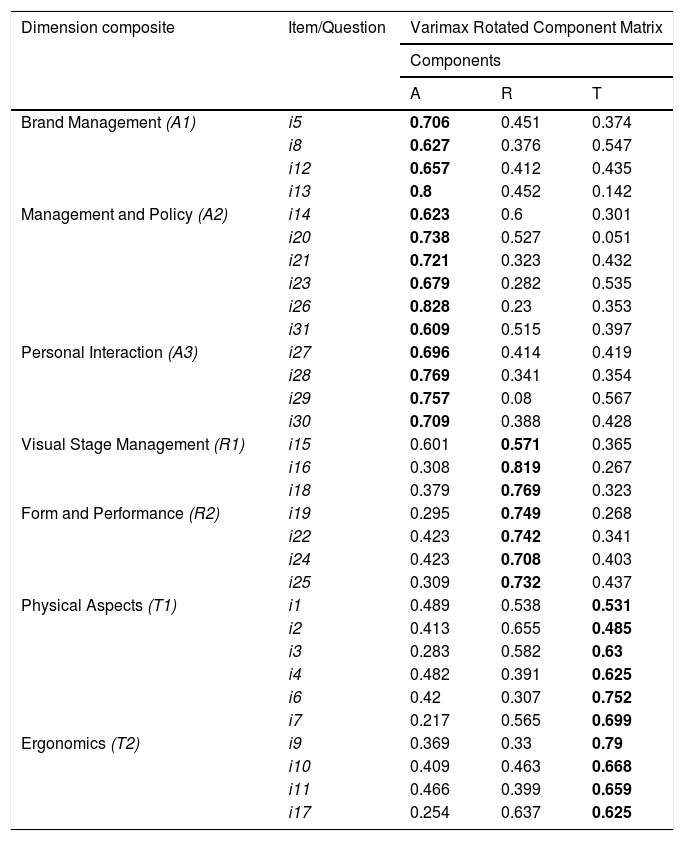
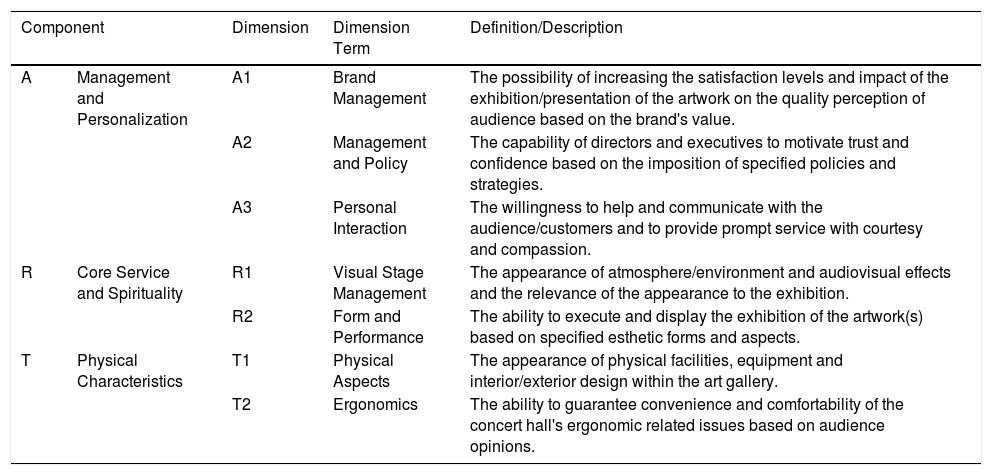
The extraction method for the EFA was principal component analysis (PCA) along with Varimax rotation technique, in which factors with eigenvalues greater than 1 were retained. None of the variables were eliminated since they were not double loaded onto different factors or had less than 0.4 factor loadings (Leen & Ramayah, 2011; Paker & Vural, 2016). Furthermore, Kaisere-Meyere-Olkin (KMO) measure of sampling adequacy was computed as 0.96 and Bartlett's test of sphericity was significant at 0.000 level. Table 3 demonstrates the outcomes of the EFA based on ARTQUAL measurement model, that shows three components extracted from the EFA method which assigned to seven composites. Subsequently, an extensive explanation of the final composites of the ARTQUAL dimensions in art galleries has been demonstrated in Table 4.
Exploratory Factor Analysis (EFA) for the ARTQUAL model items.
| Dimension composite | Item/Question | Varimax Rotated Component Matrix | ||
|---|---|---|---|---|
| Components | ||||
| A | R | T | ||
| Brand Management (A1) | i5 | 0.706 | 0.451 | 0.374 |
| i8 | 0.627 | 0.376 | 0.547 | |
| i12 | 0.657 | 0.412 | 0.435 | |
| i13 | 0.8 | 0.452 | 0.142 | |
| Management and Policy (A2) | i14 | 0.623 | 0.6 | 0.301 |
| i20 | 0.738 | 0.527 | 0.051 | |
| i21 | 0.721 | 0.323 | 0.432 | |
| i23 | 0.679 | 0.282 | 0.535 | |
| i26 | 0.828 | 0.23 | 0.353 | |
| i31 | 0.609 | 0.515 | 0.397 | |
| Personal Interaction (A3) | i27 | 0.696 | 0.414 | 0.419 |
| i28 | 0.769 | 0.341 | 0.354 | |
| i29 | 0.757 | 0.08 | 0.567 | |
| i30 | 0.709 | 0.388 | 0.428 | |
| Visual Stage Management (R1) | i15 | 0.601 | 0.571 | 0.365 |
| i16 | 0.308 | 0.819 | 0.267 | |
| i18 | 0.379 | 0.769 | 0.323 | |
| Form and Performance (R2) | i19 | 0.295 | 0.749 | 0.268 |
| i22 | 0.423 | 0.742 | 0.341 | |
| i24 | 0.423 | 0.708 | 0.403 | |
| i25 | 0.309 | 0.732 | 0.437 | |
| Physical Aspects (T1) | i1 | 0.489 | 0.538 | 0.531 |
| i2 | 0.413 | 0.655 | 0.485 | |
| i3 | 0.283 | 0.582 | 0.63 | |
| i4 | 0.482 | 0.391 | 0.625 | |
| i6 | 0.42 | 0.307 | 0.752 | |
| i7 | 0.217 | 0.565 | 0.699 | |
| Ergonomics (T2) | i9 | 0.369 | 0.33 | 0.79 |
| i10 | 0.409 | 0.463 | 0.668 | |
| i11 | 0.466 | 0.399 | 0.659 | |
| i17 | 0.254 | 0.637 | 0.625 | |
Dimensions of the ARTQUAL service quality measurement model for evaluation of art galleries.
| Component | Dimension | Dimension Term | Definition/Description | |
|---|---|---|---|---|
| A | Management and Personalization | A1 | Brand Management | The possibility of increasing the satisfaction levels and impact of the exhibition/presentation of the artwork on the quality perception of audience based on the brand's value. |
| A2 | Management and Policy | The capability of directors and executives to motivate trust and confidence based on the imposition of specified policies and strategies. | ||
| A3 | Personal Interaction | The willingness to help and communicate with the audience/customers and to provide prompt service with courtesy and compassion. | ||
| R | Core Service and Spirituality | R1 | Visual Stage Management | The appearance of atmosphere/environment and audiovisual effects and the relevance of the appearance to the exhibition. |
| R2 | Form and Performance | The ability to execute and display the exhibition of the artwork(s) based on specified esthetic forms and aspects. | ||
| T | Physical Characteristics | T1 | Physical Aspects | The appearance of physical facilities, equipment and interior/exterior design within the art gallery. |
| T2 | Ergonomics | The ability to guarantee convenience and comfortability of the concert hall's ergonomic related issues based on audience opinions. | ||
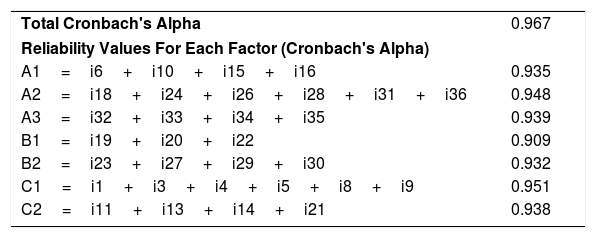
The reliability test of the ARTQUAL model has been presented in Table 5 where the alpha values are not only acceptable but the consistency and reliability of the model is excellent regarding the acceptable value of Cronbach's alpha fixed on at/above the 0.70 thresholds.
Reliability test for the ARTQUAL model.
| Total Cronbach's Alpha | 0.967 |
| Reliability Values For Each Factor (Cronbach's Alpha) | |
| A1=i6+i10+i15+i16 | 0.935 |
| A2=i18+i24+i26+i28+i31+i36 | 0.948 |
| A3=i32+i33+i34+i35 | 0.939 |
| B1=i19+i20+i22 | 0.909 |
| B2=i23+i27+i29+i30 | 0.932 |
| C1=i1+i3+i4+i5+i8+i9 | 0.951 |
| C2=i11+i13+i14+i21 | 0.938 |
Content validity is defined as a specific degree in which an instrument/model covers the fundamental theories and meanings of the concepts contained within a certain research area. In the current study, the content validity of the ARTQUAL measurement model is satisfactory and adequate enough because the instrument has been carefully constructed and formulated based on the EFA (Ijadi Maghsoodi, Saghaei, et al., 2019). The technique that evaluates and questions the degree to which a set of items/indicators are able to signify a specified dimension is called convergent validity. Table 6 shows the outcomes of the convergent validity indicators using the partial disaggregation technique based on the CB-SEM method. The factor loadings for all composites – which is also demonstrated in Fig. 3 - were above the minimum value of 0.50 (Hair, 2009; Leen & Ramayah, 2011). Also, it is obvious that in Table 6 the composite reliability (CR) value surpasses the recommended value of 0.70 (Hair, 2009). The Average Variance Extracted (AVE) minimum value is 0.5. In which the obtained values are presented with satisfactory measures.
Convergent validity of the ARTQUAL model.
| Factors | Composite Reliability (CR) | Average Variance Extracted (AVE) | Dimensions | Factor Loadings | Standard Error (S.E.) | Critical Ratio (C.R.) | P-Value (***p<0.001) |
|---|---|---|---|---|---|---|---|
| A | 0.77 | 0.63 | A1 | 0.867 | – | – | – |
| A2 | 0.789 | 0.081 | 10.663 | *** | |||
| A3 | 0.732 | 0.079 | 10.042 | *** | |||
| R | 0.80 | 0.73 | R1 | 0.928 | – | – | – |
| R2 | 0.765 | 0.146 | 5.769 | *** | |||
| T | 0.74 | 0.67 | T1 | 0.668 | – | – | – |
| T2 | 0.951 | 0.193 | 7.586 | *** |
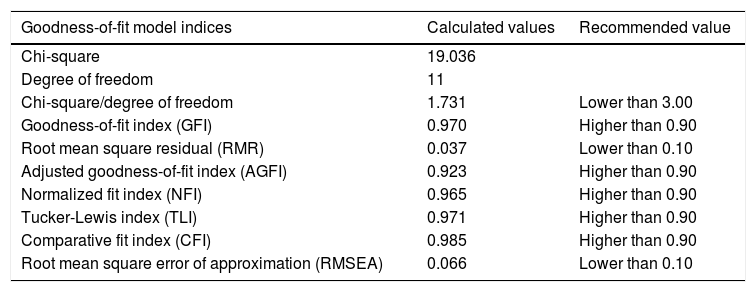
It is important to mention that due to the specified scales of the latent variables (lack of scale) in the calculation of the CB-SEM measurements, one of the variables must be defined as the fixed variable. That is the reason why the values of standard error, critical ratio, and p-value of the first variables in each factor are empty in the Table 6. Subsequently, to check the model compliance with the assumptions of the model the goodness-of-fit indices have been employed. As a result of the goodness of fit test demonstrated in Table 7, all the values were deemed valid as a study model of the ARTQUAL measurement tool. Therefore, the ARTQUAL model is acknowledged as an appropriate model for the sample data.
Fit indices for the ARTQUAL model.
| Goodness-of-fit model indices | Calculated values | Recommended value |
|---|---|---|
| Chi-square | 19.036 | |
| Degree of freedom | 11 | |
| Chi-square/degree of freedom | 1.731 | Lower than 3.00 |
| Goodness-of-fit index (GFI) | 0.970 | Higher than 0.90 |
| Root mean square residual (RMR) | 0.037 | Lower than 0.10 |
| Adjusted goodness-of-fit index (AGFI) | 0.923 | Higher than 0.90 |
| Normalized fit index (NFI) | 0.965 | Higher than 0.90 |
| Tucker-Lewis index (TLI) | 0.971 | Higher than 0.90 |
| Comparative fit index (CFI) | 0.985 | Higher than 0.90 |
| Root mean square error of approximation (RMSEA) | 0.066 | Lower than 0.10 |
Ultimately, based on the analyzed statistical validation process, the ARTQUAL model has shown that it is a valid and accurate service quality measurement model. Therefore, the ARTQUAL model can be utilized to gather the preliminary data for the DSS offered in the current study. For more information about the ARTQUAL measurement model and more detailed data on the model validation and formulation in other scenarios readers can refer to the study of Ijadi Maghsoodi, Saghaei, et al. (2019).
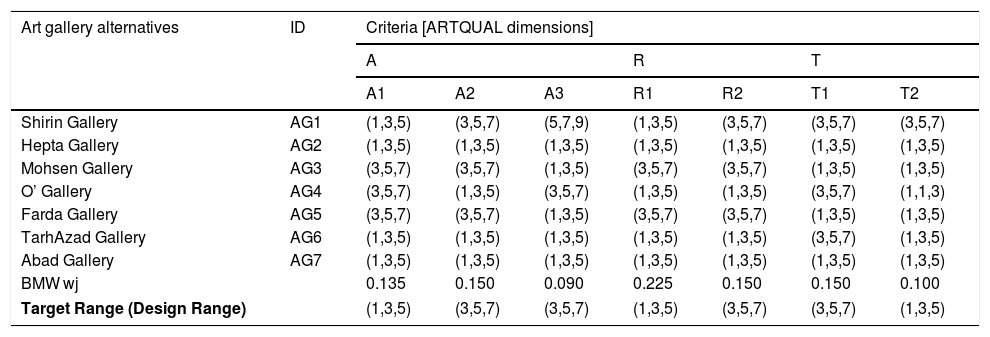
6.2Assessment of cultural centers using the proposed DSSThe main data for establishing the decision matrix to proceed with the DSS has been gathered from the ARTQUAL measurement model. A set of criteria for the ranking procedure has been identified based on the aspects of the ARTQUAL model that have been described in Table 4. Accordingly, the alternatives of the study have been collected and classified based on the art galleries that have been analyzed based the ARTQUAL approach including seven art galleries exhibiting various genres of artwork from various artists in Tehran, Iran. Furthermore, the essential data of the decision matrix has been gathered based on the correspondent characteristics presented in Table 2 and the questionnaire of the ARTQUAL method of Appendix I. The ultimate purpose of the ARTQUAL model was to complete the decision matrix shown in Table 9 based on the linguistic definitions, the equivalent numbers, and the mentioned TFN structure which were presented in Table 8. It is also important to note that, the verbal comments which have been defied the in ARTQUAL quastionnaire are based on the equivalent numbers of Table 8.
Linguistic terms and the corresponding numbers based on the TFN.
| Linguistic term | Alphabetical definitions of verbal comments | TFN definitions of verbal comments |
|---|---|---|
| Much Less Than Expected | A | (1,1,3) |
| Less Than Expected | B | (1,3,5) |
| As Expected | C | (3,5,7) |
| More Than Expected | D | (5,7,9) |
| Much More Than Expected | E | (7,9,9) |
As displayed in Fig. 3 it is obvious that the ARTQUAL model is based on a hierarchical structure (Table 9). Therefore the BWM, utilized in this study to calculate weights of criteria, is presented based on a hierarchical structure developed by Ijadi Maghsoodi et al. (2019). Which means each criterion multiplies by related sub-criterion to calculate the final weights. The final weights, calculated from BWM, have been demonstrated in Table 10.
Decision matrix for ranking the art galleries.
| Art gallery alternatives | ID | Criteria [ARTQUAL dimensions] | ||||||
|---|---|---|---|---|---|---|---|---|
| A | R | T | ||||||
| A1 | A2 | A3 | R1 | R2 | T1 | T2 | ||
| Shirin Gallery | AG1 | (1,3,5) | (3,5,7) | (5,7,9) | (1,3,5) | (3,5,7) | (3,5,7) | (3,5,7) |
| Hepta Gallery | AG2 | (1,3,5) | (1,3,5) | (1,3,5) | (1,3,5) | (1,3,5) | (1,3,5) | (1,3,5) |
| Mohsen Gallery | AG3 | (3,5,7) | (3,5,7) | (1,3,5) | (3,5,7) | (3,5,7) | (1,3,5) | (1,3,5) |
| O’ Gallery | AG4 | (3,5,7) | (1,3,5) | (3,5,7) | (1,3,5) | (1,3,5) | (3,5,7) | (1,1,3) |
| Farda Gallery | AG5 | (3,5,7) | (3,5,7) | (1,3,5) | (3,5,7) | (3,5,7) | (1,3,5) | (1,3,5) |
| TarhAzad Gallery | AG6 | (1,3,5) | (1,3,5) | (1,3,5) | (1,3,5) | (1,3,5) | (3,5,7) | (1,3,5) |
| Abad Gallery | AG7 | (1,3,5) | (1,3,5) | (1,3,5) | (1,3,5) | (1,3,5) | (1,3,5) | (1,3,5) |
Based on the calculated weights of the criteria, the design ranges and target-values of the attributes values are defined from the expert comments, the final decision matrix of the current problem has been presented in Table 11. It is important to mention that, based on the theoretical nature of the design range and target-values definitions in the current study, these two values can be defined as similar values. The reason is target-values (for utilizing the norm calculations) and the design range (to calculate the common range in the FAD method) are both defined by the expert and it came to our awareness that almost always these values are defined with identical principles. Therefore in order to visualize the mentioned value from this point forward both target-values and design range have been defined as the target-range.
The final decision matrix for ranking the art galleries including weights of criteria and target ranges.
| Art gallery alternatives | ID | Criteria [ARTQUAL dimensions] | ||||||
|---|---|---|---|---|---|---|---|---|
| A | R | T | ||||||
| A1 | A2 | A3 | R1 | R2 | T1 | T2 | ||
| Shirin Gallery | AG1 | (1,3,5) | (3,5,7) | (5,7,9) | (1,3,5) | (3,5,7) | (3,5,7) | (3,5,7) |
| Hepta Gallery | AG2 | (1,3,5) | (1,3,5) | (1,3,5) | (1,3,5) | (1,3,5) | (1,3,5) | (1,3,5) |
| Mohsen Gallery | AG3 | (3,5,7) | (3,5,7) | (1,3,5) | (3,5,7) | (3,5,7) | (1,3,5) | (1,3,5) |
| O’ Gallery | AG4 | (3,5,7) | (1,3,5) | (3,5,7) | (1,3,5) | (1,3,5) | (3,5,7) | (1,1,3) |
| Farda Gallery | AG5 | (3,5,7) | (3,5,7) | (1,3,5) | (3,5,7) | (3,5,7) | (1,3,5) | (1,3,5) |
| TarhAzad Gallery | AG6 | (1,3,5) | (1,3,5) | (1,3,5) | (1,3,5) | (1,3,5) | (3,5,7) | (1,3,5) |
| Abad Gallery | AG7 | (1,3,5) | (1,3,5) | (1,3,5) | (1,3,5) | (1,3,5) | (1,3,5) | (1,3,5) |
| BMW wj | 0.135 | 0.150 | 0.090 | 0.225 | 0.150 | 0.150 | 0.100 | |
| Target Range (Design Range) | (1,3,5) | (3,5,7) | (3,5,7) | (1,3,5) | (3,5,7) | (3,5,7) | (1,3,5) | |
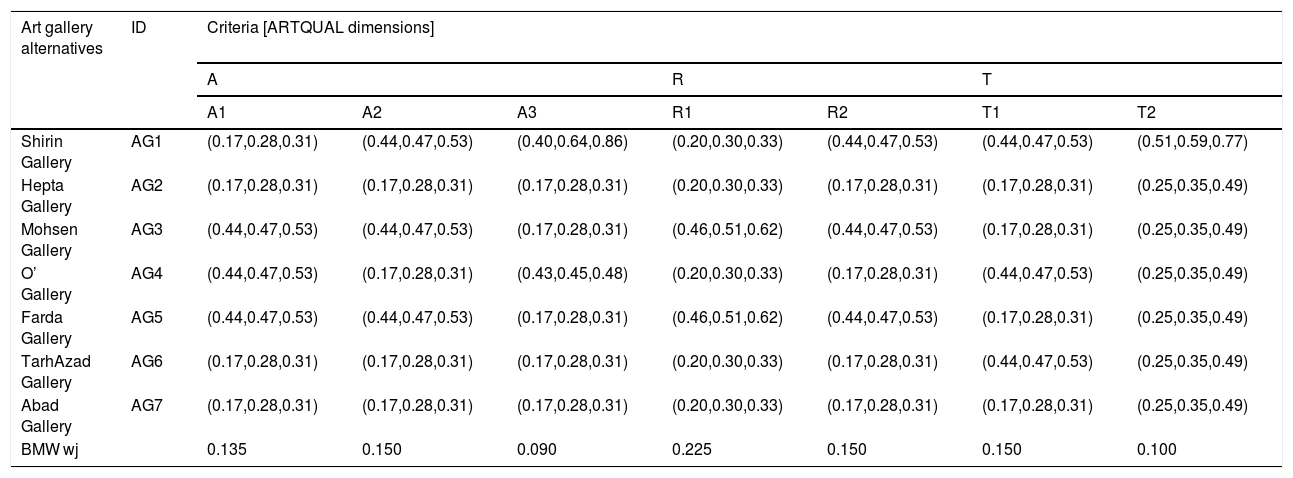
Based on the exponential target-based normalization presented in Eq. (10) and target ranges of the attributes, the normalized decision matrix for the target-based F-MULTIMOORA method has been presented in Table 12.
The normalized fuzzy decision matrix based on the target-based attributes.
| Art gallery alternatives | ID | Criteria [ARTQUAL dimensions] | ||||||
|---|---|---|---|---|---|---|---|---|
| A | R | T | ||||||
| A1 | A2 | A3 | R1 | R2 | T1 | T2 | ||
| Shirin Gallery | AG1 | (0.17,0.28,0.31) | (0.44,0.47,0.53) | (0.40,0.64,0.86) | (0.20,0.30,0.33) | (0.44,0.47,0.53) | (0.44,0.47,0.53) | (0.51,0.59,0.77) |
| Hepta Gallery | AG2 | (0.17,0.28,0.31) | (0.17,0.28,0.31) | (0.17,0.28,0.31) | (0.20,0.30,0.33) | (0.17,0.28,0.31) | (0.17,0.28,0.31) | (0.25,0.35,0.49) |
| Mohsen Gallery | AG3 | (0.44,0.47,0.53) | (0.44,0.47,0.53) | (0.17,0.28,0.31) | (0.46,0.51,0.62) | (0.44,0.47,0.53) | (0.17,0.28,0.31) | (0.25,0.35,0.49) |
| O’ Gallery | AG4 | (0.44,0.47,0.53) | (0.17,0.28,0.31) | (0.43,0.45,0.48) | (0.20,0.30,0.33) | (0.17,0.28,0.31) | (0.44,0.47,0.53) | (0.25,0.35,0.49) |
| Farda Gallery | AG5 | (0.44,0.47,0.53) | (0.44,0.47,0.53) | (0.17,0.28,0.31) | (0.46,0.51,0.62) | (0.44,0.47,0.53) | (0.17,0.28,0.31) | (0.25,0.35,0.49) |
| TarhAzad Gallery | AG6 | (0.17,0.28,0.31) | (0.17,0.28,0.31) | (0.17,0.28,0.31) | (0.20,0.30,0.33) | (0.17,0.28,0.31) | (0.44,0.47,0.53) | (0.25,0.35,0.49) |
| Abad Gallery | AG7 | (0.17,0.28,0.31) | (0.17,0.28,0.31) | (0.17,0.28,0.31) | (0.20,0.30,0.33) | (0.17,0.28,0.31) | (0.17,0.28,0.31) | (0.25,0.35,0.49) |
| BMW wj | 0.135 | 0.150 | 0.090 | 0.225 | 0.150 | 0.150 | 0.100 | |
Utilizing weights of each criterion along with the target-based fuzzy normalized matrix the assessment values of the target-valued F-MULTIMOORA method can be calculated. Accordingly, the assessment values of the target-based F-MULTIMOORA approach have been demonstrated in Table 13. Also, the final assortment of the ranking problem based on the target-based F-MULTIMOORA method has been demonstrated in Table 14.
The assessment values of the TB-FMULTIMOORA integrated with BWM.
| Art gallery alternatives | F-MULTIMOORA integrated with BWM | ||
|---|---|---|---|
| T-WFRS Y˜iTB | T-WFRP Z˜iTB | T-WFFM U˜iTB | |
| AG1 | (0.037, 0.076, 0.094) | (0.007, 0.019, 0.037) | (0.983, 1.001, 1.027) |
| AG2 | (0.022, 0.034, 0.055) | (0.005, 0.016, 0.032) | (0.678, 0.897, 0.954) |
| AG3 | (0.012, 0.026, 0.043) | (0.013, 0.025, 0.043) | (0.693, 0.882, 0.937) |
| AG4 | (0.005, 0.013, 0.029) | (0.009, 0.024, 0.031) | (0.714, 0.843, 0.896) |
| AG5 | (0.012, 0.026, 0.043) | (0.013, 0.025, 0.043) | (0.693, 0.882, 0.937) |
| AG6 | (0.029, 0.050, 0.086) | (0.005, 0.016, 0.032) | (0.726, 0.937, 0.986) |
| AG7 | (0.022, 0.034, 0.055) | (0.005, 0.016, 0.032) | (0.678, 0.897, 0.954) |
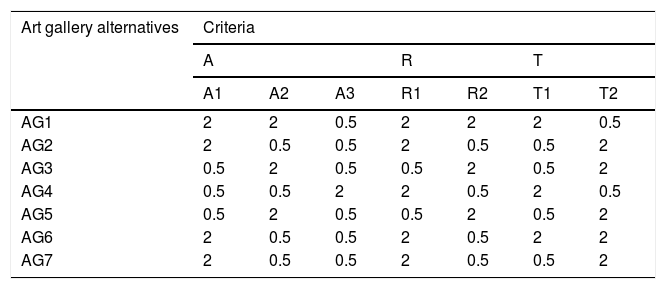
Subsequently, to continue with the DSS procedure, system and design ranges in the form of TFN had been presented in the fuzzy decision matrix in Table 11 along with the weights of the criteria based on the BWM weights. System area signifies the area under the membership function of the system range, which is the triangular area. The common area is calculated utilizing Eq. (20). Nevertheless, the common areas that have been calculated are reported in Table 15.
Common areas calculated for the art gallery assortment problem.
| Art gallery alternatives | Criteria | ||||||
|---|---|---|---|---|---|---|---|
| A | R | T | |||||
| A1 | A2 | A3 | R1 | R2 | T1 | T2 | |
| AG1 | 2 | 2 | 0.5 | 2 | 2 | 2 | 0.5 |
| AG2 | 2 | 0.5 | 0.5 | 2 | 0.5 | 0.5 | 2 |
| AG3 | 0.5 | 2 | 0.5 | 0.5 | 2 | 0.5 | 2 |
| AG4 | 0.5 | 0.5 | 2 | 2 | 0.5 | 2 | 0.5 |
| AG5 | 0.5 | 2 | 0.5 | 0.5 | 2 | 0.5 | 2 |
| AG6 | 2 | 0.5 | 0.5 | 2 | 0.5 | 2 | 2 |
| AG7 | 2 | 0.5 | 0.5 | 2 | 0.5 | 0.5 | 2 |
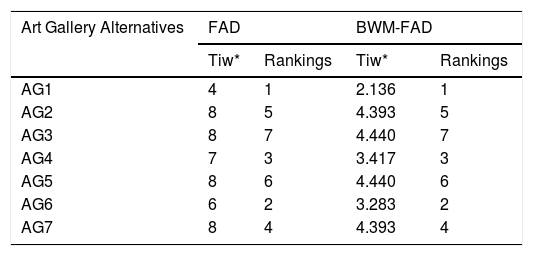
Consequently, as mentioned in the previous sections, the information content Iij for the ranking problem is calculated using Eq. (25). The information content of the FAD method is considered as the assessment value of the proposed approach. The summation of the information contents Tiw* shows the result of the final rankings by selecting the minimum values as demonstrated in Eq. (27). Ultimately, the total information contents and the final rankings of the FAD and WFAD approaches have been presented in Table 16.
Consequently, to finalize the rankings of the proposed problem based on the DSS the final rank is obtained utilizing the dominance theory among the final results of the FAD and target-based F-MULTIMOORA methods which have been demonstrated integrating rankings in each method presented in Table 17.
Subordinate and final rankings of the proposed DSS.
| Art gallery alternatives | BWM-TB-FMULTIMOORA | FAD | BWM-FAD | Final rank [Dominance theory] |
|---|---|---|---|---|
| Shirin Gallery | 1 | 1 | 1 | 1 |
| Hepta Gallery | 3 | 5 | 5 | 5 |
| Mohsen Gallery | 5 | 7 | 7 | 7 |
| O’ Gallery | 7 | 3 | 3 | 3 |
| Farda Gallery | 6 | 6 | 6 | 6 |
| TarhAzad Gallery | 2 | 2 | 2 | 2 |
| Abad Gallery | 4 | 4 | 4 | 4 |
The values of the subordinate ranks of the proposed DSS model showed that the suggested method applied in this study is a valid approach for such complex assessment problems. Ultimately, findings and results of this study showed that this approach is an accurate and practical tool to aid the decision-making problems.
6.3Managerial insightsAlthough this study has accomplished its specified research goals, some limitations still exists. Due to the nature of cultural preferences the definition of quality involving esthetics is very diverse based on many factors such as age, sex, culture. Accordingly, the results of the concluding analysis based on the ARTQUAL instrument may vary due to the mentioned settings in different countries or even various setups considering personal attributes of the audience in cultural centers. Therefore, the input data of the current study could undergo a change in different cultural environments. Furthermore, analysis of the finding of the suggested approaches in the current study, showed a detailed demonstration of strengths and weaknesses to acquire opportunities for improvement. Moreover, in order to review the service quality performance based on the ARTQUAL measurement tool this study has used the radar chart for graphical presentations. The foundation of a radar chart consists of an order of equiangular spokes, each spoke signifies aspects of the ARTQUAL model based on specified settings considering cultural centers. The data length of each spoke is relative to the five-point linguistic scale across all aspects where a line is drawn connecting the data values for each spoke. Nevertheless, due to the copyright policies of revealing artists strategies without their permission, the current study does not mention the names of the artists that presented and exhibited their artworks in the related art galleries. Subsequently, seven art galleries including a various range of visual and esthetic forms and artworks have been presented by various artists which have been analyzed based on seven aspects of the ARTQUAL model. Fig. 4 illustrates the radar plot of the results from the ARTQUAL examination in view of seven art galleries in Tehran, Iran.
Fig. 4 demonstrates that the form and performance aspect analyzed by the ARTQUAL measurement model shows the most satisfaction based on audience perception. Due to the nature of art galleries and presenting a form of the exhibition along with esthetics and performance aspect, the physical aspects also showed a decent satisfaction intensities similar to the visual stage management. For example, the reason that O’ Gallery has obtained such low satisfaction is just a simple factor; inconvenience of the cooling system in the galleries atmosphere. This is the perfect example that shows how small details in service could immensely distress other factors and the overall satisfaction levels. The analysis of the ARTQUAL model in the current case study showed that optimization and improvement in one aspect results in the overall perception of the service quality. In the perspective of the proposed DSS; the final rankings of the current case study shows that Shirin Gallery has obtained the highest ranks. But, analysis of the ARTQUAL tool shows that the satisfaction levels regarding the brand management have a low amout of satisfaction from the audience. As for another example, the exhibition in Farda gallery could have gained better results if the exhibitions were held in Shirin Gallery because the executive team showed a better productivity. The results and examples of the DSS and ARTQUAL model indicate that using such methodology can be a worthy assistance and support for the managers and directors who are dealing with esthetic environments to evaluate the service quality and select the best scenarios to achieve the ideal productivity for the organizations with esthetic environments such as art galleries.
7ConclusionCultural centers can be identified as organizations with esthetic and artistic surroundings. One of the main contributions of the current study was application of a comprehensive service quality measurement tool to evaluate the service quality in art galleries. The ARTQUAL quality measurement model was shaped from a literature review on service quality measurement models and quality concepts in artistic research that has been formulated with the EFA approach and validated based on the CB-SEM method. However, the primary novelty of this study, was introducing a hybrid DSS model. The current study has offered a novel DSS approach utilizing BWM as a weighting technique along with the target-based F-MULTIMOORA and FAD methods. This study has tackled a selection problem considering an assessment and evaluation of the cultural centers which counts as a novel application for MADM methods. A practical case study with regard to selecting the optimal art gallery based on the audience perception was considered based on seven art galleries in Tehran, Iran. In the present study, the criteria for the decision matrix were identified based on the dimensions of the ARTQUAL model. Ultimately, an extensive managerial examination based on the results of the ARTQUAL measurements and the DSS rankings showed the practicality and validity of the proposed approach.
As further directions based on the current study, propositions for future developments may be as follows. First, the ARTQUAL measurement tool, has been formulated and validated based on seven art galleries in Tehran, Iran. Due to the cultural differences in each and every geographic area or even a specified group of people, the consequence of the ARTQUAL model analysis may vary. Therefore, it is recommended to compare the perception of service quality based on the ARTQUAL model for art galleries in different areas and different cultural settings. Nevertheless, it is also recommended to apply and extend the ARTQUAL model in other service quality measurements of different cultural centers such as concert halls, cinemas, and theater halls. Second, the input data of the proposed DSS can be extended to various mathematical structures such as bipolar fuzzy sets, interval data structure, and neutrosophic multiset structures based on the gathered data in other applications. Third, this study has implemented a normalization technique based on the exponential normalization with target values. In view of that, there are many more normalization techniques such as linear compromise normalization that can also be utilized in the process of norm calculation of the DSS model.
Questionnaire of the ARTQUAL model for service quality measurements of art galleries (Ijadi Maghsoodi, Saghaei, et al., 2019).
| Dimension composite | Item/Question | Definition |
|---|---|---|
| Brand Management (A1) | i5 | How much does the brand of the art galleryinfluence you in regards to attending the exhibition? |
| i8 | Are you satisfied with the financial value of the presented exhibition based on your purchase(s)? | |
| i12 | How satisfied are you with the creativity and innovation in the special advertisement, facilities and material at the time before the exhibition and presentation? | |
| i13 | How satisfied are you with the process of purchasing an artwork in regard to the procuring process, packaging, delivery? | |
| Management and Policy (A2) | i14 | How satisfied are you with the time management considering the timetable, start and finish time of the art gallery? |
| i20 | What do you think about the location of the art gallery considering distance or proximity of nearby restaurants and entertainment facilities around the area? | |
| i21 | How satisfied are you with the security and safety features of the art gallery and the related areas? | |
| i23 | Are you satisfied with the facilities and extra services and side facilities of the art gallery such as parking lots, restaurants, coffee shops, resting areas? | |
| i26 | Are you satisfied with the crowd traffic flow, controlling the traffic and population control within the art gallery? | |
| i31 | Are you satisfied with the educational facilities of the art gallery such as conference rooms, workshops, ateliers? | |
| Personal Interaction (A3) | i27 | How satisfied are you with the participation and accountability of the artist(s) regarding the exhibition? |
| i28 | Are you satisfied with the skills and assistance of the executive staff of the art gallery including sales managers, technical representatives, security at the time before and during the exhibition? | |
| i29 | How was the level of the knowledge and skills of the presented artist(s) based on your perception and experience? | |
| i30 | How was the appearance of the artist(s) and how relevant was the appearance of the artist(s) to the aesthetics of the exhibition? | |
| Visual Stage Management (R1) | i15 | Are you satisfied with the impact of visual arts (visual art in the form of light and graphics related to the artwork) on the audience? |
| i16 | How was the music and special preparation in the pre-run area and pre-performance atmosphere like lobby, entrance hall and so on? | |
| i18 | Are you satisfied with the special audiovisual effects presented along with the exhibition? | |
| Form and Performance (R2) | i19 | How satisfied are you with the visual layout of the exhibited artwork? |
| i22 | How much did the artist(s) communicate with you as the audience/customer? | |
| i24 | How was the audiovisual effects and its relevance to the aesthetic form of the exhibition? | |
| i25 | Are you satisfied with the transmission of the aesthetic and artistic communications and messages in regard to the exhibited artwork? | |
| Physical Aspects (T1) | i1 | How satisfied are you with the appearance of the decoration and design of the exhibition area at the art gallery as well as the relevance of the embellishment to the artwork? |
| i2 | Are you satisfied with the utilization of the latest state-of-the-art and high-quality audiovisual facilities in the art gallery? | |
| i3 | How was the appearance and exterior quality of the audio and video facilities of an art gallery? | |
| i4 | How satisfied are you with the interior architecture and decoration of the areas (e.g. restaurant, lobby) related to the art gallery? | |
| i6 | How was the interior and exterior architecture of the art gallery? | |
| i7 | How much was the effect and impact of the atmosphere and environment of the theater hall and performing area based on the performance? | |
| Ergonomics (T2) | i9 | How comfortable and convenience was the seating/standing area? |
| i10 | Are you satisfied with the ease of movement in the exhibition area, moving routs in the seating/standing area, as well as the entrance and exiting locations? | |
| i11 | How was the heating, ventilation, air conditioning, as well as the additional noises in the art gallery? | |
| i17 | How was the natural and artificial lighting of the seating/standing area, as well as the exhibition area? |


