


This paper evaluates the effect of Enterprise Risk Management (ERM) on the performance and the financial stability of a sample of non-financial Spanish listed companies. The information about ERM is taken from the annual reports, management reports and annual corporate governance reports disseminated over four years (2012−2015). The data on performance and financial stability have been obtained through the SABI (Iberian Balance Sheet Analysis System) and Morningstar Direct. The results obtained show that the adoption of ERM is not associated with a change in the performance of Spanish companies (measured through the return on equity, return on assets and Tobin’s Q) nor does it reduce the probability of bankruptcy. Having a chief risk officer (CRO) can actually reduce performance, although it can improve the degree of financial health measured as the distance to default. Regarding the relationship between the hedging of risks on the profitability and the level of risk, we find evidence of improvement through the hedging of exchange risk.
Traditionally, risk management has been fragmented in ‘silos’, because companies have tended to organize their activities into functional areas for better decisions. Enterprise Risk Management (ERM) is the response to the inadequacies of using a silo-based approach to managing risk holistically in a portfolio (Hoyt & Liebenberg, 2011; Pagach & Warr, 2010). McShane (2018) provides a history of risk management research and practice and summarizes the main differences between traditional risk management and ERM. ERM is a systematic and integrated approach for the management of all risks faced by the company (Dickinson, 2001), so following D’Arcy and Brogan (2001), the ERM is the “process by which an organization determines, controls, exploits, finances, and monitors risks from all sources to its stakeholders”. Harrington, Niehaus, and Risko (2002) indicate that ERM refers to the identification, quantification and management of all the risks of a company within a unified framework. Consequently, ERM implies a change in the way in which risks are managed, from a fragmented approach which is limited to an integrated, continuous and wide-ranging approach. In other words, according to Bromiley, McShane, Nair, & Rustambekov (2015) ERM addresses all the risks of a company in a comprehensive and coherent way instead of managing them individually. According to the Committee of Sponsoring Organizations of the Treadway Commission (COSO, 2004) ERM ‘helps management achieve the entity’s performance and profitability targets and prevent loss of resources’. COSO ERM and the ISO 31000 frameworks provide a structured approach to implementing risk management on an enterprise-wide basis.
Just a few studies have been carried out on the relationship between ERM and performance, where different proxies for ERM have been used with mixed results (Bromiley et al., 2015). One of the main reasons for this disagreement is that companies do not publish information on how ERM programmes are carried out in practice, which makes it difficult to manage risk management activities (Gatzert & Martin, 2015; Liebenberg & Hoyt, 2003; Pagach & Warr, 2010). As indicated by Mikes and Kaplan (2014), most of the papers do not thoroughly analyse the type of management utilised or its quality, because it is assumed that that the existence of a chief risk officer (CRO) or a risk policy are quality indicators of the risk management.
There are mixed results regarding the relationship between performance and risk and ERM; our paper addresses the empirical concerns in prior literature and provides evidence using Spanish listed firms. The objective of this work is to assess the ERM situation in Spanish listed companies, as well as the effect that ERM has on performance and financial stability. We also focus on the connection between the hedging of risks on profitability and on the level of risk. Therefore, it is expected that companies that manage their risks better are more profitable and financially stable. Risk hedging is a transfer of risk and it can add value to companies and reduce the probability of bankruptcy. The study has been divided into four sections. In Section 2 we review the effect that ERM has on performance and risk in addition to the effect that risk hedging has on them. The third section describes the data and the variables used. The fourth section is the empirical part, in which panel data models are estimated. Finally, the main conclusions are presented.
2Enterprise risk management: HypothesisFrom a theoretical point of view, a positive relationship has been established between ERM and the performance of companies. Firstly, this is because holistic management makes it possible for companies to absorb a higher level of risk, to benefit from diversification and to reduce the inefficiencies inherent in the dispersion of risks between different departments or areas. Companies that use ERM should improve their knowledge of risks at an aggregate level in order to make invested capital and profitability more efficient (Hoyt & Liebenberg, 2011; Liebenberg & Hoyt, 2003). The enhancement of internal communication and the reduction of informational asymmetries allow decision-making to be refined (Bohnert, Gatzert, Hoyt, & Lechner, 2019). In addition, Tripp et al. (2008) consider that ERM helps companies align their risk appetite with their strategy and improve the response to risk, which leads to a reduction in losses. For this reason, companies can obtain a better trade-off between risk and long-term performance (Bohnert et al., 2019; Farrell & Gallagher, 2015; Lechner & Gatzert, 2018). Secondly, ERM can reduce the cost of hedging risks by preventing hedging from being duplicated and focusing exclusively on residual risk. Hoyt and Liebenberg (2011) argue that ERM helps reduce costs with respect to the adoption of individual risk treatment and allows natural hedging between different business activities. On the same lines, McShane, Nair and Rustambekov (2011) argue that ERM can increase the value of the company because the risk of an aggregate portfolio can be less than the sum of the individual risks. According to the updated COSO document (COSO, 2017), the benefits of ERM include ‘increasing the range of opportunities, identifying and managing risk entity-wide, increasing positive outcomes and advantages while reducing negative surprises, reducing performance variability, improving resource deployment and enhancing enterprise resilience’.
From an empirical point of view, there are different papers that have analysed the impact that an ERM system has on the performance of a company, yielding disparate results, although most researchers highlight that a positive effect is created. Kraus and Lehner (2012) have reviewed 25 articles about the link between ERM and value creation and conclude that there is evidence of a positive relationship between the implementation of an ERM programme and the creation of value. However, they also point out some results where there is a negative or a negligible link. In total, the impact of ERM on 64 value creation measures has been examined and in 78% of the cases the correlations are positive, in 17% of them the researchers fail to find any type of impact on the creation of value and 5% have even reported negative experiences. Beasley, Pagach, and Warr (2008)) say that, on average, there is no significant market reaction in the stock’s prices with respect to the hiring of risk managers (CROs). Their study focuses on short-term reactions to announcements of risk managers being hired due to the inability to foresee the impact of future decisions implemented by the new CROs. However, Hoyt and Liebenberg (2011) find a positive relation between firm value and the implementation of ERM. Farrell and Gallagher (2015) have investigated the effect of the maturity of an ERM programme on company value, and their results suggest that organizations that have reached mature levels of ERM exhibit a higher value measured through Tobin’s Q. Pagach and Warr (2010) have studied the effect of adopting ERM on long-term performance, examining financial and market characteristics. They see a slight impact as a result of adopting ERM, questioning whether it is able to achieve its objectives. However, they add that if results cannot be found it does not necessarily imply that adopting an ERM is disadvantageous, so a longer period of study may be required for benefits to be seen. Tahir and Razali (2011) report that ERM is positively related to the value of companies but it is not significant. On the other hand, Ellul and Yerramilli (2012) have studied the effects of the 2007 − 2008 crisis and observe that companies with high-risk controls operating before the financial crisis have performed better during said period. What is more, Nair, Rustambekov, McShane, and Fainshmidt (2014)) find that more advanced risk management provides value in the period of financial crisis in relation to traditional models. The result is positive when analysing the relationship between the five-category ERM rating of Standard and Poor's (S&P) and the value of the company (Ai, Bajtelsmit, & Wang, 2018; McShane, Nair, & Rustambekov, 2011); however, Pagach and Warr (2010) and Baxter, Bedard, Hoitash and Yezegel (2013) suggest that there is no relationship between the quality of ERM and market performance before and during the financial crisis; in fact, companies with higher quality ERM obtain greater profits after the market has recovered.
The differences found in the literature reviewed could be related to how well the risk management process is handled. As Gordon, Loeb, and Tsheng (2009) point out, the relationship between ERM and business performance depends on the appropriate harmonization between ERM and five factors that affect the company, namely environment uncertainty, industrial competition, company size, its complexity and monitoring carried out by the board of directors. Their results argue that companies should consider the implementation of an ERM system in conjunction with the environmental variables. Finally, there are authors such as Mikes and Kaplan (2014) who note the trouble with comparing results of studies that have used different methods to define and measure ERM; many variables utilized fail to capture the fine details of how ERM is implemented in each company. For example, the mere existence of a risk management department or a person with the title of risk manager explains very little about the quality, scope and impact of risk management processes. We can conclude that the variations in the results obtained in the literature come from the different measures of analysed performance (Tobin’s Q, return on assets or ROA, ROA/return volatility, etc.) as well as the differences in the measurement of ERM applied. Therefore, the alternatives are the use of binary variables, such as the presence of a CRO or voluntarily declaring that ERM is being used, the employment of ERM ratings, the use of surveys for measuring the quality of ERM and the maturity of the ERM. In general, the results reveal that the performance of companies is enhanced by the high-quality controls that integrate efforts to manage risks throughout the organization. Nevertheless, following Woon, Azizan, and Samad (2011), we have agreed that the effective implementation of ERM depends on some critical success factors (CSFs) during the implementation phase, meaning that it may have different effects on different companies.
H1: The adoption of ERM positively affects the performance of Spanish companies.
Companies involved in ERM can reduce their probability of bankruptcy or distress (Bohnert et al., 2019; Farrell & Gallagher, 2015; Hoyt & Liebenberg, 2011; Lechner & Gatzert, 2018). Thus, Stulz (1996) argues that risk management reduces the likelihood of destroying value during financial crises by reducing or eliminating so-called ‘costly lower-tail outcomes’. Other authors, such as Andersen (2008); Jafari, Chadegani, and Biglari (2011)); McShane et al. (2011) and Hoyt and Liebenberg (2011) also maintain that ERM makes bankruptcy less likely and cuts the average capital cost to which the company has access. According to Nocco and Stulz (2006), insurance companies that utilize ERM can access the capital markets and other resources more successfully and, at the same time, improve risk management, indicating that the ERM helps reduce the probability of financial problems occurring. In addition, rating agencies have begun to incorporate ERM in their rating procedures (Hoyt & Liebenberg, 2015), which has been seen to be significantly associated with a reduction in the cost of capital of a firm. Berry-Stölzle and Xu (2018) discuss multiple conceptual arguments as to why ERM adoption should be able to reduce said expenses as well as improve their global score if they have an ERM rating (Berry-Stölzle & Xu, 2018; Fraser & Simkins, 2007; Gatzert & Martin, 2015; Meulbroek, 2002). Thus, ERM reduces the volatility of a company’s profits and increases its value (Hoyt & Liebenberg, 2011; Smithson & Simkins, 2005). On an empirical level, Eckles, Hoyt and Miller (2014) have found that companies which adopt ERM witness a reduction in the volatility of their share prices. This result is similar to that obtained by Andersen (2008), which means that the understanding that ERM has the ability to make corporate earnings more stable is maintained. Besides this, Ellul and Yerramilli (2012) observe that companies with high-risk controls operating before the financial crisis are more careful when taking risks.
H2: Adopting ERM reduces the likelihood of bankruptcy.
A fundamental element of risk management is risk hedging. Following corporate hedging theories, one of the main hypotheses supports the lower probability of bankruptcy inherent in the hedging and risk management process. In particular, Smith and Stulz (1985) show that the likelihood of having financial problems for a company is less when companies hedge and manage their risks. Several studies analyse whether the probability of distress is a determinant of risk management policies. Particularly noteworthy are the papers by Tufano (1996); Berkman and Bradbury (1996); Gay and Nam (1999); Howton and Perfect (1999); Haushalter (2000); Graham and Rogers (2002), and Knopf, Nam, and Thornton (2002) whose results show that the most indebted companies use more hedging instruments. Magee (2013) has obtained empirical evidence which demonstrates that the hedging of the risk, and consequently its management, reduces the probability of a company going under. In a recent working paper, Biguri, Brownlees, and Ippolito (2018) focus on the relation between hedging and the volatility of stock returns, finding that the risk management function improves a firm’s performance and stock value and reduces the variance of stock returns.
H3: Risk hedging improves performance and reduces the likelihood of bankruptcy.
3Data and variables3.1DataThe sample consists of a maximum of 162 Spanish listed companies.1 The sample has been determined based on the Spanish companies already listed on the Spanish Stock Exchange in 2015, which had economic data available in the SABI (Iberian Balance Sheet Analysis System), from which the data of each company’s balance sheet have been taken. Data have also been taken from the annual financial statements (annual reports, management reports and annual corporate governance reports) over four years (2012 − 2015) for each company. Such examples are quantitative economic data related to performance and qualitative data from the notes section related to risk management. The economic-financial data have been obtained through the SABI database. This information has been complemented with the risk indicators available in the Morningstar Direct database. The information regarding risk management and ERM has been obtained through keyword searches in the annual reports, management reports and corporate governance reports (if available). The determined variables seek to define whether or not there is a risk management system, as well as to get an idea about the quality or degree of implementation of an ERM.
The selection of listed companies responds to their greater obligation to disclose public access information. Additionally, in the sample studied there is an abundant sectoral representation and the companies that operate are exposed to a plurality of risks that make the analysis especially interesting. This allows us to consider various measures of performance and risk and to analyse to what extent the information available in the reports of the companies allows us to evaluate the characteristics and the differences in the quality of risk management.
3.2Dependent variablesTo analyse the creation of value in companies, this study employs firms’ performances measured by return on equity (ROE), ROA and Tobin’s Q as they are very popular ratios in the measurement of business performance. ROE (Lam, 2001; Pagach & Warr, 2010, among others), ROA (Baxter, Bedard, Hoitash, & Yezegel, 2013; Eckles, Hoyt, & Miller, 2014; Farrell & Gallagher, 2019; Hoyt & Liebenberg, 2011, among others) and Tobin’s Q (Baxter et al., 2013; Farrell & Gallagher, 2019; Hoyt & Liebenberg, 2011; McShane et al., 2011, among others). In relation to the risk, we have combined market-based indicators with others based on accounting information. As Hillegeist, Keating, Cram, and Lundstedt (2004) among others point, the use of accounting-based measures also has disadvantages against market-based measures, so the results obtained with measures of a different nature cannot be the same. In particular, various market variables have been considered, such as the Quantitative Financial Health Distance to Default, measured by Morningstar as an indicator of the probability of bankruptcy. We also employ Beta as an indicator of systematic risk, return volatility (standard deviation) of the stock’s price and value at risk (VaR) as downside risk measures to overcome the equal weighting of downside and upside outcomes of the standard deviation. Finally, the Altman Z-score is included as a proxy for the bankruptcy risk based on accounting data. The source of these variables is Morningstar Direct. Lundqvist and Vilhelmsson (2018) measure credit risk with Credit Default Swaps (CDS) and credit rating, neither measure being appropriate for our sample because they are not available. Table 1 shows the definition of the dependent variables.
Dependent variables.
| Variable | Explanation |
|---|---|
| Return on assets (ROA) | Earnings before interest and taxes (EBIT) / Assets |
| Return on Equity (ROE) | Net Income / Shareholder Equity |
| Tobin’s Q (Q) | Market value / Book value |
| Quantitative Financial Health Distance to Default (DD) | Using a predictive model, Morningstar’s Quantitative Financial Health reflects the probability that a company will face financial distress in the near future (Morningstar, 2018).1 |
| Value at Risk (VaR) | This is a measure of how much a share price might fall with a given probability (p), given normal market conditions, in a set time period:VaRp(Y) = Prob(Y ≥ Y*) = p |
| Systematic risk (Beta) | This is a measure of stock volatility in relation to the market:Ri= α + βiRm + εiwhere: Ri is stock return, Rm is market return (MSCI Spain) and εi is the error term. The frequency of data is weekly. |
| Volatility (Dv) | This is the standard deviation, i.e. a statistic that measures the dispersion of a data set of stock returns relative to its mean. |
| Z-score | The Altman Z-score formula for predicting bankruptcy is (Begley, Mings, & Watts, 1996):Z=0.104 X1+1.010X2 +0.106X3 + 0.003X4+ 0.169X5where: X1= working capital ÷ total assets; X2= retained earnings ÷ total assets; X3 = earnings before interest and taxes ÷ total assets; X4= market value of equity ÷ book value of total liabilities; X5= sales ÷ total assets. |
Table 2 shows the mean, the standard deviation and the minimum and maximum values of the variables throughout the sample (2012 − 2015)2 . The average value of Tobin’s Q is 2.45, which means that, on average, the market value of a company is approximately two and a half times higher than the book value of the firm. Average profitability measured through ROA and ROE is low but positive (2.16% and 1.46%, respectively). The mean of financial distress in the near future measured by the probability of default is 0.53%. Re-estimation of the Altman model by Begley, Ming, and Watts (1996)) obtains a mean value of 0.85, the stock volatility mean is lower than the market mean (beta<1) and the annual standard deviation of stock returns is 24.26%.
Summary of dependent variable data (2012 − 2015).
| Variable | Mean | SD | Min | Max |
|---|---|---|---|---|
| ROA | 0.0216 | 0.1120 | −0.5152 | 0.7342 |
| ROE | 0.0146 | 0.4555 | −2.8427 | 2.9929 |
| Q | 2.4579 | 2.6561 | 0.0903 | 16.1461 |
| VaR | 13.7815 | 12.0491 | – | 86.3736 |
| DD | 0.5352 | 0.2073 | – | 0.9634 |
| Z-score | 0.8535 | 0.6161 | −1.0440 | 3.7116 |
| Beta | 0.9381 | 0.8571 | −2.0654 | 3.3096 |
| Dv | 24.2653 | 12.6961 | 8.2059 | 65.7045 |
Note: SD is the standard deviation; Min and Max are the minimum and maximum values, respectively; ROA is the return on assets; ROE is the return on equity; Q is Tobin’s Q; VaR is the Value at Risk; Z-score is the Begley et al. (1996) version of the Altman Z-score formula; Beta is a measure of a stock’s volatility in relation to the market; finally, Dv is the standard deviation of returns.
The independent variables determine the implementation of a risk management system in a company as well as the quality of the implemented system, based on whether or not they have particular characteristics that could be indicators of good practices in risk management. In Table 3, the variables used, the keywords used in the search and their descriptions can be seen. All variables are considered dummy variables, i.e. they are binary variables that take the value of ‘1’ in the case of fulfilling the required condition or ‘0’ otherwise.
Independent variables.
| Name | Keyword | Specification |
|---|---|---|
| Variables related to the presence of a risk management system | ||
| Risk_Committee | Risk Committee | Presence of a risk committee in the company |
| CRO | Chief Executive Officer, CRO | Presence of a CRO in the company |
| Risk_Map | Risk map | Existence of a risk map in the company |
| ISO | ISO, ISO 31,000 | Tracking the ISO 31,000 framework |
| COSO | COSO, Committee of Sponsoring Organizations of the Treadway | Tracking the COSO framework |
| Variables related to the use of derivatives and risk hedging | ||
| Hedging_interest | Derivative financial instruments, hedging, interest rates, interest risk | Existence of financial instruments dedicated to the hedging of the risk of variation of interest rates |
| Hedging_exchange | Derivative financial instruments, hedging, exchange rates, exchange risk | Existence of financial instruments dedicated to the hedging of the risk of variation of exchange rates |
| Hedging_credit | Derivative financial instruments, hedging, credit risk | Existence of financial instruments dedicated to the hedging of the credit risk |
| Hedging_price | Derivative financial instruments, hedging, price risk | Existence of financial instruments dedicated to the hedging of the price of raw materials or the sale price |
In Table 4 we show the mean values, expressed in percentages, of our proxy variables for ERM. In general, we see that there is an increase in the absolute number of companies that have ERM implemented in the period analysed (2012 − 2015), but in the case of COSO proxy that value is reduced in proportion as a consequence of new small companies that do not follow this standard. In general, companies follow the COSO standard much more often than the ISO 31000 standard in the risk management system (47 companies versus 8 in 2015). In general, the risk map and the level of tolerance have a notable degree of implementation, but there are still a few companies that declare to have typical elements of ERM such as the presence of a CRO. Finally, there are an increasing number of companies that incorporate a risk committee in their organizational structures, reaching a level of 21.6% in 2015. Having a risk committee is considered a good risk governance practice (Mongiardino & Plath, 2010). Due to this, companies that have a committee with independent members are valued positively meaning that they can influence the decisions of the CEO and the board of directors (Aebi, Sabato, & Schmid, 2012). Ellul and Yerramilli (2012) have built a Risk Management Index based on five factors which takes into account whether the CRO is a member of the executive committee as well as other elements of the risk committee, finding that a higher value in the index corresponds with lower risk exposures to financial products and this is reflected in a lower proportion of unpaid loans and a higher Sharpe ratio during the financial crisis. It is observed that the risks that Spanish listed companies hedge the most are interest and exchange rate. In general, there is a fall in the percentage of companies that hedge interest rate, exchange rate, credit and price risks throughout the analysed sample.
Mean values of independent variable data (2012 − 2015).
| Variable | 2012 | 2013 | 2014 | 2015 |
|---|---|---|---|---|
| Risk_Committee | 19.55 | 21.48 | 19.73 | 21.60 |
| CRO | 6.77 | 10.37 | 9.52 | 9.88 |
| Risk_Map | 52.63 | 58.52 | 59.86 | 57.41 |
| ISO | 3.76 | 3.70 | 4.76 | 4.94 |
| COSO | 30.08 | 30.37 | 31.29 | 29.01 |
| Hedging_interest | 53.38 | 51.11 | 42.86 | 38.27 |
| Hedging_exchange | 38.35 | 36.30 | 31.29 | 30.25 |
| Hedging_credit | 21.05 | 22.96 | 19.05 | 16.67 |
| Hedging_price | 0.75 | 0.74 | 0.68 | 0.62 |
Note: This table shows the percentage of dummy variable presence throughout the period. Risk_Committee is a dummy variable for the presence of a risk committee in the company. CRO is a dummy variable for the presence of a Chief Risk Officer. Risk_Map is a dummy variable for the presence of a risk map in the company. ISO and COSO are dummy variables for the tracking of the ISO 31000 and COSO frameworks, respectively. Hedging_interest, Hedging_exchange, Hedging_credit and Hedging_price are dummy variables for the existence of financial instruments dedicated to the hedging of the risk of interest rates, exchange rates, credit risk and the sale price, respectively.
The size of the company is usually related to the degree of diversification in such a way that the larger the company is, the more it can use its market power to obtain greater profits (Ang, Peterson, & Peterson, 1985) and be more prepared in the event of economic changes (Sullivan, 1978). Smaller companies are affected by greater difficulties in medium- and long-term financing (Hellmann & Stiglitz, 2000) and higher financial costs. At the empirical level, several studies confirm the risk-reducing effect for company size. By the same token, Ohlson (1980) identifies size as one of the key factors that significantly and negatively affects the probability of a business failing. Since large firms are more likely to have ERM programmes in place (Beasley, Clune, & Hermanson, 2005; Colquitt, Hoyt, & Lee, 1999; Liebenberg & Hoyt, 2003), it is important to control for firm size in our analysis, which is measured as the natural logarithm of total assets as a variable (see for example, Farrel & Gallagher, 2019; Hoyt & Liebenberg, 2011; McShane et al., 2011).
Regarding the effect of solvency on the level of risk, financial theory establishes a negative link associated with the greater financial risk of indebtedness. The market perceives that the more indebted a company is the greater its financial risk is in terms of not being able to meet all its obligations. This relationship has also been seen in the work of Lee and Jang (2007), among others. Liebenberg and Hoyt (2003) find that firms with greater leverage are more likely to appoint a CRO. Pagach and Warr (2011) also notice that banks with lower capital ratios are more likely to hire a CRO, and thus to pursue ERM. The variable leverage, measured as the book value of total liabilities divided by the market value of equity, has been used in several studies that measure the effect of ERM on performance, such as Pagach and Warr (2010); McShane et al. (2011); Hoyt and Liebenberg (2011) and Farrell and Gallagher (2014, 2019).
There are different and opposing theories that try to explain the relationship between liquidity and risk. Similarly, for the first investigation into the correlation between both variables, Beaver, Kettler, and Scholes (1970)) find a negative relationship. However, the empirical studies by Rosenberg and McKibbin (1973) and Pettit and Westerfield (1972) show liquidity ratios positively associated with risk. On the other hand, Logue and Merville (1972) do not notice any significant relationship between liquidity ratios and risk. Table 5 summarizes the three control variables described above.
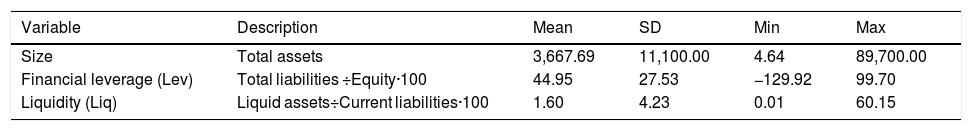
Control variables.
| Variable | Description | Mean | SD | Min | Max |
|---|---|---|---|---|---|
| Size | Total assets | 3,667.69 | 11,100.00 | 4.64 | 89,700.00 |
| Financial leverage (Lev) | Total liabilities ÷Equity∙100 | 44.95 | 27.53 | −129.92 | 99.70 |
| Liquidity (Liq) | Liquid assets÷Current liabilities∙100 | 1.60 | 4.23 | 0.01 | 60.15 |
Note: SD is the standard deviation, Min and Max are the minimum and maximum values respectively. The size of the data is expressed in millions of euros. Lev and Liq are expressed in per cent.
The methodology that we have used to evaluate the hypotheses proposed is the estimation of multiple regression models based on panel data, which allows a reduction in collinearity and greater efficiency. In addition, it allows the number of degrees of freedom to be increased, reduces the level of collinearity and controls for individual effects, preventing biases from being introduced that could arise due to the existence of characteristics such as quality of management or risk aversion, which are difficult to measure or obtain (Baltagi & Moscone, 2010). We use a random effects model because there are some variables which are quite invariant over time3 (Mollah & Zaman, 2015). We have estimated three types of models.
3.6Model IThe proposed model that relates the implementation of an ERM model based on the principles of COSO II and ISO 31000 and the risk and performance measures is:
where: Yit are different measures of performance (ROA, ROE and Tobin’s Q) and risk (Value at Risk, Beta, Volatility of Return, Z-score and Distance to Default). COSO and ISO are dichotomous variables that take the value of ‘1’ when the company has ERM based on the principles of COSO II or ISO 31000 and ‘0’ elsewhere. Xj are control variables (liquidity, leverage and natural logarithm of size), Year are dummy variables relative to the period and Sector collects a set of dummies relative to the sector of the company4 . One dummy per group is omitted to avoid perfect multi-collinearity.
Our findings (see Table 6) show that implementing standards such as COSO II or ISO 31000 does not result in an improvement in the level of performance or financial stability (i.e. the coefficients are not statistically significant). This result is similar to that obtained by Pagach and Warr (2010) and Baxter et al. (2013), who conclude that better quality ERM does not imply better performance during the crisis. In the same vein, these results are in line with the approaches of Mikes and Kaplan (2014) who indicate that many variables fail to capture the response to how ERM is actually implemented in each company.
Estimated models for the implementation of ERM (COSO and ISO).
| Variable | Q | ROE | ROA | DD | VaR | Z-Score | Beta | Dv |
|---|---|---|---|---|---|---|---|---|
| COSO | 0.0178 | −0.0277 | 0.0239 | 0.0365 | −0.0547 | 0.0028 | −0.0258 | 0.179 |
| ISO | −0.4548 | 0.0394 | −0.0041 | −0.0336 | 0.2216 | 0.2179 | 0.1593 | 0.9589 |
| LogSize | −0.0645 | 0.0181 | 0.0143*** | 0.0087 | −0.0861** | 0.0355 | 0.0311 | −1.3648** |
| Liq | 0.0409 | 0.0148 | 0.0067 | 0.0053 | −0.0424 | 0.008 | −0.0468** | −1.2175** |
| Lev | −0.0179** | 0.0056*** | 0.0009*** | −0.0001*** | 0.0001* | 0.0149*** | 0 | −0.0002 |
| Year 2012 | −0.7267*** | −0.0538 | −0.0225** | −0.0968*** | 0.0936 | 0.0113 | −0.1311 | 2.7152** |
| Year 2013 | −0.0669 | −0.0698 | −0.0144 | −0.0158 | −0.3738*** | −0.0352 | −0.2127*** | 1.2136 |
| Year 2014 | −0.1278 | 0.0092 | −0.0017 | −0.0169 | −0.1127 | 0.0189 | −0.1094 | 0.0084 |
| Sector2 | −0.4038 | 0.1958** | 0.0251 | 0.0824 | −0.0321 | 0.7026*** | −0.1923 | −5.6899** |
| Sector3 | 0.2118 | 0.0587 | 0.0412* | 0.0174 | 0.115 | 0.6224** | −0.0347 | −3.3447 |
| Sector4 | −1.1050** | −0.1314 | 0.0044 | 0.0112 | 0.3703 | 0.5000** | 0.1414 | 3.2622 |
| Sector5 | −0.5634 | 0.0896 | 0.0082 | −0.062 | 0.3036 | 0.5073*** | 0.0467 | 3.1392 |
| Sector6 | −0.6577 | −0.0092 | −0.0273 | −0.0085 | 0.5150* | 0.0933 | −0.0905 | 8.8638* |
| Cons | 4.8480** | −0.5198** | −0.2173*** | 0.4434*** | 3.5496*** | −0.4629 | 0.6352* | 42.5599*** |
| N | 350 | 466 | 498 | 387 | 382 | 405 | 407 | 403 |
| Adjusted R2 | 0.057 | 0.0726 | 0.2119 | 0.0919 | 0.0632 | 0.3778 | 0.0723 | 0.1316 |
Note: This table shows the estimates of random effects models. Independent variables are different measures of performance (Tobin’s Q, ROA and ROE) and risk (Distance to Default, Value at Risk, Z-score, Beta and Volatility of Return). COSO and ISO are dichotomous variables that take the value of ‘1′ when the company has implemented a risk management system adapted to these frameworks. LogSize is the natural logarithm of the total assets of the company. Liq the ratio of liquidity and Lev is the solvency ratio. Temporary and sectorial dummies have also been included. Cons is the constant term of regression and N is the number of observations. * Significant at 10%; ** significant at 5%; *** significant at 1%.
The estimated model for variable proxies of ERM is:
where: Yit are different measures of performance (ROA, ROE and Tobin’s Q) and risk (Value at Risk, Beta, Volatility of Return, Z-score and Distance to Default). RiskCommittee, CRO and RiskMap are dichotomous variables that take the value of ‘1’ when the company has a risk committee, a CRO and a risk map and ‘0’ elsewhere. Xj are control variables (liquidity, leverage and natural logarithm of size). Year are dummy variables relative to the period and Sector collects a set of dummies relative to the sector of the company. One dummy per group is omitted to avoid perfect multi-collinearity.
Table 7 shows the results of the estimation. It is observed that dichotomous variables do not generally have any effect on performance or risk. In the case of CRO, the effect is negative on the ROE and ROA, which negates our initial hypothesis. Mikes and Kaplan (2014) find that many of the variables fail when trying to capture the complexity of how the ERM is actually implemented in each company. On the same subject, the presence of a CRO in a firm explains very little about the quality, scope and impact of the risk management processes, i.e. it is not possible to differentiate the level of quality inherent to the risk management process from dichotomous variables. The effect of a CRO is positive for stock return volatility, causing a reduction in volatility for ERM-adopting companies. However, the effect on distance to default is negative, which means that companies that have a CRO have a higher probability of facing financial distress in the near future (the lower the Distance to Default, the higher the probability of default).
Estimated models for the implementation of ERM.
| Variable | Q | ROE | ROA | DD | VaR | Z-Score | Beta | Dv |
|---|---|---|---|---|---|---|---|---|
| Risk Committee | 0.1515 | 0.0746 | 0.0025 | −0.0179 | 0.2365 | 0.0134 | 0.0533 | 0.002 |
| CRO | −0.2338 | −0.1991* | −0.0333** | −0.0892** | 0.0075 | −0.1091 | 0.0492 | 3.9892* |
| RiskMap | 0.0198 | −0.0132 | −0.01 | 0.015 | −0.0472 | −0.1213* | 0.0886 | 0.9078 |
| LogSize | −0.0681 | 0.0226 | 0.0187*** | 0.0145* | −0.0942** | 0.0569* | 0.0134 | −1.6403*** |
| Liq | 0.0294 | 0.0216 | 0.0077* | 0.0075 | −0.042 | 0.0183 | −0.0491** | −1.2959*** |
| Lev | −0.0172** | 0.0052*** | 0.0009*** | −0.0001*** | 0.0001** | 0.0149*** | 0 | 0.0001 |
| Year 2012 | −0.7063*** | −0.0591 | −0.0259** | −0.1014*** | 0.0964 | −0.0137 | −0.1165 | 3.0028** |
| Year 2013 | −0.041 | −0.0704 | −0.016 | −0.0172 | −0.3712*** | −0.0483 | −0.2075*** | 1.2572 |
| Year 2014 | −0.1163 | 0.0103 | −0.0026 | −0.0176 | −0.1085 | 0.0145 | −0.1061 | 0.0555 |
| Sector2 | −0.3991 | 0.1761* | 0.0262 | 0.0894 | −0.0763 | 0.6836*** | −0.1998 | −5.5561** |
| Sector3 | 0.2539 | 0.0683 | 0.0382* | 0.0083 | 0.139 | 0.6252** | −0.0295 | −3.6079 |
| Sector4 | −1.0520** | −0.1277 | 0.0067 | 0.0269 | 0.3174 | 0.4636** | 0.1472 | 3.0656 |
| Sector5 | −0.5157 | 0.1111 | 0.0041 | −0.0664 | 0.3473 | 0.4939*** | 0.0793 | 3.1061 |
| Sector6 | −0.5371 | 0.0163 | −0.0245 | −0.0103 | 0.5505* | 0.0617 | −0.0762 | 9.2474* |
| Cons | 4.7911** | −0.5690** | −0.2557*** | 0.3820*** | 3.6126*** | −0.6341 | 0.7725** | 45.2639*** |
| N | 350 | 466 | 498 | 387 | 382 | 405 | 407 | 403 |
| Adjusted R2 | 0.0519 | 0.0888 | 0.1986 | 0.1147 | 0.0589 | 0.3846 | 0.0865 | 0.1531 |
Note: This table shows the estimates of random effects models. Independent variables are different measures of performance (Tobin’s Q, ROA and ROE) and risk (distance to default, Value at Risk, Z-score, Beta and Volatility of Return). RiskCommittee, CRO and RiskMap are dichotomous variables that take the value of “1” when the company has implemented an Enterprise Risk Management system, has a Risk Committee, has a Chief Risk Officer and uses the risk map to detect new risks and threats. LogSize is the natural logarithm of the total assets of the company, Liq the ratio of liquidity and Lev is the solvency ratio. Temporary and sectorial dummies have also been included. Cons is the constant term of regression and N is the number of observations. * Significant at 10%. ** Significant at 5%. *** Significant at 1%.
Risk hedging is an important tool in integrated risk management that generates value and provides financial stability. Below we show the proposed model that relates performance and risk to the type of hedging:
where: Yit are different measures of performance (ROA, ROE and Tobin’s Q) and risk (Value at Risk, Beta, Volatility of Return, Z-score and Distance to Default). Hedging_i variables represent different variables related to risk hedging (interest risk, exchange risk, prices and credit risk), Xj are control variables (liquidity, leverage and size), Year are dummy variables relative to the period and Sector collects a set of dummies relative to the sector of the company. One dummy per group is omitted to avoid perfect multi-collinearity.
Table 8 analyses the relationship between hedging different types of risks (interest risk, exchange risk, prices and credit risk) to which companies are exposed and the performance and risk of a firm. Particularly noteworthy is the case of exchange rate hedging, where the improvement in Tobin’s Q, ROA and ROE is also reflected in a reduction in the level of risk (measured by the Altman Z-Score, Beta and stock volatility). Similarly, exchange rate hedging could support a reduction in financial problems and the creation of value, in line with the results of Smith and Stulz (1985) and Magee (2013). However, we have also observed that other hedgings (interest, credit and prices) are negatively related to performance measured through Tobin’s Q, ROE and ROA. The explanation for this could be related to the fact that hedging certain scenarios that have not yet materialized eventually builds up costs that can negatively affect the desired outcome for the business. For example, when in phases of expansion with very low fixed interest rates and low default rates, resources may be allocated to take out insurance or derivative products in order to hedge risks, such as interest rates or credit risk. In these cases, having fixed-rates closed through swaps or formalizing risk hedging products could be more of a financial burden than a source of profit and stability. Additionally, the effect of hedging interest rates on the distance to default is negative, which means that companies that hedge this risk are more likely to encounter financial distress in the near future. This raises doubts about whether the hedging of risk is always beneficial and that its result depends on the scenarios and the type of risk.
Estimated models considering risk hedging variables.
| Variable | Q | ROE | ROA | DD | VaR | Z-Score | Beta | Dv |
|---|---|---|---|---|---|---|---|---|
| Hedging_interest | −0.02 | −0.1018** | −0.0068 | −0.0412* | 0.0512 | 0.0253 | −0.0637 | 1.5316 |
| Hedging_exchange | 0.5179* | 0.1232** | 0.0386*** | 0.0392 | −0.2014 | 0.2070*** | −0.1486* | −4.4329*** |
| Hedging_price | 0.0566 | −0.0077 | −0.0408* | −0.0269 | 0.1874 | −0.1856** | −0.0741 | 1.2685 |
| Hedging_credit | −1.1648*** | −0.0545 | −0.0276 | −0.0276 | 0.0135 | −0.1571 | −0.0511 | −1.206 |
| LogSize | −0.0905 | 0.0183 | 0.0158*** | 0.0149* | −0.0716* | 0.0271 | 0.0655** | −0.9424 |
| Liq | 0.0273 | 0.0127 | 0.0067* | 0.0054 | −0.0358 | 0.0149 | −0.0454** | −1.1502** |
| Lev | −0.0186** | 0.0054*** | 0.0009*** | −0.0001*** | 0.0001** | 0.0147*** | −0.0001 | −0.0001 |
| Year2012 | −0.7149*** | −0.0434 | −0.0227** | −0.0923*** | 0.0765 | −0.0037 | −0.125 | 2.5405** |
| Year 2013 | −0.0326 | −0.0583 | −0.0139 | −0.0093 | −0.3907*** | −0.0436 | −0.2083*** | 1.0103 |
| Year 2014 | −0.0999 | 0.0142 | −0.0009 | −0.0135 | −0.1251 | 0.0207 | −0.1111 | −0.1712 |
| Sector2 | −0.3453 | 0.1763* | 0.0278 | 0.087 | −0.0296 | 0.6802*** | −0.169 | −4.9825* |
| Sector3 | 0.3521 | 0.0407 | 0.0345 | 0.0057 | 0.1458 | 0.6162** | −0.0033 | −2.4435 |
| Sector4 | −1.1976*** | −0.1035 | 0.0052 | 0.022 | 0.3318 | 0.4736** | 0.0951 | 2.1414 |
| Sector5 | −0.7925 | 0.0647 | −0.0107 | −0.0800* | 0.3641 | 0.4291** | 0.0612 | 3.714 |
| Sector6 | −0.5375 | 0.0239 | −0.0202 | 0.0228 | 0.4116 | 0.1193 | −0.1564 | 6.7835 |
| Cons | 5.2899*** | −0.5045** | −0.2259*** | 0.3868*** | 3.3842*** | −0.3574 | 0.2972 | 38.4192*** |
| N | 350 | 466 | 498 | 387 | 382 | 405 | 407 | 403 |
| Adjusted R2 | 0.1239 | 0.0869 | 0.2236 | 0.136 | 0.0764 | 0.3921 | 0.0876 | 0.1583 |
Note: This table shows the estimates of random effects models. Independent variables are different measures of performance (Tobin’s Q, ROA and ROE) and risk (distance to default, Value at Risk, Z-score, Beta and Volatility of Return). RiskCommittee, CRO and RiskMap are dichotomous variables that take the value of “1 “when the company has implemented an Enterprise Risk Management system, has a Risk Committee, has a Chief Risk Officer and uses the risk map to detect new risks and threats. LogSize is the natural logarithm of the total assets of the company, Liq the ratio of liquidity and Lev is the solvency ratio. Temporary and sectorial dummies have also been included. Cons is the constant term of regression and N is the number of observations. * Significant at 10 %. ** Significant at 5%. *** Significant at 1%.
For robustness we consider cases where the first percentile of debt is eliminated (examples of where there is either no leverage or where it is too low, implying null or low default risk) and we obtain the same results for the three models. We also consider other control variables such as intangibility because they could be related to company risk, and therefore, to the ERM policies followed - similar results are found.
Estimated models I, II and III show the joint effects of different variables. COSO and ISO frameworks are not mutually exclusive for a particular company. Risk Committee, CRO, and RiskMap are not mutually exclusive either, so it could be appropriate to model them separately in each regression. The results achieved are similar to those set out previously in the paper. For example, Table 9 shows the results for COSO and ISO standards. Companies with COSO or ISO 31000 standards do not have better performance levels or financial stability (the coefficients are not statistically significant). We also performed this analysis with model III (hedging individual risk) to present them separately in each regression, also achieving similar results.
Estimated models considering individual effects of COSO and ISO.
| Variable | Q | Q | ROA | ROA | QFHS | QFHS | Z-Score | Z-Score |
|---|---|---|---|---|---|---|---|---|
| COSO | 0.0143 | 0.0093 | 0.0346 | −0.0730 | ||||
| ISO | −0.4123 | −0.0019 | −0.0270 | 0.0444 | ||||
| LogSize | −0.0802 | −0.0748 | 0.0240*** | 0.0248*** | 0.0079 | 0.0117 | 0.1098** | 0.1029** |
| Liq | −0.0129 | 0.0011 | 0.0043 | 0.0044 | 0.0047 | 0.0062 | −0.0710* | −0.0739* |
| Lev | −0.0167* | −0.0172** | 0.0018*** | 0.0018*** | −0.0001*** | −0.0001*** | 0.0318*** | 0.0318*** |
| yr2012c | −0.6809*** | −0.7005*** | −0.0173* | −0.0178* | −0.0958*** | −0.0974*** | 0.0506 | 0.0542 |
| yr2013c | −0.0317 | −0.0515 | −0.0168 | −0.0171 | −0.0145 | −0.0164 | 0.0145 | 0.0175 |
| yr2014c | −0.1153 | −0.1212 | −0.0002 | −0.0003 | −0.0166 | −0.0165 | 0.0718 | 0.0717 |
| yr2015c | (omitted) | (omitted) | (omitted) | (omitted) | (omitted) | (omitted) | (omitted) | (omitted) |
| Sector2 | −0.3326 | −0.3631 | 0.0376 | 0.0381 | 0.0845 | 0.0891 | 0.6910*** | 0.6831*** |
| Sector3 | 0.2789 | 0.2403 | 0.0513** | 0.0492** | 0.0188 | 0.0091 | 0.6723*** | 0.6936*** |
| Sector4 | −1.0072** | −1.0485** | −0.0182 | −0.0180 | 0.0141 | 0.0123 | 0.4016 | 0.4060 |
| Sector5 | −0.5121 | −0.5258 | 0.0050 | 0.0032 | −0.0622 | −0.0699 | 0.7707*** | 0.7879*** |
| Sector6 | −0.4226 | −0.4778 | −0.0111 | −0.0114 | −0.0053 | −0.0002 | 0.1981 | 0.1872 |
| Cons | 4.9509** | 4.9440** | −0.3809*** | −0.3875*** | 0.4513*** | 0.4182*** | −2.1331*** | −2.0771*** |
| N | 350 | 350 | 498 | 498 | 387 | 387 | 405 | 405 |
Note: This table shows the estimates of random effects models. Independent variables are different measures of performance (Tobin’s Q, ROA and ROE) and risk (Distance to Default, Value at Risk, Z-score, Beta and Return´s Volatility). COSO and ISO are dichotomous variables that take the value of ‘1’ when the company has implemented a risk management system adapted to these frameworks. LogSize is the natural logarithm of the total assets of the company, Liq is the ratio of liquidity and Lev is the solvency ratio. Temporary and sectorial dummies have also been included. Cons is the constant term of regression and N is the number of observations. * Significant at 10%; ** significant at 5%; *** significant at 1%.
Random effects models do not address the problem of reverse causality, which may exist, even though ERM has the ability to explain low and high credit risk, the latter of which can be dealt with via a strong ERM policy. We estimate models I, II and III using the Generalized Method of Moments (GMM)5, which does acknowledge reverse causality and obtains similar evidence. We have also handled the endogeneity problem using pooled models with lagged variables without our previous results being affected.
4ConclusionsThis paper analyses the effect of implementing comprehensive or integral risk management in a company, known as Enterprise Risk Management (ERM for short), on risk and performance. Overall, it is assumed that applying risk management and hedging systems creates value and increases the financial stability of a firm. However, our results do not show that just by implementing standards such as COSO II or ISO 31000, an improvement in the level of performance or financial stability for Spanish listed companies is assured. We found no evidence that companies create value via ERM6, nor do previous studies such as Pagach and Warr (2010) or Baxter et al. (2013), conclude this. The differences found in this work could be related to the quality with which the risk management process is handled, an aspect that does not depend exclusively on complying with a certain standard, but it also looks at how the process is carried out in companies’ risk management and governance. We have been unable to find positive evidence either for companies which have a risk committee when it comes to performance or bankruptcy risk, even though this has been proposed by Ellul and Yerramilli (2012). This result may mean that having a committee is a necessary condition but not enough on its own to obtain good results. Nor is it significant that the company has a risk map, which is an indicator of the level of sophistication of the risk measurement system. Our result is in agreement with authors who question previous studies for using dichotomous variables that do not really report how the ERM process is implemented in the company and do not allow the degree of implementation and involvement in ERM to be correctly measured (Gatzert & Martin, 2015; Liebenberg & Hoyt, 2003; Pagach & Warr, 2010). On the other hand, there are several papers that use the figure of the Chief Risk Officer (CRO) as a proxy for the implementation of an ERM process, owing to the tendency for companies to communicate such information to the market. Again, in general, the results are not significant for most of the variables, and when they are, in the case of performance, the signs are contrary to those expected. What this shows is that attributing a better risk management system based on the use of dichotomous variables presents serious limitations as a proxy for the level of implementation of the ERM system. We obtain a negative effect for CRO on distance to default, which means that companies that have a CRO have a lower probability of facing financial distress in the near future.
Regarding the effect of hedging on performance and risk, in our work we only obtain positive evidence in favour of hedging exchange risk, where the improvement in profitability is also reflected in a reduction in risk level. Consequently, the hedging of exchange risk seems to complement the approaches of Smith and Stulz (1985) and Magee (2013), who evidence a reduction in financial problems and the creation of value. However, we have also observed that other hedgings are negatively related to performance. This result could be related to the fact that hedging certain scenarios that have not yet materialized has a financial cost that can negatively affect the business. This puts into doubt the guaranteed benefits of hedging a risk bearing in mind that the outcome depends on the context. This is in line with Mello and Parsons (2000) who alert that many common hedging strategies imply a borrowing strategy that undercuts the company’s value and with Ahmed, Azevedo, and Guney (2014) who find that the relationship between interest rate risk hedging and firm financial performance is negative.
Our work reveals the difficulties of analysing the effects of the quality of the ERM system based on the information disclosed by the companies. For this reason, our study reveals the need for listed companies to provide more detailed information on the process, structure, management and risk governance. Only in this way will there be enough information to know how risk management is carried out, where it would be necessary to know how companies identify, measure, organize, control and disseminate the risk management. Nevertheless, the general objective of financial reporting is to provide useful information. Abraham and Shrives (2014); Campbell, Chen, Dhaliwal, Lu, and Steele (2014), among others, state that information on risks is scarce and not useful. Companies reporting should include information about risks but also detailed information on ERM. We believe that in listed companies, the annual report is not enough, because useful information is enhanced if it is timely, which is why we recommend interim reports.
Regarding limitations of the study we must mention that data collection is affected by the different levels of disclosure for risk management among the companies consulted. It is also important to consider that the fact that a company does not mention the presence of a characteristic in its risk management system does not imply the total absence of it; hence there should be better standardization when disseminating data from Spanish listed companies. Differences in implementing Enterprise Risk Management or the time since it has been implemented could also affect our results and conclusions. Lotti (2016) proposes a model for how to analyse the level of ERM maturity, showing the characteristics that a firm should hold to be included in this category. Farrell and Gallagher (2015) have investigated the effect of the maturity of an ERM programme on the value of the company, and their results suggest that organizations that have reached mature levels of ERM exhibit a higher value. Florio and Leoni (2017) state several reasons for the effectiveness of the ERM system (higher resource consumption, etc.) and how they could be related to its maturity. An additional explanation for the results comparing ERM and performance may be linked to the timing of its adoption. Implementing ERM is a difficult process and the complete benefits from ERM adoption are reached after some time (Eckles et al., 2014). Eastman and Xu (2015) provide evidence that the value implication of ERM has changed since the time when rating agencies started declaring their ERM-related rating criteria and firm stakeholders gained greater understanding of ERM. In the case of the results achieved for hedging, we employ its binary measure rather than the common continuous measures for it, such as the magnitude of the hedging and the fraction of sales hedged. Finally, the literature recognizes that the relationship between performance and ERM is dependent on several factors as well such as uncertainty in information concerning risk management systems.
Ministry of Science, Innovation and Universities (MCIU) of Spain, the Spanish State Research Agency (AEI) and European Regional Development Fund (RTI2018-100702-B-I00 MCIU/AEI/FEDER, UE).
Listed companies have been incorporated into the sample, from 133 in 2012 up to 162 in 2015, so our data is an unbalanced panel. Each company has been running for at least three years. We exclude companies in the financial and insurance sector because we focus our study on non-financial enterprises.
Due to the presence of several outliers in our data, we have decided to reject the observations below the 1st percentile and the observations above the 99th percentile.
Variables related to ERM.
We have divided the firms into 10 sectors in accordance with the Spanish National Code of Economic Activities (CNAE 2009). The most relevant group is number 7: Wholesale and Retail; motor vehicle and motorcycle repair (43% of the enterprises). We have used 5 sector dummies for the 5 most representative sectors (Group 2, 3, 5, 7 and 8), while the other dummy has been used for the rest of the sectors.
Given that we have to face a panel with a small period of time, and therefore with a small number of instruments, we include the delays in the levels of the variables as instruments. For this we use the Stata xtabond2 estimator developed by Roodman (2009).
It is also in line with the opinion of Spanish insurance companies’ CROs, who indicate that the main advantage of ERM is operating under controlled levels of risk, and not increasing a company’s value (Durán & Otero, 2020).