


A relatively new computational approach called trial-level bias score (TL-BS) has shown that attentional bias to smoking-related stimuli in smokers fluctuates temporally, trial by trial, during attention tasks. Here, we investigated the reliability of using TL-BS values to assess attentional bias and the electrophysiology mechanisms undergirding fluctuations in attentional bias among smokers.
MethodIn total, 26 male smokers and 26 male non-smokers performed a dot-probe task in Experiment 1. In Experiment 2, an additional 23 male smokers and 23 male non-smokers performed the same task while undergoing single-pulse transcranial magnetic stimulation, which was used to investigate corticospinal excitability.
ResultsIt showed that assessing TL-BS parameters for reaction time (RT) was more reliable than calculating the traditional mean attentional bias score; however, this superior reliability was no longer apparent after controlling for general RT variability. There was a significant difference between smokers and non-smokers in TL-BS parameters calculated for both RT and motor-evoked potential (MEP) amplitude. However, TL-BS parameters for RT and MEP amplitude were strongly correlated with general RT variability and general MEP variability, respectively.
ConclusionsOur findings indicated that TL-BS parameters may not be ideal for measuring attentional bias at either the behavioral or electrophysiology level; however, larger general RT and MEP amplitude variabilities in non-smokers may indicate dysregulation of cognitive processing in smokers.
Attentional bias is defined as the propensity of a person to allocate selective attention automatically to salient cues (Wilcockson et al., 2021). A substantial body of evidence suggests that the attention of smokers is preferentially captured by smoking-related stimuli, such as cigarette packs, lighters, and smoking-related images and videos (Fitzpatrick et al., 2022). This attentional bias toward smoking-related stimuli plays a significant role in maintaining smoking behavior and increasing vulnerability to relapse (Creswell & Skrzynski, 2021). The psychological processes underlying smoking-related attentional bias have been extensively studied with the visual dot-probe task. I In this task, participants responded as quickly as possible to a probe stimulus, which appeared immediately after the display of a pair of images (e.g., a smoking-related image and a neutral image) (MacLeod et al., 1986; Robinson et al., 2022). To assess attentional bias, a traditional mean bias score (MBS) is calculated by subtracting the reaction time (RT) of congruent trials (i.e., trials in which the probe replaced a target cue) from incongruent trials (i.e., the probe replaced the neutral cue) (Ataya et al., 2012; Schmukle, 2005). However, the traditional MBS shows poor split-half and test-retest reliabilities and assumes that attentional bias is consistent with a static trait-like signal over time (Carlson & Fang, 2020; Gade et al., 2022; Zvielli et al., 2015).
The trial-level bias score (TL-BS) is a newer computational method with higher internal and test-retest reliabilities than traditional MBS, and importantly, it reflects trial-by-trial temporal fluctuations and variability in attentional allocation (Zvielli et al., 2015). Previous studies have found that smokers show phasic bursts of differential attention allocation toward a smoking-related stimulus over time with fluctuating temporal variability and that the TL-BS is a significantly better predictor of several indicators of psychopathology, suggesting that TL-BS, as compared with MBS, is a more reliable measure of attentional bias (Yang et al., 2022; Zvielli et al., 2015). The validity of the TL-BS metrics has been challenged as these markers are not able to separate attentional bias from general attention control stability. Specifically, evidence has shown that general RT variability can influence measures of attentional bias variability (Kruijt et al., 2016; Swick & Ashley, 2017). Further evidence suggests that attentional bias variability is not a valid measure of attention-related behavior but reflective of general RT variability more broadly (Carlson et al., 2022; Carlson & Fang, 2020). However, the reliability of TL-BS as an index of attentional bias in a smoker population is unexplored.
Both the traditional MBS and TL-BS calculations are based on reaction time, which reflects the time it takes from the appearance of a sensory cue to the preparation of the desired movement by sensory and motor processes, with the underlying neural processes unclear (Salinas et al., 2014; Wong et al., 2015). An attentional bias may influence the mapping of sensory inputs to motor outputs (Deco & Rolls, 2005). An alternative method to probe the underlying neural processes driving attention is transcranial magnetic stimulation (TMS) interrogation of primary motor cortex (M1) to probe cortical excitability (Derosiere et al., 2020; Pedapati et al., 2019). Corticospinal excitability, indexed by motor-evoked potential (MEP) amplitudes, is a widely used physiological marker to investigate the physiological mechanisms associated with various cognitive processes, such as motor inhibition, approaching-avoiding bias, and attention (Bhattacharjee et al., 2021; Duque et al., 2017; Xia et al., 2021, 2023). In particular, motor cortex facilitation has been found to be associated with inattention and executive function and is considered a marker of the occurrence of attention-deficit/hyperactivity disorder (ADHD) in persons with autism spectrum disorder (Pedapati et al., 2019).
TMS has been used in the study of smoking. Application of TMS over the region of the motor cortex associated with tongue activity while smokers are passively exposed to smoking-related images increases tongue muscle MEP amplitudes compared with exposure to control images, suggesting that corticobulbar excitability may be a neural marker linking neural processes related to nicotine intake with motor output (Vicario et al., 2014). In contrast to corticobulbar excitability, corticospinal excitability in the region of the motor cortex associated with the hand muscle is directly involved in the execution of smoking-related actions and may thus directly reveal electrophysiological characteristics during the action preparation stage (Song et al., 2023). Assessing changes in corticospinal excitability in the motor cortex region associated with the hand muscle, would enable investigation of how attentional bias affects the motor system, informing a deeper understanding of the formation of smoking behavior.
Hence, the present study first aimed to evaluate the reliability of using TL-BS to assess attentional bias in a smoker population and further aimed to investigate the electrophysiologic mechanisms underlying fluctuations in attentional bias. To that end we first conducted Experiment 1, in which both smokers and non-smokers were asked to perform the visual dot-probe task to address whether TL-BS parameters could differentiate attentional bias in smokers from non-smokers or whether the TL-BS was driven by general RT variability. Based on the results of previous study (Yang et al., 2022), we hypothesized that TL-BS would effectively differentiate smokers from non-smokers, with higher fluctuations in smokers, but that the TL-BS parameters would no longer be a reliable index after controlling for general RT variability (Carlson et al., 2022; Carlson & Fang, 2020). In Experiment 2, single-pulse TMS was applied over the left M1 in both smokers and non-smokers to address our second aim, to assess M1 dynamic changes, specifically, fluctuations in the excitability of M1, during the visual dot-probe task. Since previous studies have found that smokers can be characterized by the hyperexcitability of corticospinal output, which may be a secondary adaptation to long-term nicotine use (Grundey et al., 2013; Khedr et al., 2020), we hypothesized that smokers would also show higher fluctuations in motor cortex excitability during the dot-probe task.
Methods and materialsParticipantsA total of 52 male students (26 smokers: age = 20.5, range 18–24 years; 26 non-smokers: age = 21.2, range 18–26 years) participated in Experiment 1 and another 46 male students (23 smokers: age = 20.6 ± 1.6, range 18–24 years; 23 non-smokers: age = 21.3 ± 2.3, range 19–26 years) participated Experiment 2. Due to the small number of female students who smoked, the current study included only male students to avoid confounding by gender (Zhou et al., 2016). All participants were right-handed, with normal or corrected-to-normal vision, and were recruited from the Shanghai University of Sport. The inclusion criteria for smokers were (1) being nicotine-dependent as defined by the Diagnostic and Statistical Manual of Mental Disorders, Fifth Edition (American Psychiatric Association, 2013); (2) having smoked for at least 2 years (group average: 36.4 months, range: 24-72) and smoking ≥10 cigarettes per day during the previous month (group average: 13.2 cigarettes/day, range: 10-25); and (3) not reducing the number of cigarettes by more than half in the last 3 months. The inclusion criterion for non-smokers was that they had never smoked. All participants reported no history of psychiatric or neurological disorders. Written informed consent was obtained from all participants, and the protocol was approved by the Ethics Committee at the Shanghai University of Sport in accordance with the Declaration of Helsinki.
Experimental designThe smokers maintained their daily smoking habit but did not smoke within 1.5 hours before the experiment. Before performing the experimental task, all participants reported basic demographic information, and the smokers completed the Fagerström Test for Nicotine Dependence (FTND) scale and the 10-item Questionnaire of Smoking Urges (QSU-brief). Afterward, all participants received online single-pulse TMS as they performed the dot-probe task. Experiments with smokers began no less than 90 min after smoking cessation but no more than 120 min after their last cigarette to minimize acute nicotine effects immediately after consumption as well as withdrawal effects (Lang et al., 2008; Lavender et al., 2019).
Self-reported measuresThe FTND is a validated standardized assessment used to assess the intensity of physical addiction to nicotine (Heatherton et al., 1991). Item scores were summed to yield a total score of 0-10, with higher total scores indicating more intense physical dependence on nicotine. The QSU-Brief consisted of 10 statements about the smoker's feelings and thoughts about the desire to smoke cigarettes while completing the questionnaire (i.e., right now). The higher the total score, the higher the smoker's craving for cigarettes.
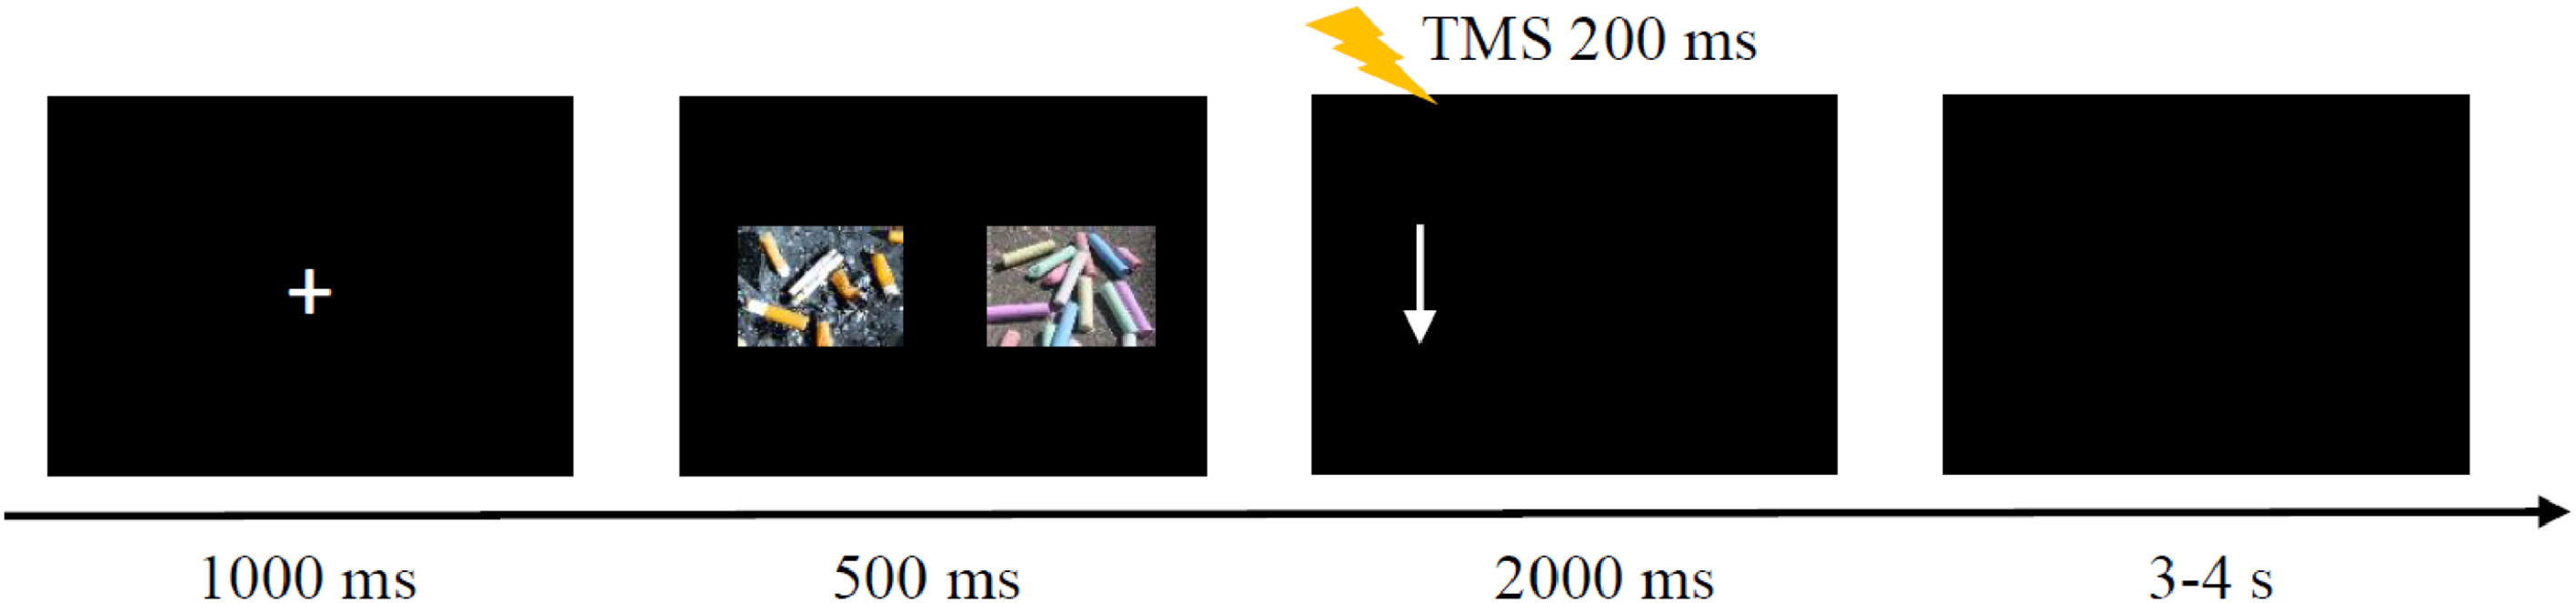
Dot-probe taskThe procedure was programmed using MATLAB software to control the dot-probe task and to trigger TMS (Fig. 1). Stimuli were presented on a 21.5-inch monitor, at a screen resolution of 1920 × 1080 pixels. The distance between a participant's forehead and the screen was 60 cm. At the beginning of each trial, a fixation cross was presented at the center of the screen for 1000 ms, followed by two images with a size of 7.4 × 5.3 cm presented simultaneously, one on the left side of the screen and the other on the right side. Images were separated by 14.7 cm. After 500 ms, an arrow pointing up or down appeared on either the left or right side of the screen. The arrow disappeared after the participant made a key press, or it remained on the screen for a maximum of 2000 ms. When the arrow pointed up, the participant pressed the “up arrow” key on the keyboard with the right index finger. The “down arrow” key on the keyboard was pressed when the arrow pointed down. The right index finger rested on the “5” key between arrow presses to ensure the same distance to each key press. After the arrow disappeared, a blank screen lasted for 3-4 s to ensure an interpulse interval greater than 5 s to avoid changes in motor excitability due to TMS per se.

There were three trial conditions: 1) congruent trial: the arrow appeared on the same side as the smoking-related image for a pair of images consisting of a smoking-related image and a neutral image; 2) incongruent trial: the arrow appeared on the same side as the neutral image for a pair with a smoking-related and neutral image; 3) neutral trial: for a pair of neutral images, only the direction in which the arrow pointed was considered, not its location relevant to the images. Each condition contained 80 trials and appeared randomly. The task comprised 240 trials in total and was split into three blocks of 80 trials, divided by brief breaks.
MaterialsThe smoking-related and neutral images were selected from the Pictures Library of Smoking Cravings (Gu et al., 2021) and the International Affective Picture System (Lang et al., 1997). Ten smokers and 13 non-smokers were invited to rate the extent to which these images correlated with cigarette or smoking behavior using a 9-point score, with lower scores indicating lower relevance. Finally, 20 smoking-related images (M = 8.75, SD = 0.39) and 40 neutral images (M = 1.43, SD = 0.48) were chosen to form 20 pairs containing a smoking-related and neutral image, and 10 pairs containing both neutral images. In total, 30 image pairs randomly appeared eight times in each cell of the 2 × 2 × 2 trials (image location [left vs. right] × arrow location [left vs. right] × arrow direction [up vs. down]) in each block.
TMS protocolA figure-eight coil (70 mm, D70 Alpha Flat Coil, Magstim) was connected to a Magstim 200 stimulator (Whitland, Dyfed, U.K.). The coil was placed over the left M1 with the handle of the coil pointed backward at 30°–45° to the mid-sagittal line to induce a posterior-anterior directed current. The M1 stimulation hotspot was defined as the location where a given suprathreshold stimulation produced the largest MEP amplitude in the target muscle. The stimulation intensity was set as 120% of the resting motor threshold, which was defined as the minimum intensity required to evoke MEP amplitudes over 50 μV in the relaxed right first dorsal interosseous muscle in at least 5 of 10 consecutive trials. The TMS pulse was applied 200 ms after the arrow appeared for two reasons. First, once the arrow appeared, the participant started to press the button according to the instructions. Hence, this period could be considered as movement preparation. Second, since RTs were longer than 600 ms, the delivery of TMS at 200 ms enabled the tracking of dynamic changes in corticospinal excitability during the behavioral task without contamination by actual movements (Song et al., 2023). Because the TMS pulse could trigger movement of the right index finger and affect the response time, half the trials were performed with TMS and the remaining half were not. There were 40 trials for each trial type (congruent, incongruent, and neutral) for both the TMS and no-TMS conditions; thus, there was a total of 240 trials, in three blocks. In addition, ten trials were collected at rest with a TMS intensity of 120% RMT before the task and served as baseline.
Electromyographic (EMG) recordingThe EMG was recorded with disposable surface electrodes placed over the right first dorsal interosseous muscle in a tendon-belly arrangement. The EMG signal was amplified (×1000, Intronix Technologies Corporation Model 2024F, Bolton, Ontario, Canada), filtered (bandpass 20 Hz–2.5 kHz), and digitally sampled at 5 kHz (Micro1401, Cambridge Electronics Design, Cambridge, UK) for off-line analysis.
Data analysisBehavioral data were collected using MATLAB software. For trials conducted without TMS, only behavioral data were collected; for the remaining trials conducted with TMS, both behavioral and MEP amplitude data were collected. Trials were included for further analysis if they met the following criteria: (1) correct response, (2) RT longer than 200 ms and shorter than 1500 ms, and (3) RT within ± 3 SDs of the mean (Yang et al., 2022). The mean percentage of trials removed for statistical analyses was 3.32% in Experiment 1. The traditional MBS was calculated by subtracting the mean RT across congruent trials (i.e., arrows pointed up for smoking-related images) from mean RT across incongruent trials (i.e., arrows pointed up for neutral images). The TL-BS contains five parameters categorized into three domains and was computed by subtracting temporally adjacent pairs of congruent and incongruent trial RTs (i.e., no further than five trials away), which was computed by utilizing the R package, consistent with the method used by Zvielli et al. (2015). An attentional bias toward smoking-related cues was defined as 1) Meantoward (the average degree of TL-BS > 0), and 2) Peaktoward (the maximum degree of TL-BS > 0). Attentional bias away from smoking-related cues was defined as 1) Meanaway (the average degree of TL-BS < 0), and 2) Peakaway (the maximum degree of TL-BS < 0). The stability of the attentional bias, called TL-BS variability, was the mean of the absolute value of the sequential differences in TL-BS and indicated the temporal stability of attentional bias toward or away from smoking-related cues over time. The standard deviation (SD) of the RT (for congruent and incongruent trials) was calculated as the index of general RT variability (Carlson et al., 2022). First, split-half reliability was computed for TL-BS parameters, with Pearson correlations conducted between the first half of the task and the second half. To control for the effect of general response variability on the results, Pearson correlations was conducted again after controlling for general RT variability. Secondly, a two-way ANOVA with group (smoker vs. non-smoker) as a between-subject factor, and trial type (congruent, incongruent, and neutral) as within-subject factors to investigate the RT difference. Greenhouse-Geisser's method was used for violation of sphericity. Paired sample or independent sample t-tests with Bonferroni corrections for multiple comparisons were used for post-hoc analysis among different factors. Independent-samples t-tests were conducted separately for the traditional MBS, each TL-BS parameter, as well as general RT variability to compare the differences between smokers and non-smokers. Pearson correlations were conducted between general RT variability and each attentional bias index. Given the criticisms of traditional null hypothesis significance testing analyses, especially concerning non-significant results, we also conducted Bayesian analysis for all statistical outcomes to evaluate the degree of evidence for the null vs. alternative hypothesis (Hu et al., 2018; Vandekerckhove et al., 2018). Bayes factor values close to 0 indicated evidence for the null hypothesis, values substantially higher than 1 (e.g., > 3) indicated evidence in favor of the alternative hypothesis, and values around 1 reflected inconclusive evidence for either hypothesis. Thirdly, Pearson correlations were also analyzed between the behavioral data and self-reported questionnaires with or without controlling for the general MEP variability.
For the MEP amplitude data collected for trials conducted with TMS in Experiment 2, the peak-to-peak MEP amplitudes were extracted through a custom script in SIGNAL 6.0, and the MEP amplitude for each trial were expressed as a ratio of the mean peak-to-peak MEP amplitude at baseline (condition/baseline × 100%). Trials were included for further analysis if the response was correct and if the root mean square of background EMG activity 100 ms before the onset of the TMS pulse was outside ± 2 SDs of the mean root mean square EMG for each block (Xia et al., 2021). The mean percentage of trials removed for MEP amplitude data analysis was 4.37%. The statistical analysis was conducted as in Experiment 1, except that we were unable to compute split-half reliability due to the limited number of trials. Two-sided values of p < 0.05 were considered statistically significant. Data are shown as mean ± SD. The analysis was not pre-registered, and the results should be considered exploratory.
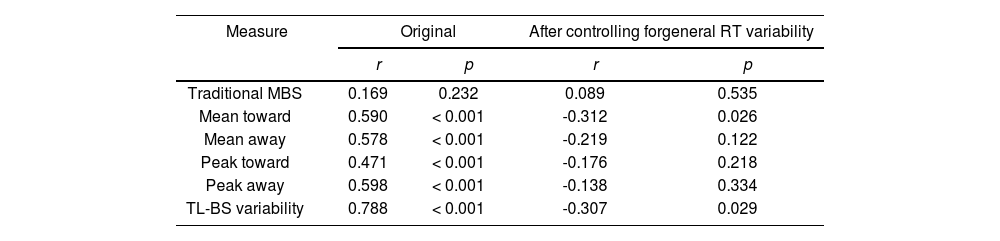
ResultsExperiment 1Reliability of attentional bias measuresTL-BS parameters but not traditional MBS were moderately to highly positively correlated for the first vs. the second half of the task (range r = 0.471 to 0.788, p < 0.001). However, in partial correlations controlling for general RT variability, these positive correlations were no longer significant or became negative (see Table 1).
Pearson correlations of attentional bias scores between the two halves of the task.
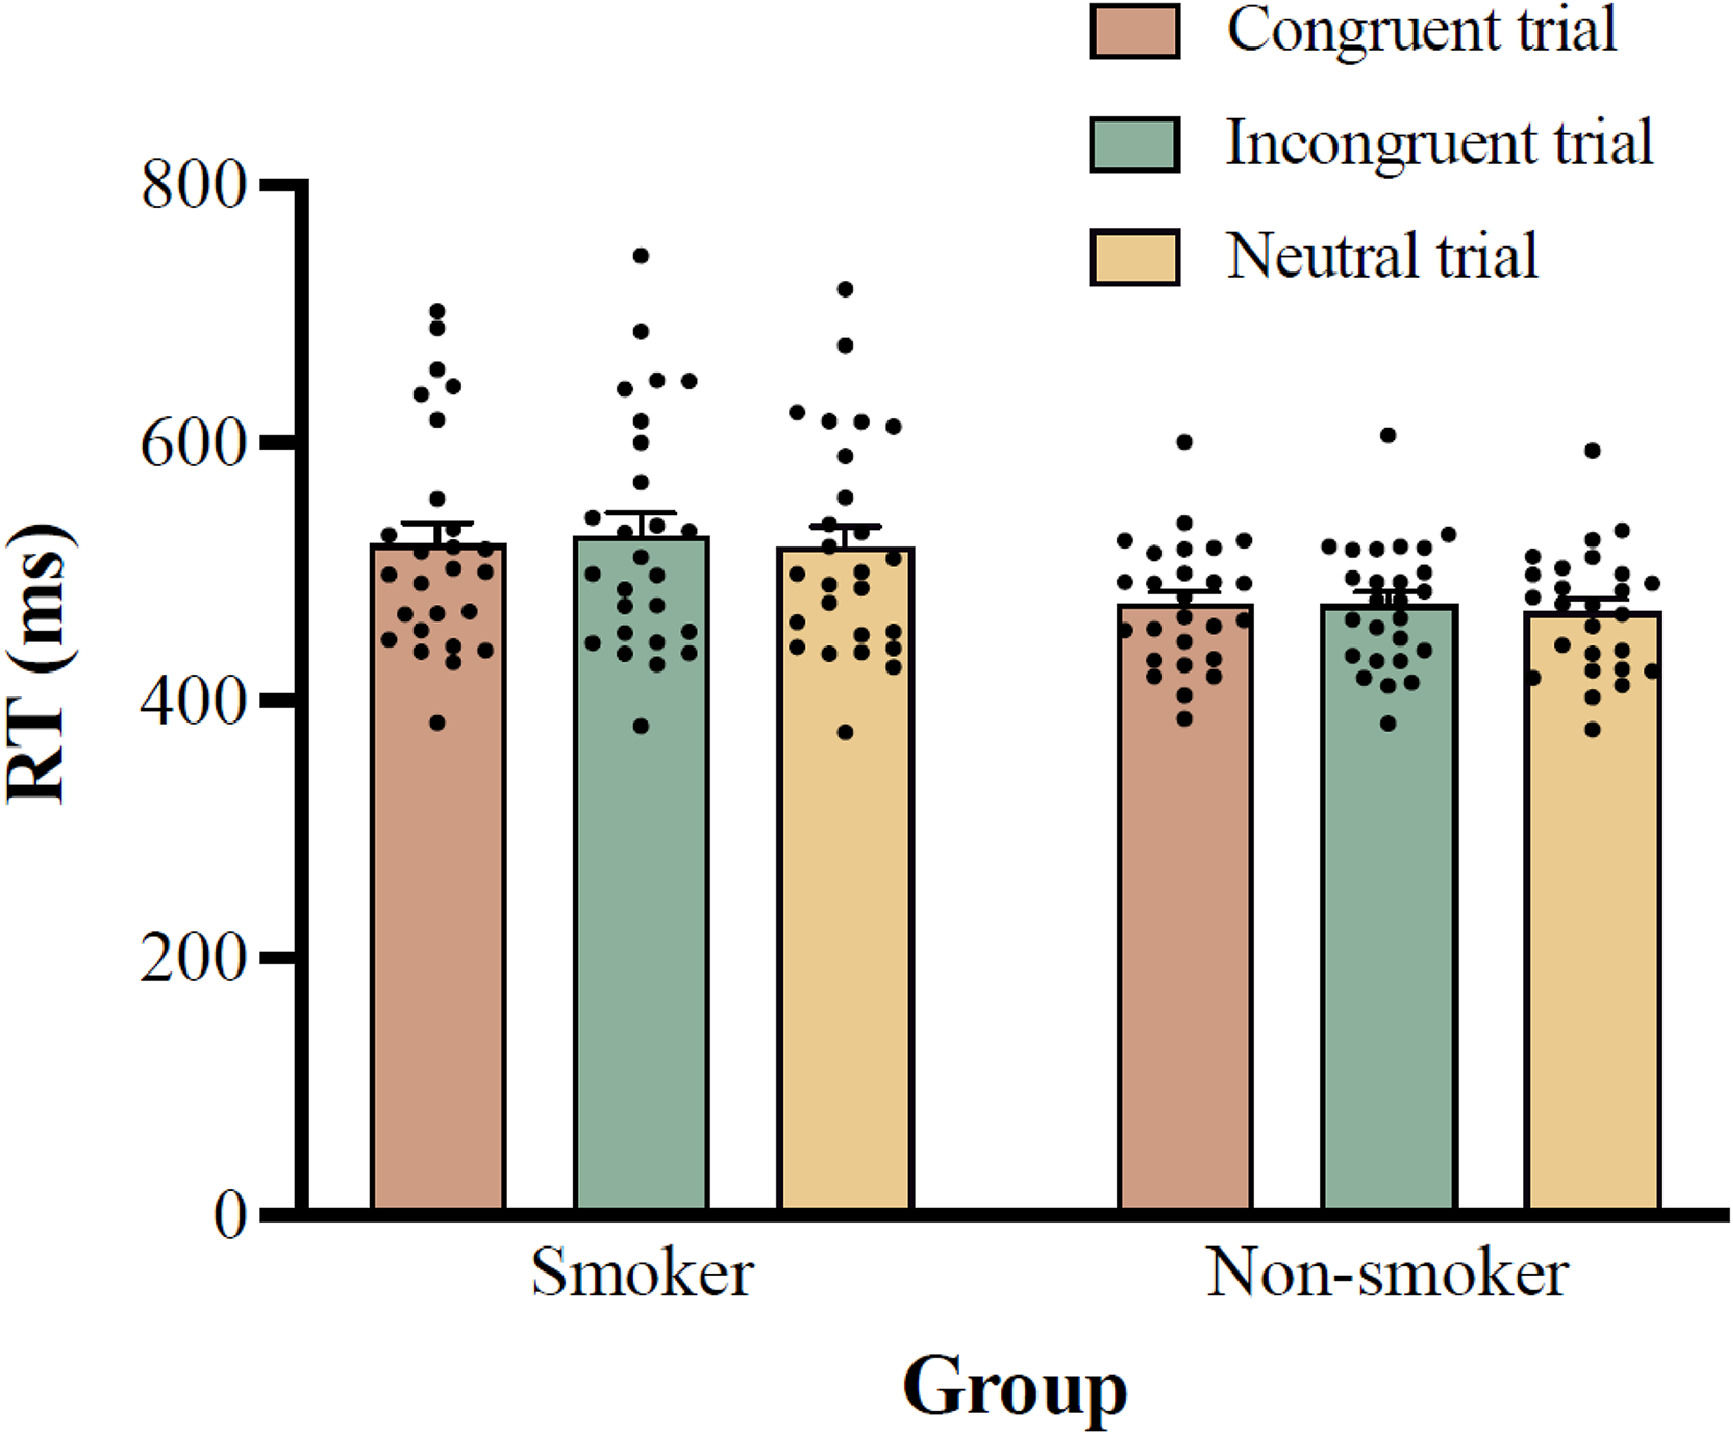
Two-way ANOVA results for RT showed a significant main effect of group, F (1, 50) = 6.403, p = 0.015, ηp2 = 0.114, with post-hoc analysis showing that the RT for the smoker group (522.1 ± 87.6 ms) was significantly longer than that for the non-smoker group (472.5 ± 48.3 ms; 95% CI =10.2–89.1 ms). The main effect of trial type was also significant, F (1.778, 88.922) = 9.588, p < 0.001, ηp2 = 0.161, with post-hoc analysis indicating that the RTs for the incongruent trials (500.8 ± 56.6 ms) were significantly longer than those for the neutral trials (493.5 ± 54.3 ms; 95% CI = 4.0–10.6 ms; p < 0.001), but not for the congruent trials (497.6 ± 54.7 ms; 95% CI = -1.3–7.6 ms; p = 0.260). The interaction between group and trial type was not significant, F (2, 100) = 1.972, p = 0.145, ηp2 = 0.038, see Fig. 2.
.")
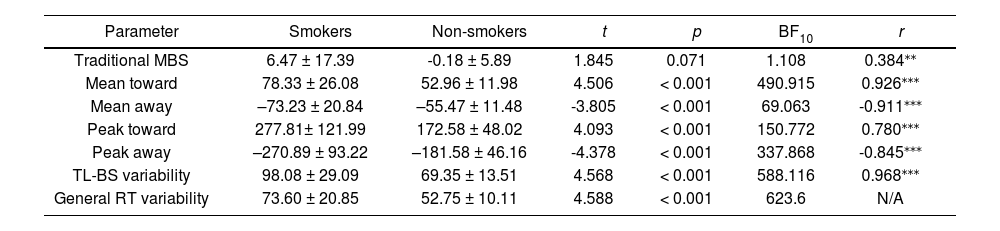
Independent-samples t-tests showed a significant difference in the behavioral performances between the smoker and non-smoker groups for each TL-BS parameter and general RT variability but not for the traditional MBS (Table 2). Follow-up Bayesian analyses provided strong evidence for the alternative hypothesis for all TL-BS parameters—but not for traditional MBS values—indicating a significant difference between the two groups (Table 2). In addition, both traditional MBS and TL-BS parameters were strongly correlated with general RT variability.
Descriptive statistics of behavioral features in smokers and non-smokers.
| Parameter | Smokers | Non-smokers | t | p | BF10 | r |
|---|---|---|---|---|---|---|
| Traditional MBS | 6.47 ± 17.39 | -0.18 ± 5.89 | 1.845 | 0.071 | 1.108 | 0.384⁎⁎ |
| Mean toward | 78.33 ± 26.08 | 52.96 ± 11.98 | 4.506 | < 0.001 | 490.915 | 0.926⁎⁎⁎ |
| Mean away | –73.23 ± 20.84 | –55.47 ± 11.48 | -3.805 | < 0.001 | 69.063 | -0.911⁎⁎⁎ |
| Peak toward | 277.81± 121.99 | 172.58 ± 48.02 | 4.093 | < 0.001 | 150.772 | 0.780⁎⁎⁎ |
| Peak away | –270.89 ± 93.22 | –181.58 ± 46.16 | -4.378 | < 0.001 | 337.868 | -0.845⁎⁎⁎ |
| TL-BS variability | 98.08 ± 29.09 | 69.35 ± 13.51 | 4.568 | < 0.001 | 588.116 | 0.968⁎⁎⁎ |
| General RT variability | 73.60 ± 20.85 | 52.75 ± 10.11 | 4.588 | < 0.001 | 623.6 | N/A |
Note:
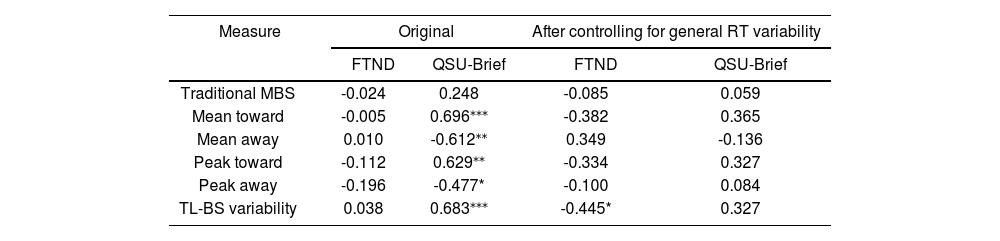
For the FTND, the mean score for the smoker group was 2.35 (range, 1–4) points, and for the QSU-Brief, the mean score for the smoker group was 42.81 (range, 26–62) points. Pearson correlation analyses between the behavioral features and FTND scores in the smoker group showed no significant correlation. The QSU-Brief score was significantly correlated with all TL-BS parameters. However, after controlling for general RT variability, these correlations disappeared. Table 3 shows the original results as well as the results after controlling for general RT variability.
Pearson correlations between behavioral features and scores on self-reported measures in smokers.
| Measure | Original | After controlling for general RT variability | ||
|---|---|---|---|---|
| FTND | QSU-Brief | FTND | QSU-Brief | |
| Traditional MBS | -0.024 | 0.248 | -0.085 | 0.059 |
| Mean toward | -0.005 | 0.696⁎⁎⁎ | -0.382 | 0.365 |
| Mean away | 0.010 | -0.612⁎⁎ | 0.349 | -0.136 |
| Peak toward | -0.112 | 0.629⁎⁎ | -0.334 | 0.327 |
| Peak away | -0.196 | -0.477* | -0.100 | 0.084 |
| TL-BS variability | 0.038 | 0.683⁎⁎⁎ | -0.445* | 0.327 |
Note: * p < 0.05,
Behavioral data were analyzed the same as for Experiment 1, and the results were similar to those observed for Experiment 1 (see supplementary materials). Here, we report only the electrophysiological results.
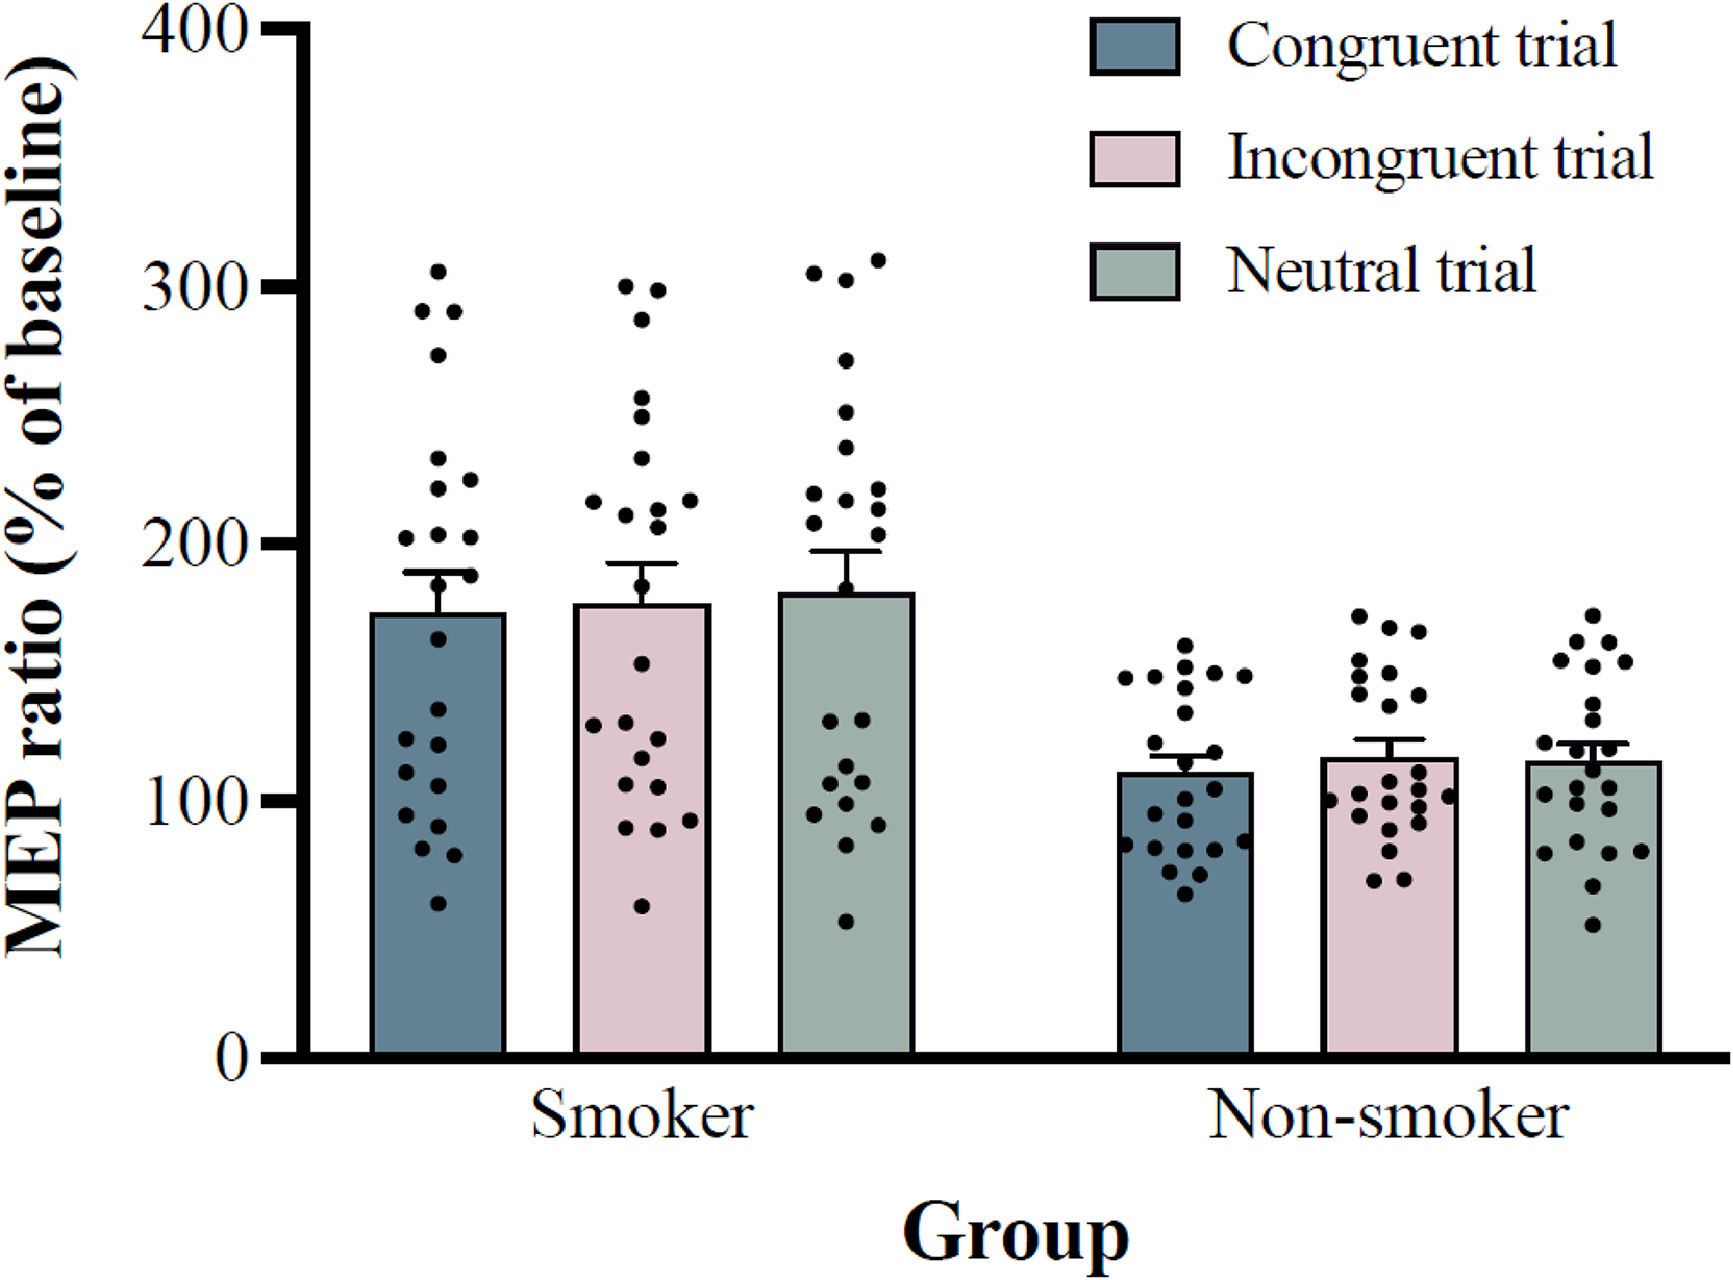
Electrophysiological featuresThe mean stimulator intensity for single-pulse TMS was 46.91 ± 1.64% of the maximum stimulator output for the smoker group and 44.52 ± 1.30% for the non-smoker group. The baseline MEP amplitude was 0.87 mV for smoker group and 0.92 mV for non-smoker group. Two-way ANOVA results for MEP ratios showed a significant main effect of group, F (1, 44) = 13.337, p = 0.001, ηp2 = 0.233, with post-hoc analysis showed that MEP ratios of smoke group (176.9 ± 75.7%) was significantly higher than non-smoker group (114.5 ± 31.2%; 95% CI = 27.9–96.7). The main effect of trial type was also significant, F (2, 88) = 3.606; p = 0.031; ηp2 = 0.076, with post-hoc analysis showed that MEP ratios of congruent trial (142.2 ± 41.9%) were significantly lower than neutral trials (147.9 ± 42.4%; 95% CI = -11.4–-0.1; p = 0.046), but not incongruent trial (147.0 ± 40.5%; 95% CI = -10.8–1.1; p = 0.140). The interaction between group and trial type was not significant, F (2, 88) = 0.739, p = 0.481, ηp2 = 0.017, see Fig. 3.
.")
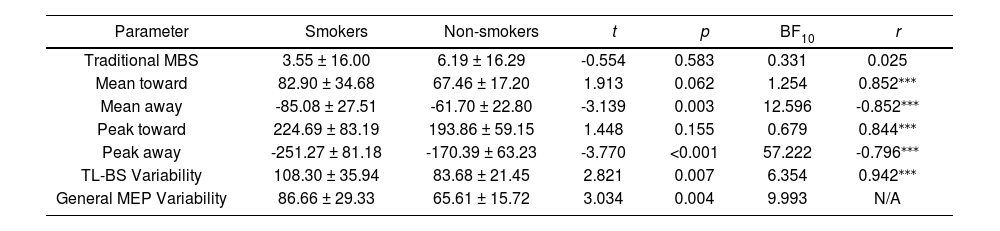
The traditional MBS, TL-BS and General MEP Variability are shown in the Table 4. Independent samples t-tests showed a significant difference in Meanaway, Peakaway, TL-BS variability, as well as general MEP Variability between the smoker and non-smoker groups, but not in any other parameter, and follow-up Bayesian analyses of all TL-BS parameters confirmed the significant differences in these parameters. Pearson correlations shows all TL-BS parameters were strongly correlated with general MEP variability.
Descriptive statistics of electrophysiological features in smokers and non-smokers.
| Parameter | Smokers | Non-smokers | t | p | BF10 | r |
|---|---|---|---|---|---|---|
| Traditional MBS | 3.55 ± 16.00 | 6.19 ± 16.29 | -0.554 | 0.583 | 0.331 | 0.025 |
| Mean toward | 82.90 ± 34.68 | 67.46 ± 17.20 | 1.913 | 0.062 | 1.254 | 0.852⁎⁎⁎ |
| Mean away | -85.08 ± 27.51 | -61.70 ± 22.80 | -3.139 | 0.003 | 12.596 | -0.852⁎⁎⁎ |
| Peak toward | 224.69 ± 83.19 | 193.86 ± 59.15 | 1.448 | 0.155 | 0.679 | 0.844⁎⁎⁎ |
| Peak away | -251.27 ± 81.18 | -170.39 ± 63.23 | -3.770 | <0.001 | 57.222 | -0.796⁎⁎⁎ |
| TL-BS Variability | 108.30 ± 35.94 | 83.68 ± 21.45 | 2.821 | 0.007 | 6.354 | 0.942⁎⁎⁎ |
| General MEP Variability | 86.66 ± 29.33 | 65.61 ± 15.72 | 3.034 | 0.004 | 9.993 | N/A |
Note: ** p < 0.01,
For the FTND, the average score for the smoker group was 3.04 points, with a range of 1–7 points, and for the QSU-Brief, the average score for the smoker group was 50.26 points, with a range of 33–70 points. The results of a Pearson correlation analysis between the electrophysiological features and the scores on the self-reported questionnaires among smokers showed no significant correlation with or without controlling for the general MEP variability (ps > 0.05).
DiscussionIn the present study, we assessed the behavioral performance and corticospinal excitability of M1 during the dot-probe task in both smokers and non-smokers. Our findings showed that all TL-BS parameters for RT data significantly distinguished smokers and non-smokers and that TL-BS values were more reliable than traditional MBS. However, after controlling for general RT variability, the TL-BS parameters were no longer more reliable. Although Meanaway, Peakaway, and TL-BS variability in MEP amplitude data also distinguished smokers and non-smokers, these indices may also be influence by general MEP variability. Interestingly, we detected larger RTs and MEP amplitudes as well as larger general RT variability and general MEP variability in smokers compared with non-smokers.
Numerous studies have found significant differences in traditional MBS values between smokers and non-smokers for smoking-related stimuli (MacLean et al., 2020; Robinson et al., 2022). However, this difference was not detected in the present study or in at least one previous study (Spiegelhalder et al., 2011). Such mixed results may be explained in part by the relatively recent understanding that attentional bias is not static (Carlson & Fang, 2020). Using the TL-BS method, which reflects the temporal dynamics of attention allocation from trial to trial (Zvielli et al., 2015), the present study found that smokers have a greater bias toward or away from smoking-related stimuli, as well as larger fluctuations between attention toward and away from smoking-related stimuli. However, these differences may be accounted for by general RT variability, which was also larger in smokers than non-smokers. We replicated the previous finding that after controlling for general RT variability, the TL-BS parameters were no longer reliable, suggesting that the increased reliability of the TL-BS measure is driven, at least in part, by the consistency of RT variability (Carlson & Fang, 2020). In addition, the present study applied the TL-BS calculation to electrophysiological data of neural signals relayed from higher brain areas to locomotor muscles, which may offer a target for developing a reliable biomarker of addiction (Song et al., 2023). In the MEP amplitude data, no significant difference was found between smokers and non-smokers for traditional MBS values. By contrast, there was a significant difference in these data for Meanaway, Peakaway parameters and TL-BS variability. Given the limited trial numbers of Experiment 2, we were unable to calculate the split-half reliability for the MEP amplitude data. However, based on the results from Experiment 1, it is not unreasonable to suggest that the difference between the TL-BS parameters for the MEP amplitude data may also be driven in part by general MEP variability since this was strongly correlated with TL-BS parameters and was also larger in the smoker group compared with non-smoker group and. Hence, our study findings support the idea that TL-BS parameters may not be ideal for empirical purposes as the attentional bias variability may reflect general variability more broadly (Carlson et al., 2022; Carlson & Fang, 2020; Kruijt et al., 2016; Swick & Ashley, 2017).
The results of the present study indicated that smokers showed larger RTs and larger MEP amplitudes than non-smokers. RT to an imperative stimulus increased with the number of movement components, and the longer RTs were considered a complexity effect related to the increased amount of time required to program and retrieve a motor response from memory (Henry & Rogers, 1960). Longer RTs may indicate delayed initiation of underlying physiological processes, with delayed activation being reported in a widely distributed set of gray and white matter regions on trials with long RTs relative to short RTs (Yarkoni et al., 2009). Here, we provided direct evidence of the physiological processes, with larger RTs accompanied by larger MEP amplitudes. The size of the MEP amplitude is sensitive to cognitive processes (Hadar et al., 2016), and M1 has also been found to be differentially activated when attention is directed toward an action compared with when it is not (Bhattacharjee et al., 2021). Hence, greater cognitive processing in the preparation of complex movements could contribute to an increase in corticospinal excitability in smokers (Kennefick et al., 2019).
General RT variability and general MEP variability were also larger in smokers compared with non-smokers. RT variability represents a general marker of maladaptation (Bastiaansen et al., 2015) and may provide information about attention abilities beyond accuracy and mean RT (Privodnova et al., 2020). General RT variability is associated with cognitive processes, as shown by RT variability reliably modulating the BOLD signal not only in gray matter but also in diffuse regions of white matter, which may indicate that natural fluctuations in cognitive effort or preparation levels should produce trial-by-trial differences in RT (Yarkoni et al., 2009). Smoking-related stimuli may capture attention through the activation of both cortico-limbic appetitive and defensive systems. Appetitive systems may preferentially allocate attention toward such stimuli since these cues have been imbued with incentive salience through years of repeated associations with the consumption of nicotine; whereas in the defensive system, the idea that smoking is unhealthy may also capture attention, allocating attention to keep away from such stimuli (Deweese et al., 2018; Robinson et al., 2015; Robinson & Berridge, 1993; Wilcockson et al., 2021). Hence, the larger general RT variability in smokers may be caused by fluctuations in appetitive and defensive system processing. Compared with that in healthy controls, larger MEP amplitude variability has also been detected in persons with ADHD—who are characterized by attentional problems—and may hint at neurophysiological mechanisms underlying ADHD symptomatology (Richter et al., 2007). Hence, larger general MEP variability may reflect a dysregulation of attention allocation in smokers.
ConclusionIn conclusion, this study showed that TL-BS parameters utilizing both RT and MEP amplitude data effectively differentiated the smoker group from the non-smoker group; however, general RT variability and general MEP variability also differentiated the groups. Thus, the TL-BS parameters may not be ideal for empirical purposes, as attentional bias variability may more broadly reflect general variability. Nevertheless, higher general RT variability and general MEP variability may indicate dysregulation of attention allocation in smokers.
FundingThis work was supported by National Natural Science Foundation of China (No. 32300921), Taishan Scholars Program for Young Experts of Shandong Province, project 23-2-1-32-zyyd-jch supported by Qingdao Natural Science Foundation and a research grant from Macao Polytechnic University (RP/FCSD-04/2022).
Role of the funderThe funders had no role in the study design; in the collection, analysis and interpretation of data; in the writing of the manuscript; and in the decision to submit the article for publication.
