


The performance of firms involved in projects from 2 UK research councils was investigated; firms in Innovate UK projects receive co-funding while firms in Arts & Humanities Research Council (AHRC) projects do not. Firms in 266 projects 2009–2012 were tracked for Standard Industrial Code (SIC), location and year-on-year financial performance 2012–22. The results show that firms (un- and co-funded) were mainly not local to universities. The growth performance of non-funded firms was steady in the majority of SIC codes, but some SIC codes performed very well, while for co-funded firms, many SICs performed under control but losses were made up for on average by exceptionally high performance in other SIC codes. Overall, non-funded firms achieved average growth of ∼29 % above control while co-funded firms only achieved an average growth of ∼18 % above control. Firms (both co- and un-funded) associated with 21 universities perform consistently well, while other firms (co- and un-funded) associated with 24 other universities perform consistently poorly. This difference in performance was better correlated to degree of business ambidexterity in the tech transfer function, rather than with university reputation.
Nobel laureate Paul Romer (Nobelprize.org, 2018) suggested that market economies alone generate insufficient numbers of new high-tech innovations to support national competitiveness, and therefore that ‘well-designed government actions’ are required, an intensive debate has taken place around if state subsidies are effective in entrepreneurship and in regional development, and if so, under what circumstances. While many authors refer to ‘knowledge spillovers’ from innovation-producers to innovation users, who in turn intend to apply this knowledge to entrepreneurial and commercial ends, the innovation pathway taken is anastomose and some parts are relatively poorly characterized. For example, Roper et al. (2022) emphasised that firms seeking innovation may differ in knowledge-acquiring approaches to those seeking imitation benefits. This highlights the role of the academic knowledge source and should ideally take into account the knowledge-acquiring status of the recipient (see Zieba, 2021) as well as the degree of novelty involved (Seidle, 2024).
For robust and general overviews of the background around state-supported R&D projects, the reader is referred to the works of Becker and co-workers (Becker, 2015; Vanino et al., 2019; Becker et al., 2023).
This contribution builds on previous work and the narrow debate investigated here concerns on one hand Will and Mellor (2019), who used very large datasets from the Czech Republic, Germany, Hungary, Poland, Romania and the Slovak Republic and found that overall, state “cash” subsidies do not have any significant effect on the financial performance of recipient firms, whether that support is received through research councils or by direct funding programmes. Conversely, in a large meta-review, Zuniga-Vicente et al. (2014) investigated studies from USA and other developed countries including Austria, Belgium, China, Denmark, Finland, France, Germany, Ireland, Israel, Japan, the Netherlands, Norway, Spain and Sweden and found several instances of reports consistent with the above, as well as some contrary. This report addresses this issue and investigates the decade-long financial effect of “pure” (i.e. unfunded) knowledge spillover on firms compared to firms that receive funding and access to knowledge, comparing them to the performance of a control group.
Against this background we strive firstly to shed light on the role of state funding to firms by looking at the performance of co-funded and non-funded firms in projects where the state gives support to the academic partner. Co-funded firms have a financial incentive, as well as pressure, to perform well, while non-funded firms are in an open innovation scenario where they can seek as many knowledge spillovers as they deem relevant.
To these ends we performed a longitudinal analysis of the financial performance of firms included in state projects, for a decade post project, which enables the identification of over- and under-performing projects and their associated universities.
We used the UK ‘Gateway to Research’ (GtR) database to find those firms associated with funding from the UK research councils. The GtR data provides information on all state-supported research projects, including Innovate UK, the seven Research Councils and the National Centre for the Replacement, Refinement and Reduction of Animals in Research (NC3Rs). For this work we chose two culturally quite distinct sources, Innovate UK (budget of £1,200m/year) and the Arts and Humanities Research Council (AHRC) which has a budget of £102 m/year. All firms involved in state funded projects from these two sources between 2009 and 2012 were found and their Companies House registered number (CRN), postcode and Standard Industrial Classification (SIC) 4-digit level code were recorded. Using Companies House data (annual returns), these firms were then tracked for the decade 2012 to 2022 and for each year their annual economic performance was measured. For each firm investigated the pooled data from a random group of 6 non-involved firms of similar size and in the same SIC category, functioned as control.
In AHRC funded projects, higher education institutions or other research institutes (here both referred to as ‘universities’) take on the role of project coordinator, while firms and other corporate entities participate as non-funded partners that are interested in being exposed to knowledge spillovers. Conversely, Innovate UK projects aim at the commercialisation of innovations and operates quite differently, with a funded university lead and much support going to firms within the UK.
Methods and data sourcesTo conduct our analysis, MS SQL Server was used for storing the data in the large (∼2.5 GB) dataset and extracted using Python. ArcGIS pro was used for mapping and MS Excel with Minitab for financial analyses.
GtR provides information about ∼34,000 organisations that have participated in state-supported projects. However please note that the GtR data relates exclusively to the state contribution and does not provide data about other financial contributions by firms or other organisations. The datasets are publicly available on https://gtr.ukri.org/
Those projects granted between 2009 and 2012 from AHRC and Innovate UK that contained an industrial partner were selected and the industrial partner identified from its CRN as displayed on the public register of companies and the corresponding SIC code(s) retrieved. Companies House registers company information and also makes it available to the public, including providing economic data in the form of annual company returns (in iXBRL format), which were extracted and used to gauge company performance. The datasets are publicly available on https://www.gov.uk/guidance/companies-house-data-products
The number of projects investigated was 266 (AHRC 63 and Innovate UK 203), which represents the total for these councils contained in GtR. AHRC and Innovate UK combined showed the total number of universities involved was 90 together with 368 firms in 169 SIC codes. In those 91 instances where only 1 SIC code was involved, trimmed estimators were used, resulting in a nonparametric skew. Those cases which lack the volume for individual statistical accuracy, were pooled and are presented separately.
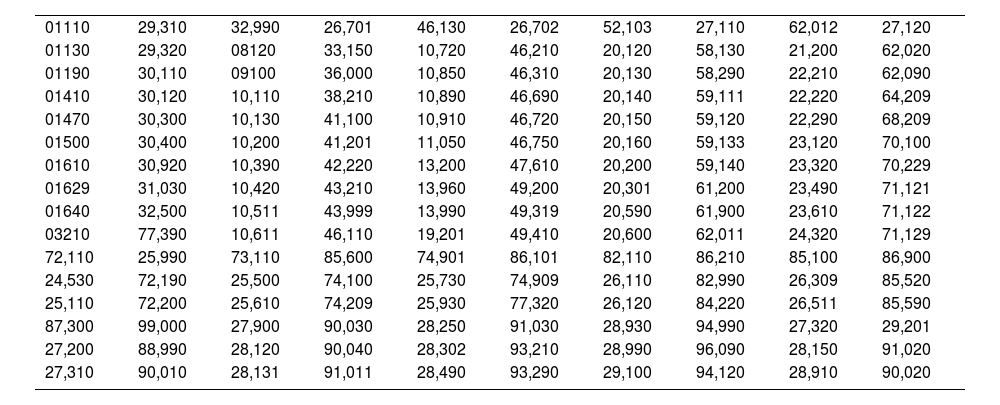
The SIC codes involved in the projects are presented in Appendix Table 1. All identifiers for both firm and universities were removed, thus guaranteeing anonymity.
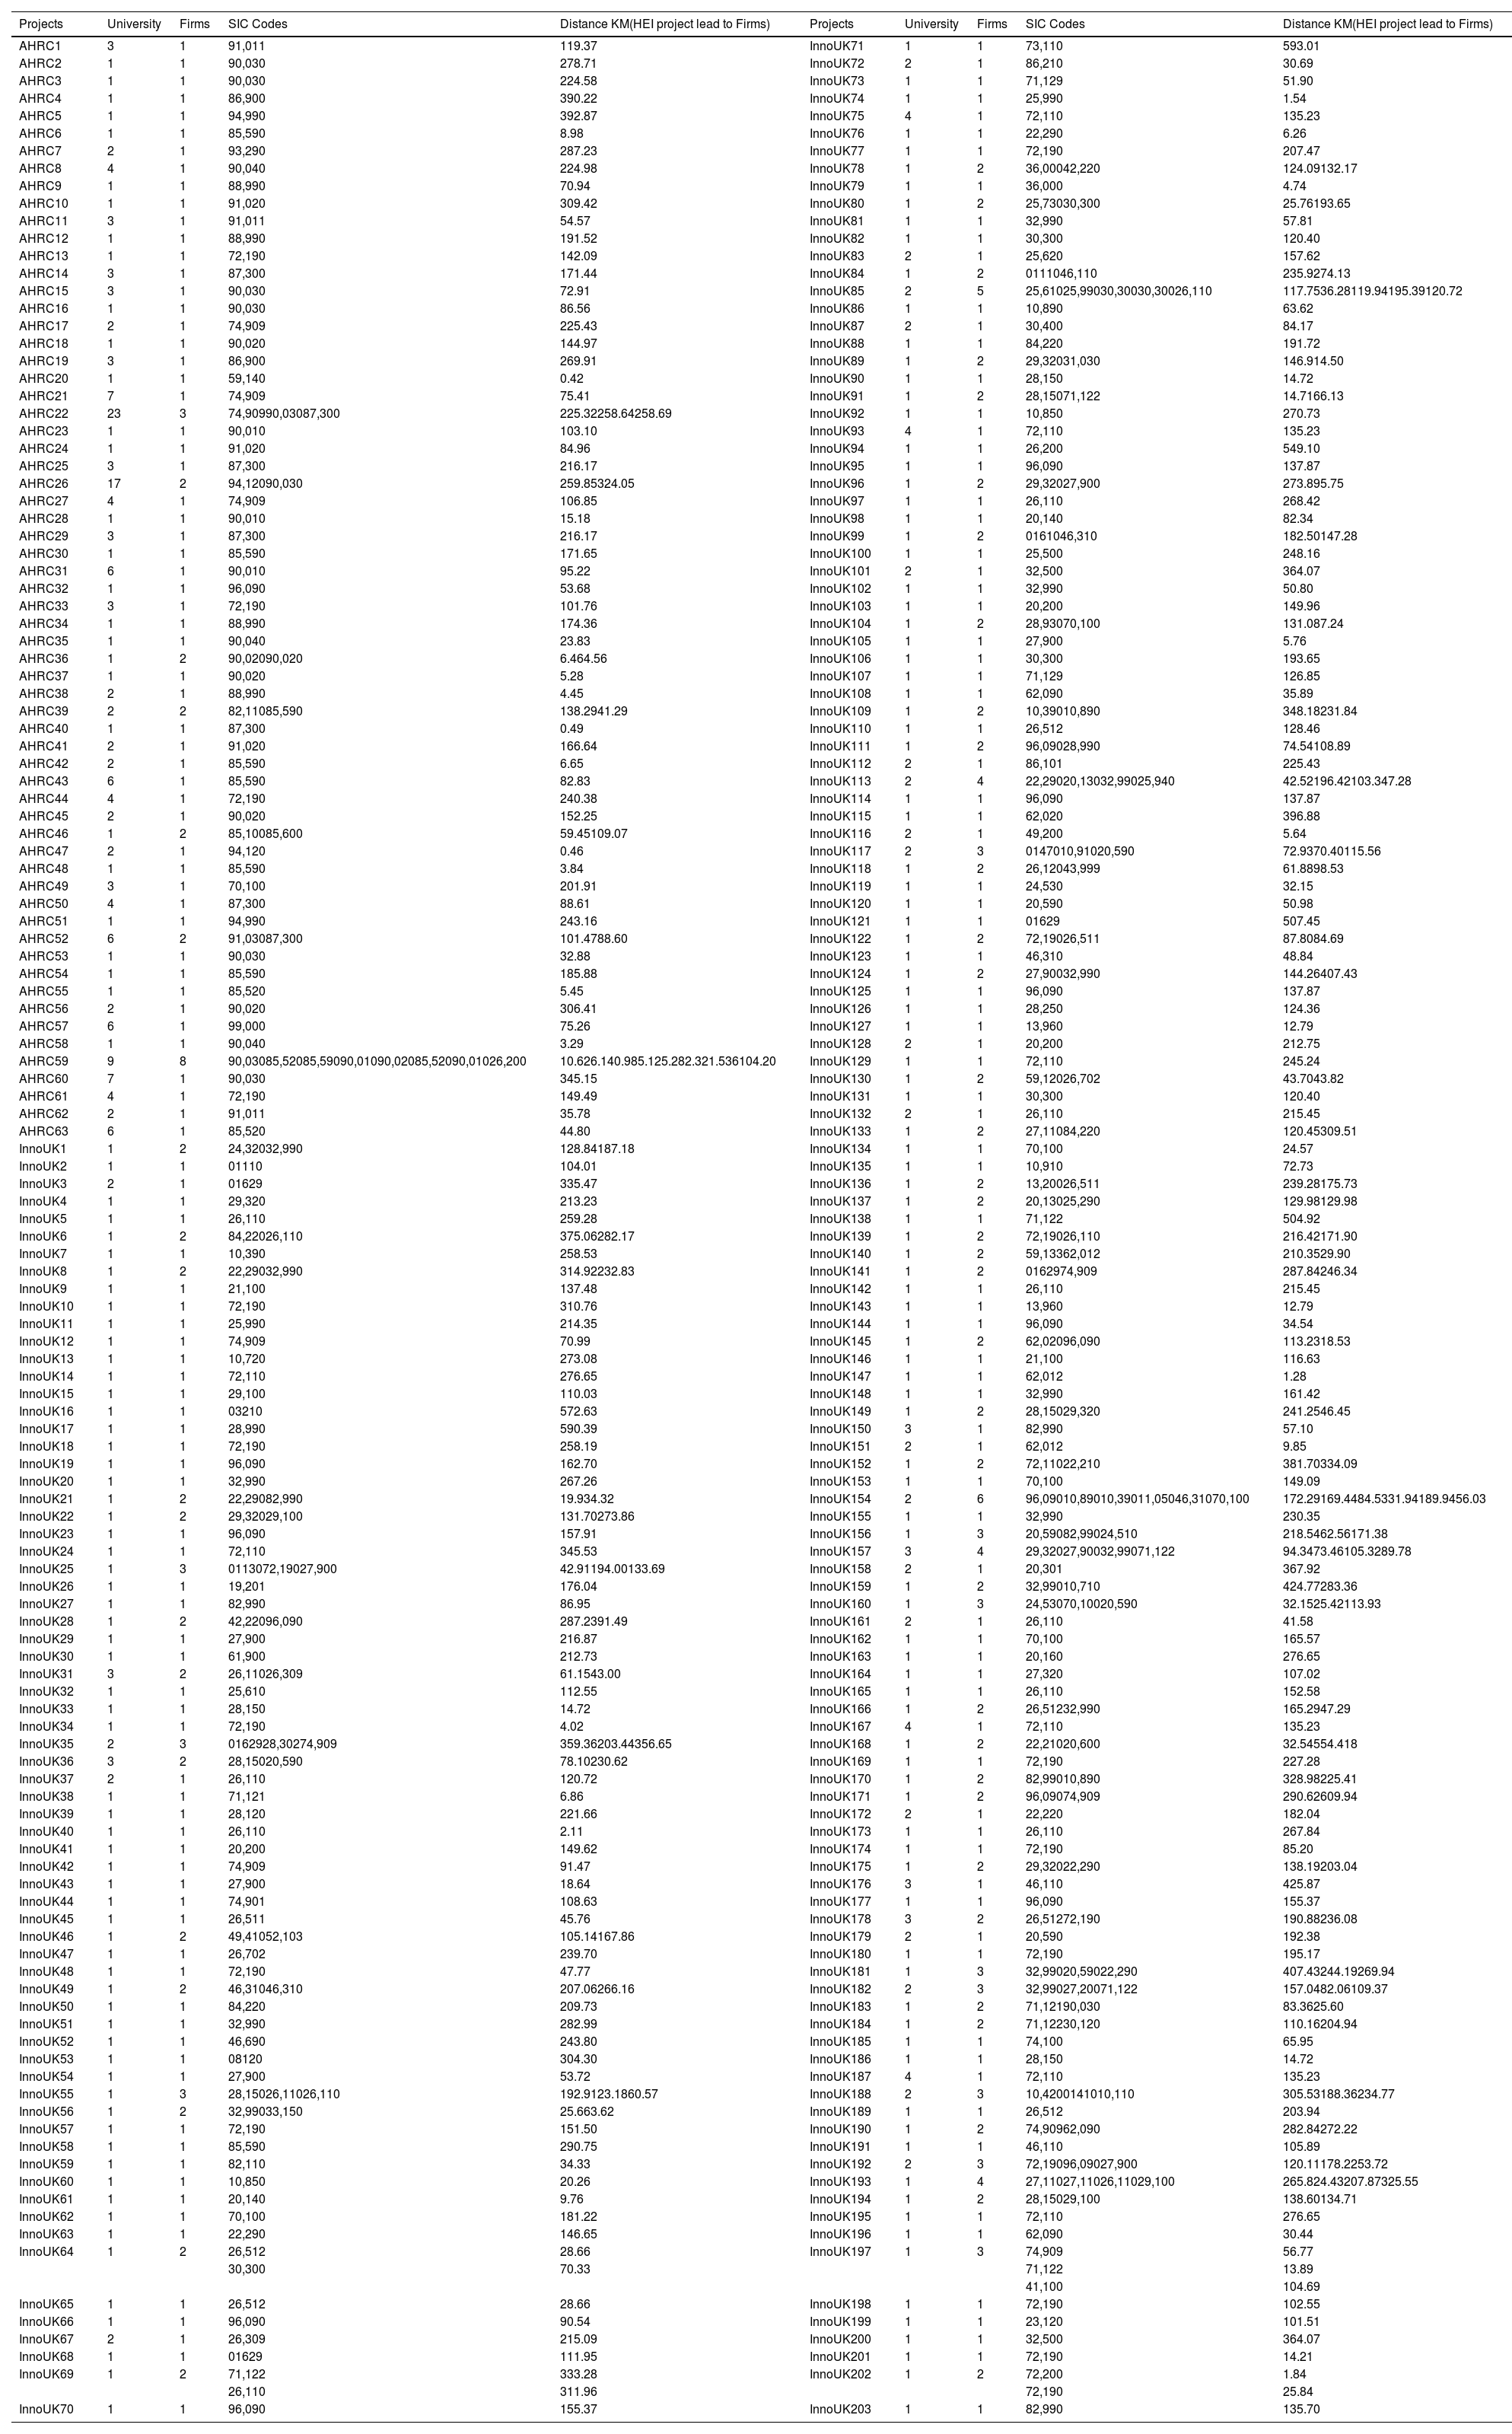
Appendix Table 2 shows the number of projects investigated (designated randomly), the number of academic and industrial partners, the Standard Industrial Classification (SIC) Codes of the industrial partners and their distance in km from the academic lead partner.
University rankings were gleaned from https://www.theguardian.com/education/ng-interactive/2024/sep/07/the-guardian-university-guide-2025-the-rankings
ResultsIn this study, we conducted a comprehensive analysis of funded firms, leveraging SIC Codes to segment and categorize their longitudinal performance as compared to the pooled performance of 6 randomly chosen anonymous firms of comparable size in the same SIC code.
The results are broken down into several parts, firstly those looking at clustering of firms, secondly by analysing financial performance according to the funding source and thirdly by analysing comparative performance by industrial sector.
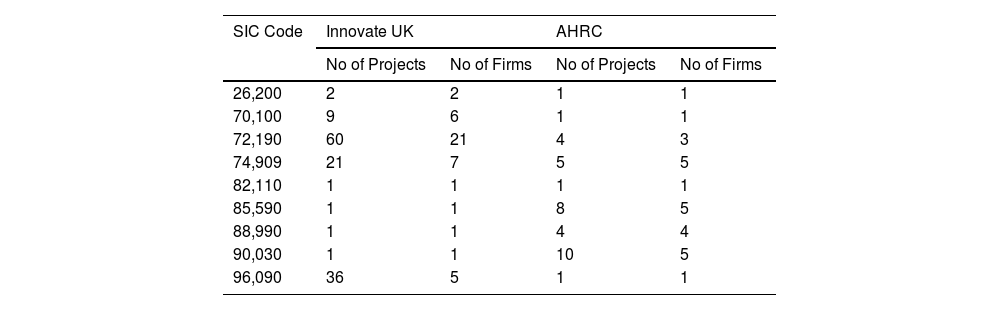
Who funds what?The different foci of the two research councils can be seen in the SIC codes of the associated firms, the top 3 SIC codes for firms involved in Innovate UK projects were 72,190, 32,990, 26,110 and for AHRC the 3 top SIC codes were 90,030, 85,590, 87,300, thus the two research councils appear to fund largely diverse industrial areas and there appears to be little overlap in the major areas of interest.
However, the two funding sources, Innovate UK and AHRC, did show some overlap in the more minor areas of interest expressed by the incorporated partners in projects. Table 3 shows where interests overlap, that SIC 72,190 (Other research and experimental development on natural sciences and engineering) were of larger interest to Innovate UK, and 90,030 (Operation of historical sites and buildings and similar visitor attractions) was of more interest to AHRC.
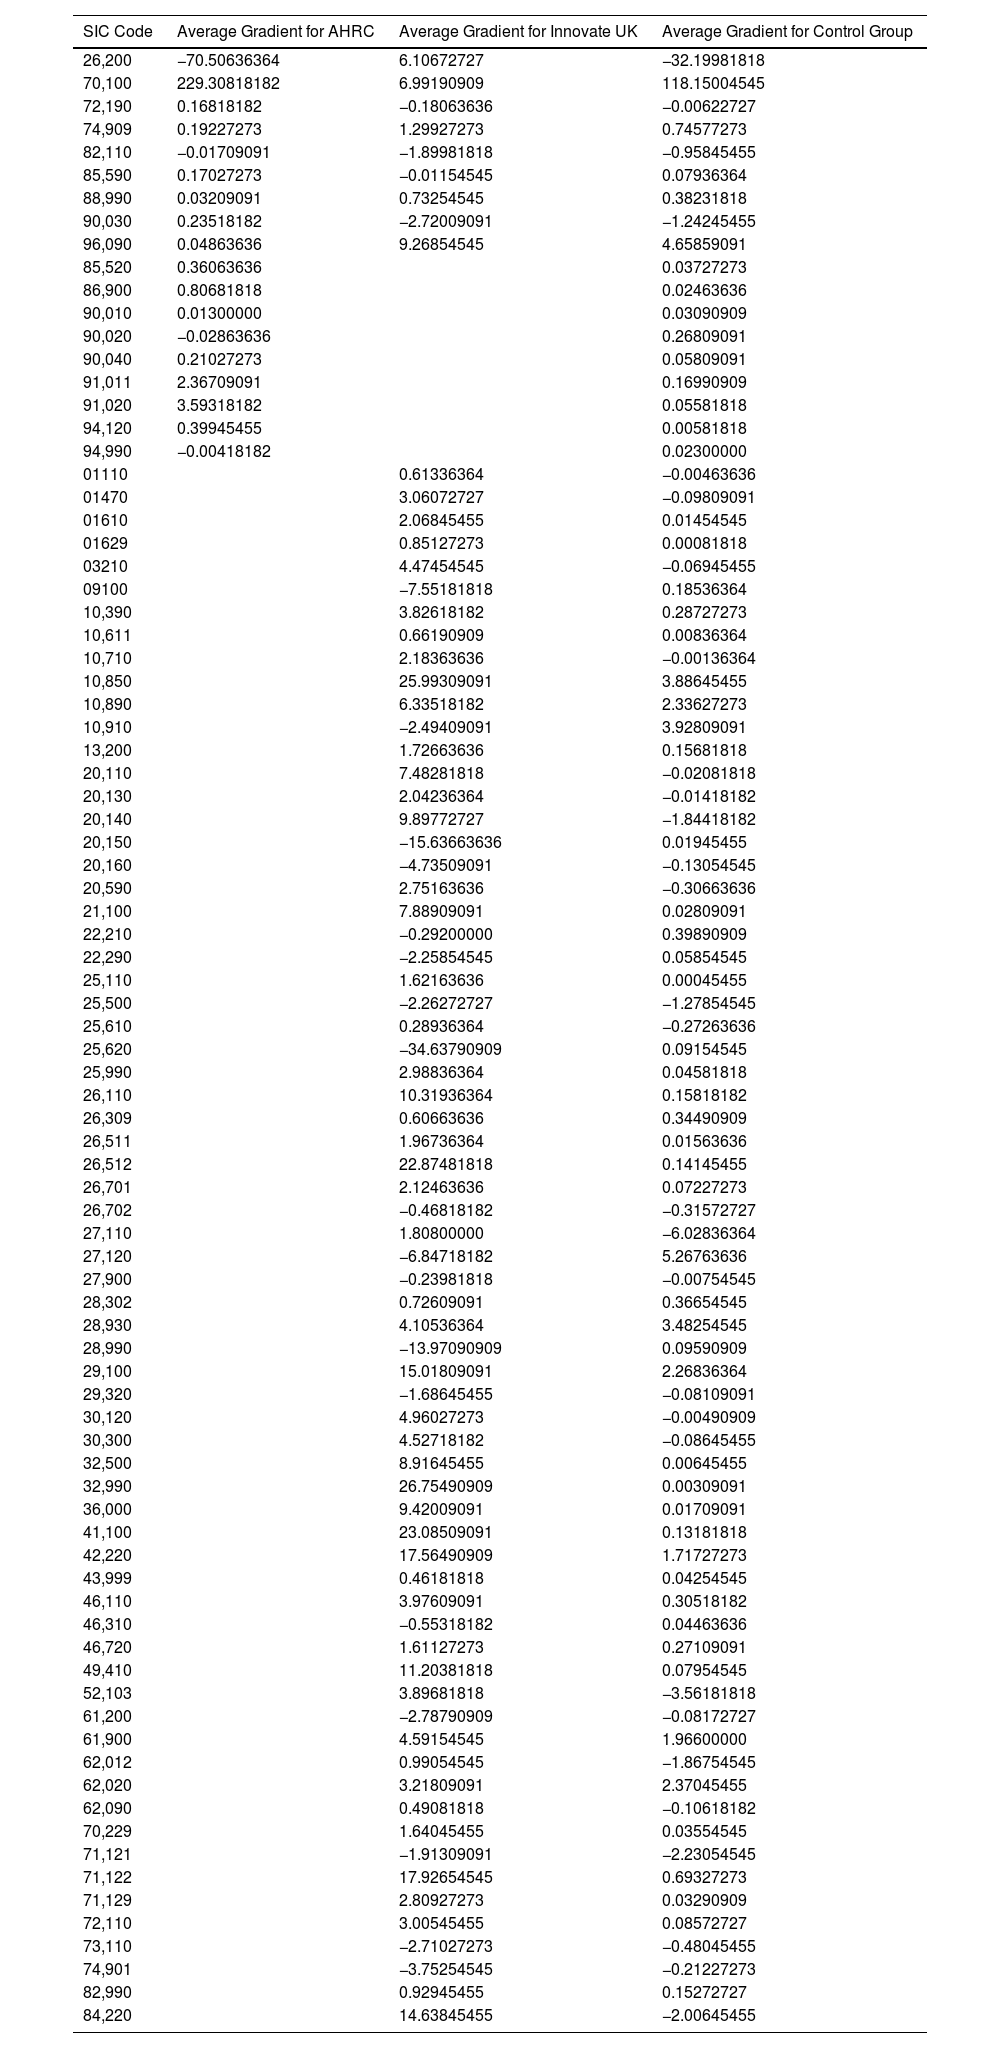
Performance of firms in selected SIC codes that were associated with either AHRC or Innovate UK funded projects in the 10 years post-project.
| SIC Code | Average Gradient for AHRC | Average Gradient for Innovate UK | Average Gradient for Control Group |
|---|---|---|---|
| 26,200 | −70.50636364 | 6.10672727 | −32.19981818 |
| 70,100 | 229.30818182 | 6.99190909 | 118.15004545 |
| 72,190 | 0.16818182 | −0.18063636 | −0.00622727 |
| 74,909 | 0.19227273 | 1.29927273 | 0.74577273 |
| 82,110 | −0.01709091 | −1.89981818 | −0.95845455 |
| 85,590 | 0.17027273 | −0.01154545 | 0.07936364 |
| 88,990 | 0.03209091 | 0.73254545 | 0.38231818 |
| 90,030 | 0.23518182 | −2.72009091 | −1.24245455 |
| 96,090 | 0.04863636 | 9.26854545 | 4.65859091 |
| 85,520 | 0.36063636 | 0.03727273 | |
| 86,900 | 0.80681818 | 0.02463636 | |
| 90,010 | 0.01300000 | 0.03090909 | |
| 90,020 | −0.02863636 | 0.26809091 | |
| 90,040 | 0.21027273 | 0.05809091 | |
| 91,011 | 2.36709091 | 0.16990909 | |
| 91,020 | 3.59318182 | 0.05581818 | |
| 94,120 | 0.39945455 | 0.00581818 | |
| 94,990 | −0.00418182 | 0.02300000 | |
| 01110 | 0.61336364 | −0.00463636 | |
| 01470 | 3.06072727 | −0.09809091 | |
| 01610 | 2.06845455 | 0.01454545 | |
| 01629 | 0.85127273 | 0.00081818 | |
| 03210 | 4.47454545 | −0.06945455 | |
| 09100 | −7.55181818 | 0.18536364 | |
| 10,390 | 3.82618182 | 0.28727273 | |
| 10,611 | 0.66190909 | 0.00836364 | |
| 10,710 | 2.18363636 | −0.00136364 | |
| 10,850 | 25.99309091 | 3.88645455 | |
| 10,890 | 6.33518182 | 2.33627273 | |
| 10,910 | −2.49409091 | 3.92809091 | |
| 13,200 | 1.72663636 | 0.15681818 | |
| 20,110 | 7.48281818 | −0.02081818 | |
| 20,130 | 2.04236364 | −0.01418182 | |
| 20,140 | 9.89772727 | −1.84418182 | |
| 20,150 | −15.63663636 | 0.01945455 | |
| 20,160 | −4.73509091 | −0.13054545 | |
| 20,590 | 2.75163636 | −0.30663636 | |
| 21,100 | 7.88909091 | 0.02809091 | |
| 22,210 | −0.29200000 | 0.39890909 | |
| 22,290 | −2.25854545 | 0.05854545 | |
| 25,110 | 1.62163636 | 0.00045455 | |
| 25,500 | −2.26272727 | −1.27854545 | |
| 25,610 | 0.28936364 | −0.27263636 | |
| 25,620 | −34.63790909 | 0.09154545 | |
| 25,990 | 2.98836364 | 0.04581818 | |
| 26,110 | 10.31936364 | 0.15818182 | |
| 26,309 | 0.60663636 | 0.34490909 | |
| 26,511 | 1.96736364 | 0.01563636 | |
| 26,512 | 22.87481818 | 0.14145455 | |
| 26,701 | 2.12463636 | 0.07227273 | |
| 26,702 | −0.46818182 | −0.31572727 | |
| 27,110 | 1.80800000 | −6.02836364 | |
| 27,120 | −6.84718182 | 5.26763636 | |
| 27,900 | −0.23981818 | −0.00754545 | |
| 28,302 | 0.72609091 | 0.36654545 | |
| 28,930 | 4.10536364 | 3.48254545 | |
| 28,990 | −13.97090909 | 0.09590909 | |
| 29,100 | 15.01809091 | 2.26836364 | |
| 29,320 | −1.68645455 | −0.08109091 | |
| 30,120 | 4.96027273 | −0.00490909 | |
| 30,300 | 4.52718182 | −0.08645455 | |
| 32,500 | 8.91645455 | 0.00645455 | |
| 32,990 | 26.75490909 | 0.00309091 | |
| 36,000 | 9.42009091 | 0.01709091 | |
| 41,100 | 23.08509091 | 0.13181818 | |
| 42,220 | 17.56490909 | 1.71727273 | |
| 43,999 | 0.46181818 | 0.04254545 | |
| 46,110 | 3.97609091 | 0.30518182 | |
| 46,310 | −0.55318182 | 0.04463636 | |
| 46,720 | 1.61127273 | 0.27109091 | |
| 49,410 | 11.20381818 | 0.07954545 | |
| 52,103 | 3.89681818 | −3.56181818 | |
| 61,200 | −2.78790909 | −0.08172727 | |
| 61,900 | 4.59154545 | 1.96600000 | |
| 62,012 | 0.99054545 | −1.86754545 | |
| 62,020 | 3.21809091 | 2.37045455 | |
| 62,090 | 0.49081818 | −0.10618182 | |
| 70,229 | 1.64045455 | 0.03554545 | |
| 71,121 | −1.91309091 | −2.23054545 | |
| 71,122 | 17.92654545 | 0.69327273 | |
| 71,129 | 2.80927273 | 0.03290909 | |
| 72,110 | 3.00545455 | 0.08572727 | |
| 73,110 | −2.71027273 | −0.48045455 | |
| 74,901 | −3.75254545 | −0.21227273 | |
| 82,990 | 0.92945455 | 0.15272727 | |
| 84,220 | 14.63845455 | −2.00645455 |
Of the AHRC-associated firms, 14 projects (22.2 %) out of 63 had firms within 30 km. For example, AHRC36 had 2 firms close by, but conversely project AHRC22 had 3 firms, all over 200 km away. The closest example to a local cluster was project AHRC59, a cluster of 8 close firms, but that project also contains one far (>100 km) away.
Of the Innovate UK-associated firms, 21 projects (10.4 %) out of 203 had firms within 30 km. The closest examples to a cluster were InnoUK21, InnoUK56 and InnoUK202, all of which had 2 firms close by the project lead. Conversely project InnoUK154 has 6 firms, all over 100 km away. Table 2 shows the overall results regarding proximity.
Financial analyses: comparing the two research councilsFigs. 1 and 2 show the aggregated performance of firms associated with AHRC projects (Fig. 1) and Innovate UK (Fig. 2) in the decade following their involvement in the projects. As can be seen from these figures, both Innovate UK- and AHRC-associated firms showed on average a superior performance. Those firms associated with AHRC projects showed about 20 % superiority to the control group while those firms associated with Innovate UK projects showed about 18 % superiority to the control group, which is close to the value (16 %) arrived at by the research councils own report (SQW Report, 2023). Interestingly in both cases a pronounced dip occurs during the Covid pandemic, somewhat more pronounced for firms associated with AHRC projects than those associated with Innovate UK projects.
. On the x-axis is year and on the y-axis is annual turnover in £mio.")

91 instances were recorded of entries in only 1 SIC code, which defies meaningful analysis. Thus, these examples were pooled and the aggregate performance compared to the aggregated control firms for these SIC codes.
Skewed outliers: Fig. 3 shows the pooled performance against pooled controls. Should the outliers have exhibited a poorer performance that controls then further investigation would have been required. However, this was not the case, thus generally the results in Fig. 3 tend to lend believability to the results shown in Figs. 1-2 and Table 4.

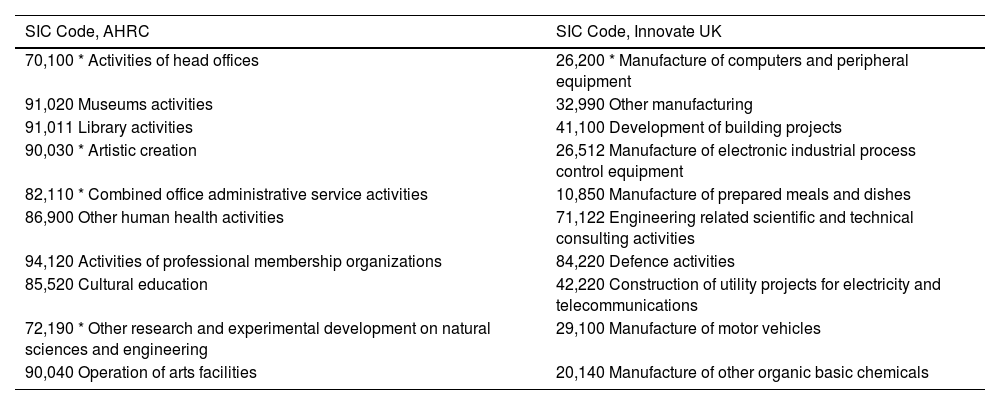
The 10 financially most successful SIC codes from most successful, descending, as associated with either AHRC or Innovate UK. Asterisk denotes popularity of that SIC code amongst the research councils, as given in Table 1.
| SIC Code, AHRC | SIC Code, Innovate UK |
|---|---|
| 70,100 * Activities of head offices | 26,200 * Manufacture of computers and peripheral equipment |
| 91,020 Museums activities | 32,990 Other manufacturing |
| 91,011 Library activities | 41,100 Development of building projects |
| 90,030 * Artistic creation | 26,512 Manufacture of electronic industrial process control equipment |
| 82,110 * Combined office administrative service activities | 10,850 Manufacture of prepared meals and dishes |
| 86,900 Other human health activities | 71,122 Engineering related scientific and technical consulting activities |
| 94,120 Activities of professional membership organizations | 84,220 Defence activities |
| 85,520 Cultural education | 42,220 Construction of utility projects for electricity and telecommunications |
| 72,190 * Other research and experimental development on natural sciences and engineering | 29,100 Manufacture of motor vehicles |
| 90,040 Operation of arts facilities | 20,140 Manufacture of other organic basic chemicals |
Nonetheless, given the uncertainty due to few firms (hence the pooling), the aggregate results, while optimistic overall, may not mirror the true picture for all outlier firms.
Financial performance by SIC codeAs shown in Table 3, firms data according to the source of funding was analysed.
Table 3 shows that firms in several SIC codes did not fare as well as the control group over time. These SIC codes are 85,520 (Cultural education), 88,990 (Other social work activities without accommodation), 90,010 (Performing arts), 90,040 (Operation of arts facilities), 90,020 (Support activities to performing arts) and 94,990 (Activities of other membership organizations). This was especially stark in 90,010, 90,020 and 94,990, where firms included in projects were not only outperformed by the control group, but their performance also stayed flat over a decade, with no improvement.
Conversely, firms in SIC codes 72,190 (Other research and experimental development on natural sciences and engineering), 74,909 (Other professional, scientific and technical activities n.e.c.) and 91,020 (Museum activities) all started ahead of the control group and maintained their lead throughout.
Between there groups were firms that managed to differentiate themselves from the control group. SIC codes for these firms were 85,590 (Other education n.e.c.), 91,020 (Museums activities) and the popular – see table 3 – 90,030 (Artistic creation).
SIC codes associated with both AHRC and Innovate UK funding were 26,200, 70,100 and 96,090. AHRC-associated firms in 26,200 (Manufacture of computers and peripheral equipment) performed below control while Innovate UK-associated firms performed above control. In 96,090 (Other service activities n.e.c.) AHRC-associated firms performed below control while Innovate UK-associated firms performed above control. Conversely in 70,100 (Activities of head offices) AHRC-associated firms performed excellently, well exceeding control, while Innovate UK-associated firms performed well below control, similarly in 90,030 (Artistic creation) AHRC-associated firms outperformed both control and Innovate UK-associated firms while the following associated with Innovate UK were outperformed by control; 09100, 20,150, 25,620, 28,990, 73,110, 74,901, 94,990 and 90,020.
An overview of the best performing SIC codes is given in Table 4.
Paradoxically, a comparison of Table 1 and Table 4 shows that the majority (15/20) of the successful SIC codes are not ‘core’ to the research councils involved.
Success in knowledge transferThe SIC codes in Table 4 allow the project number to be identified (as in Appendix Table 2) and hence the university leading the project. These 266 project leads (90 universities) can be ranked accordingly to the financial performance of the associated firms, leading to a measure of their success. Fig. 4 shows that universities have a broad range of success, as measured by the financial performance of associated firms measured over 10 years post-project. Nonetheless for 83 (31 %) of Innovate UK projects showed only a negligible (<1 %) increase in revenues over control. For AHRC non-funded firms this figure of poor performance was lower (24.6 %). Fig. 4 shows the distribution range of success, as measured by percent growth in turnover of the firms associated with the state-funded projects. Fig. 4A shows in particular that many firms received large boosts to their turnover after being part of AHRC projects, while Fig. 4B shows that a significant proportion of firms in Innovate UK projects performed relatively disappointingly after the project was concluded.
 AHRC and (B) Innovate UK across universities. On the x-axis is increase in annual turnover vs control of firms associated with the two research councils’ grants, and on the y-axis is number of universities. Note that the number of universities in Fig. 4 exceeds a total of 90 due to some universities falling into more than one group.")
The growth rate of firms associated with (A) AHRC and (B) Innovate UK across universities. On the x-axis is increase in annual turnover vs control of firms associated with the two research councils’ grants, and on the y-axis is number of universities. Note that the number of universities in Fig. 4 exceeds a total of 90 due to some universities falling into more than one group.
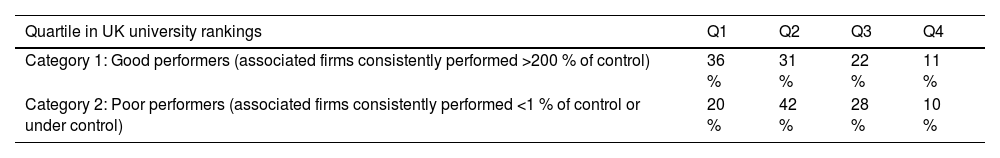
Closer analysis showed two non-overlapping sets, one set of 21 universities (18.9 %) whose associated firms consistently performed >200 % of control (category 1), and a second set of 24 universities (21.6 %) whose associated firms consistently performed <1 % of control or under control (category 2).
At this point the influence of university reputation was briefly considered by using open access data available on the Guardian newspaper web site (Guardian University Guide, 2025) and dividing the 120 universities given there into Quartiles. Table 5 shows that both categories contained universities in the ‘lowest’ quartile and that category 1 universities had a slight predominance in ‘high’ rankings, although this was not a strong correlation.
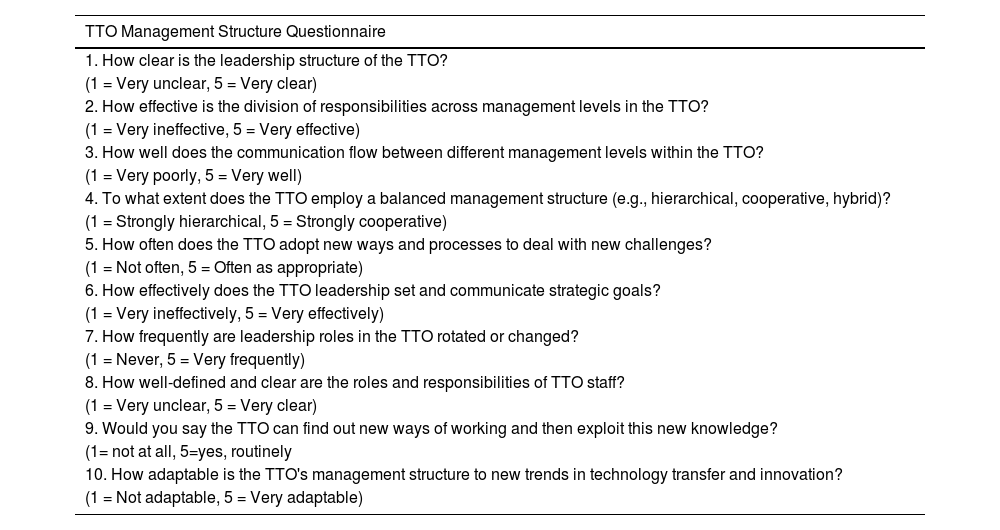
The tech transfer dept at the 45 universities identified as good (category 1) performers or poor (category 2) were invited to complete a 5-point Likert-style on-line (MS Forms) questionnaire consisting of the 10 questions given in Appendix Table 3. The highest possible score is thus 50, indicating an agile organization implementing good business ambidexterity, while a low score would indicate a rigid top-down bureaucracy. From the ∼50 % response rate, the good performers (category 1) scored av 44 ± 3 while the poor performers (category 2) scored lower (av 22 ± 2). These results lend provisional support to the observation of Mondal et al. (2024), that dynamic team structures and business ambidexterity in the TTO can improve performance above that observed in stringent top-down management structures.
DiscussionGeographical analysisRegarding geographical proximity, for German firms, Holl et al. (2022) found that the strength of knowledge spillovers that contribute to innovation in firms falls off with distance, vanishing to zero beyond 30 km. Similarly, Rodríguez-Pose and Comptour (2012, p.280) said ‘Physical proximity is often regarded as the key aspect making some regions genuine loci of innovation. The basic reasoning is that innovation travels with difficulty and suffers from strong distance decay effects’. Using the concepts of distance decay (Pun-Cheng, 2016), (Helmers, 2019) also found ‘knowledge spillovers decay rapidly with geographic distance’.
In this study the figures for projects funded by AHRC show only 21 firms within 30 km for the principal university, out of 63 projects funded. Similarly, the figures for projects funded by Innovate UK show only 42 firms within 30 km for the principal university, out of 203 projects. This finding implies agreement with Johnson (2022) insomuch as asset complementarity (expressed as inclusion in a project) could be more important than distance.
Distances between the project lead university and firms are given in Appendix Table 2 and the mean and median distances for both funding sources are given in Table 2.
These results correlate well with the findings of Mondal et al. (2021) who found no evidence of agglomeration of specialized firms around universities (see also Mellor, 2025). However, Mondal et al. (2021) also looked at non-university innovation sources, namely Science and Technology Parks (STPs) and found that in the UK, there exists a limit of 32 km from an innovation source (in this case an STP) to the next STP with the same specialization (Al-Kfairy & Mellor, 2020; Mondal et al., 2023). Kussainov et al. (2020) also found that specialized firms are to be found in an annular ring of 4–8 km around specialized STPs (for recent overviews of STPs in this respect, see Mondal et al., 2023), but in agreement with the tendency reported here, neither Mondal et al. (2021) nor Kussainov et al. (2020) could find evidence of co-location of specialized firms around universities in the UK. Thus, Holl et al. (2022) are not incorrect about the distance effective knowledge spillovers contributing to innovation in firms but it seemingly applies better in those cases where an STP is the knowledge source. However, it must be qualified that it is unknown if, in the case of spillovers from STPs, if this involves innovation or imitation (see Cappelli et al., 2014). Certainly, these results support the view that, in the case of universities as knowledge sources, that distance is only a minor factor (c.f. Roper et al., 2017) when compared to the pull of asset complementarity (Johnson, 2022) in establishing consortia of technological alliances (Jung et al., 2024). This is an important distinction because STPs are dependent on attracting firms (see e.g. Mondal & Mellor, 2021) for growth, but universities are not dependent on industrial partners to flourish.
Financial analyses: innovate UK compared to AHRCIn Fig. 1, the performance of AHRC firms demonstrates a consistent upward trend from 2012 to 2022, with occasional fluctuations. This trend indicates steady growth and suggests that funding and associated knowledge exchange has positively influenced the performance of these firms over the years. However, there is a notable deviation from this trend in 2020, where performance sees a significant decline. This deviation may be attributable to the unprecedented challenges posed by the COVID-19 pandemic.
The provided regression equation indicates a logarithmic relationship between the time and performance. It suggests that as time progresses, the performance of firms increases logarithmically; the overall growth rate for those firms in AHRC projects was 29.39 %.
In Fig. 2, the comparative analysis reveals distinct performance trends between funded (Innovate UK) and non-funded firms (AHRC) over the analysed period. On aggregate, Innovate UK firms outperform (by 18 %) control firms across the years, indicating the potential positive impact of funding on firm performance, albeit that 31 % of firms in Innovate UK projects under-perform against control.
The regression equation indicates that performance growth follows a logarithmic pattern over time. The relatively high R² value of 0.6921 suggests that the model explains a significant portion of the variability in the data, implying a relatively robust fit of the regression model.
On average, firms associated with both state granting schemes initially appear to have received a boost to performance, however other interpretations are possible, for example one could postulate that these, more innovative firms, would have had superior performance anyway, only that, as innovative entities, did they seek membership of a state-funded project. They may also have been directly funded by further projects, after 2012.
ConclusionThe results presented imply that firms that are part of state-funded consortia receive a ‘boost’ from the academic partner(s), leading to their aggregated superior financial performance.
Of the independent variables:
- (1)
The idea that the research councils differing interest areas have a large effect appears largely substantiated.
- (2)
The idea that industry sector (SIC code) affects firm performance is largely substantiated. However, and paradoxically, the best performers were not predominant in those sectors that appear popular with the research councils.
- (3)
Co-funding of firms appears on average not to be a significant factor in boosting firms finances in that many (31 %) co-funded firms performed under control, as well as the result that non-funded firms appear on average to perform better post-project.
- (4)
The data indicates that some universities spread throughout the UK regions consistently give a significant ‘boost’ to associated firms, while others, equally spread, consistently do not. The reason for better knowledge boost is not that "success begets success" in terms of reputation but may rather be associated with the degree of business ambidexterity in the transfer function.
However, when we drill down to industrial sectors, a much more nuanced picture begins to emerge, possibly illustrating that Big Data approaches (e.g. Will & Mellor, 2019) may miss the fine detail. For example, there is that in this work no indication of how much product innovation has been achieved versus process innovations (see Cappelli et al., 2014). Especially concerning, is that causality has not been proven and other mechanisms may affect results; perhaps the over-performing firms invited into state projects by universities are simply gazelles that would have performed better anyway? The results presented here show average improved financial performance, but do not definitely pin-point the cause.
The role of state support for private industryTransferring knowledge requires at least 2 partners; a donor and a recipient (for a recent general review of the Technology Acceptance Model, see Musa et al., 2024). The results presented here show that on average, firms associated with some knowledge donors perform on aggregate financially better than control firms. However, the more detailed results from SIC codes reveal that in most SIC codes, performance is comparable or even under control values (Mellor & Will, 2019; Koenig et al., 2024), but the average is boosted due to there being a few over-performers, who perform very well (Table 3). Conversely, under-performers may face challenges in accessing resources or scaling their operations (e.g. Zuniga-Vicente et al., 2014) while facing other costs, as discussed by Vivona et al. (2022).
One possible factor is the ability of firms to accept and incorporate innovations (Zieba, 2021) in an efficient manner (for an overview of this topic, see Bhadauria & Singh, 2023) but unfortunately there exists a paucity of comparative studies examining technology acceptance in different industries at the SIC level of detail
Who performed well in knowledge transfer?The study identified 21 universities where associated firms consistently over-performed (up to and over 400 % above control), and 24 universities whose associated firms consistently under-performed (<1 % above control). In both cases the universities identified were spread across the spectrum of university reputation (Table 5). The other 45 universities also gave a mixed picture and some authors, including Compagnucci and Spigarelli (2024), have put forward tentative theories to explain such results. Business ambidexterity is known to lead to superior corporate performance in environments where risky innovations abound (Will & Mellor, 2022; Will et al., 2019) and this report represents the first time that such a strategy has been observed in a university technology transfer context. Nevertheless, although business ambidexterity in the TTO function is indicated, more investigation is needed.
Future researchIt is tempting to speculate that the universities at the extremes will be the subject of comparative follow-up case studies investigating the management architecture of their respective knowledge transfer mechanisms (Mondal et al., 2024) and how this relates to management transaction costs (Mellor, 2016).
Author agreementThe authors warrant that the article is the authors' original work.
Declaration of generative AI and AI-assisted technologies in the writing processNo AI tools have been used
Consent for publicationAll authors have reviewed and approved the final manuscript and consent to its publication in the Journal of Innovation and Knowledge.
Availability of data and materialsThe data used here is from UK Research and Innovation (UKRI) and the Office of National Statistics (ONS) and is Crown copyright. The use of statistical data in this work does not imply the endorsement of the ONS in relation to the interpretation or analysis of the statistical data. The analysis upon which this paper is based uses open datasets which may not exactly reproduce other aggregates.
All ethical guidelines and considerations of e.g. GDPR have been strictly adhered to. The authors are prepared to provide public access to redacted data that is not already in the public domain, if practicable.
FundingN/A.
CRediT authorship contribution statementCharles Mondal: Software, Methodology, Investigation, Formal analysis, Data curation. Robert B. Mellor: Writing – review & editing, Writing – original draft, Supervision, Project administration.
We thank Howard Blackmore of UKRI for invaluable help in accessing the GtR data.
The spectrum of SIC codes of firms involved in AHRC and Innovate UK projects. For descriptions see https://resources.companieshouse.gov.uk/sic/.
| 01110 | 29,310 | 32,990 | 26,701 | 46,130 | 26,702 | 52,103 | 27,110 | 62,012 | 27,120 |
| 01130 | 29,320 | 08120 | 33,150 | 10,720 | 46,210 | 20,120 | 58,130 | 21,200 | 62,020 |
| 01190 | 30,110 | 09100 | 36,000 | 10,850 | 46,310 | 20,130 | 58,290 | 22,210 | 62,090 |
| 01410 | 30,120 | 10,110 | 38,210 | 10,890 | 46,690 | 20,140 | 59,111 | 22,220 | 64,209 |
| 01470 | 30,300 | 10,130 | 41,100 | 10,910 | 46,720 | 20,150 | 59,120 | 22,290 | 68,209 |
| 01500 | 30,400 | 10,200 | 41,201 | 11,050 | 46,750 | 20,160 | 59,133 | 23,120 | 70,100 |
| 01610 | 30,920 | 10,390 | 42,220 | 13,200 | 47,610 | 20,200 | 59,140 | 23,320 | 70,229 |
| 01629 | 31,030 | 10,420 | 43,210 | 13,960 | 49,200 | 20,301 | 61,200 | 23,490 | 71,121 |
| 01640 | 32,500 | 10,511 | 43,999 | 13,990 | 49,319 | 20,590 | 61,900 | 23,610 | 71,122 |
| 03210 | 77,390 | 10,611 | 46,110 | 19,201 | 49,410 | 20,600 | 62,011 | 24,320 | 71,129 |
| 72,110 | 25,990 | 73,110 | 85,600 | 74,901 | 86,101 | 82,110 | 86,210 | 85,100 | 86,900 |
| 24,530 | 72,190 | 25,500 | 74,100 | 25,730 | 74,909 | 26,110 | 82,990 | 26,309 | 85,520 |
| 25,110 | 72,200 | 25,610 | 74,209 | 25,930 | 77,320 | 26,120 | 84,220 | 26,511 | 85,590 |
| 87,300 | 99,000 | 27,900 | 90,030 | 28,250 | 91,030 | 28,930 | 94,990 | 27,320 | 29,201 |
| 27,200 | 88,990 | 28,120 | 90,040 | 28,302 | 93,210 | 28,990 | 96,090 | 28,150 | 91,020 |
| 27,310 | 90,010 | 28,131 | 91,011 | 28,490 | 93,290 | 29,100 | 94,120 | 28,910 | 90,020 |
Overview of keys, universities, firms, firms distance (Km) in straight line (Euclidean distances) from project leader, and firm SIC codes. AHRC denotes funded by AHRC and InnoUK denotes funded by Innovate UK.
| Projects | University | Firms | SIC Codes | Distance KM(HEI project lead to Firms) | Projects | University | Firms | SIC Codes | Distance KM(HEI project lead to Firms) |
|---|---|---|---|---|---|---|---|---|---|
| AHRC1 | 3 | 1 | 91,011 | 119.37 | InnoUK71 | 1 | 1 | 73,110 | 593.01 |
| AHRC2 | 1 | 1 | 90,030 | 278.71 | InnoUK72 | 2 | 1 | 86,210 | 30.69 |
| AHRC3 | 1 | 1 | 90,030 | 224.58 | InnoUK73 | 1 | 1 | 71,129 | 51.90 |
| AHRC4 | 1 | 1 | 86,900 | 390.22 | InnoUK74 | 1 | 1 | 25,990 | 1.54 |
| AHRC5 | 1 | 1 | 94,990 | 392.87 | InnoUK75 | 4 | 1 | 72,110 | 135.23 |
| AHRC6 | 1 | 1 | 85,590 | 8.98 | InnoUK76 | 1 | 1 | 22,290 | 6.26 |
| AHRC7 | 2 | 1 | 93,290 | 287.23 | InnoUK77 | 1 | 1 | 72,190 | 207.47 |
| AHRC8 | 4 | 1 | 90,040 | 224.98 | InnoUK78 | 1 | 2 | 36,00042,220 | 124.09132.17 |
| AHRC9 | 1 | 1 | 88,990 | 70.94 | InnoUK79 | 1 | 1 | 36,000 | 4.74 |
| AHRC10 | 1 | 1 | 91,020 | 309.42 | InnoUK80 | 1 | 2 | 25,73030,300 | 25.76193.65 |
| AHRC11 | 3 | 1 | 91,011 | 54.57 | InnoUK81 | 1 | 1 | 32,990 | 57.81 |
| AHRC12 | 1 | 1 | 88,990 | 191.52 | InnoUK82 | 1 | 1 | 30,300 | 120.40 |
| AHRC13 | 1 | 1 | 72,190 | 142.09 | InnoUK83 | 2 | 1 | 25,620 | 157.62 |
| AHRC14 | 3 | 1 | 87,300 | 171.44 | InnoUK84 | 1 | 2 | 0111046,110 | 235.9274.13 |
| AHRC15 | 3 | 1 | 90,030 | 72.91 | InnoUK85 | 2 | 5 | 25,61025,99030,30030,30026,110 | 117.7536.28119.94195.39120.72 |
| AHRC16 | 1 | 1 | 90,030 | 86.56 | InnoUK86 | 1 | 1 | 10,890 | 63.62 |
| AHRC17 | 2 | 1 | 74,909 | 225.43 | InnoUK87 | 2 | 1 | 30,400 | 84.17 |
| AHRC18 | 1 | 1 | 90,020 | 144.97 | InnoUK88 | 1 | 1 | 84,220 | 191.72 |
| AHRC19 | 3 | 1 | 86,900 | 269.91 | InnoUK89 | 1 | 2 | 29,32031,030 | 146.914.50 |
| AHRC20 | 1 | 1 | 59,140 | 0.42 | InnoUK90 | 1 | 1 | 28,150 | 14.72 |
| AHRC21 | 7 | 1 | 74,909 | 75.41 | InnoUK91 | 1 | 2 | 28,15071,122 | 14.7166.13 |
| AHRC22 | 23 | 3 | 74,90990,03087,300 | 225.32258.64258.69 | InnoUK92 | 1 | 1 | 10,850 | 270.73 |
| AHRC23 | 1 | 1 | 90,010 | 103.10 | InnoUK93 | 4 | 1 | 72,110 | 135.23 |
| AHRC24 | 1 | 1 | 91,020 | 84.96 | InnoUK94 | 1 | 1 | 26,200 | 549.10 |
| AHRC25 | 3 | 1 | 87,300 | 216.17 | InnoUK95 | 1 | 1 | 96,090 | 137.87 |
| AHRC26 | 17 | 2 | 94,12090,030 | 259.85324.05 | InnoUK96 | 1 | 2 | 29,32027,900 | 273.895.75 |
| AHRC27 | 4 | 1 | 74,909 | 106.85 | InnoUK97 | 1 | 1 | 26,110 | 268.42 |
| AHRC28 | 1 | 1 | 90,010 | 15.18 | InnoUK98 | 1 | 1 | 20,140 | 82.34 |
| AHRC29 | 3 | 1 | 87,300 | 216.17 | InnoUK99 | 1 | 2 | 0161046,310 | 182.50147.28 |
| AHRC30 | 1 | 1 | 85,590 | 171.65 | InnoUK100 | 1 | 1 | 25,500 | 248.16 |
| AHRC31 | 6 | 1 | 90,010 | 95.22 | InnoUK101 | 2 | 1 | 32,500 | 364.07 |
| AHRC32 | 1 | 1 | 96,090 | 53.68 | InnoUK102 | 1 | 1 | 32,990 | 50.80 |
| AHRC33 | 3 | 1 | 72,190 | 101.76 | InnoUK103 | 1 | 1 | 20,200 | 149.96 |
| AHRC34 | 1 | 1 | 88,990 | 174.36 | InnoUK104 | 1 | 2 | 28,93070,100 | 131.087.24 |
| AHRC35 | 1 | 1 | 90,040 | 23.83 | InnoUK105 | 1 | 1 | 27,900 | 5.76 |
| AHRC36 | 1 | 2 | 90,02090,020 | 6.464.56 | InnoUK106 | 1 | 1 | 30,300 | 193.65 |
| AHRC37 | 1 | 1 | 90,020 | 5.28 | InnoUK107 | 1 | 1 | 71,129 | 126.85 |
| AHRC38 | 2 | 1 | 88,990 | 4.45 | InnoUK108 | 1 | 1 | 62,090 | 35.89 |
| AHRC39 | 2 | 2 | 82,11085,590 | 138.2941.29 | InnoUK109 | 1 | 2 | 10,39010,890 | 348.18231.84 |
| AHRC40 | 1 | 1 | 87,300 | 0.49 | InnoUK110 | 1 | 1 | 26,512 | 128.46 |
| AHRC41 | 2 | 1 | 91,020 | 166.64 | InnoUK111 | 1 | 2 | 96,09028,990 | 74.54108.89 |
| AHRC42 | 2 | 1 | 85,590 | 6.65 | InnoUK112 | 2 | 1 | 86,101 | 225.43 |
| AHRC43 | 6 | 1 | 85,590 | 82.83 | InnoUK113 | 2 | 4 | 22,29020,13032,99025,940 | 42.52196.42103.347.28 |
| AHRC44 | 4 | 1 | 72,190 | 240.38 | InnoUK114 | 1 | 1 | 96,090 | 137.87 |
| AHRC45 | 2 | 1 | 90,020 | 152.25 | InnoUK115 | 1 | 1 | 62,020 | 396.88 |
| AHRC46 | 1 | 2 | 85,10085,600 | 59.45109.07 | InnoUK116 | 2 | 1 | 49,200 | 5.64 |
| AHRC47 | 2 | 1 | 94,120 | 0.46 | InnoUK117 | 2 | 3 | 0147010,91020,590 | 72.9370.40115.56 |
| AHRC48 | 1 | 1 | 85,590 | 3.84 | InnoUK118 | 1 | 2 | 26,12043,999 | 61.8898.53 |
| AHRC49 | 3 | 1 | 70,100 | 201.91 | InnoUK119 | 1 | 1 | 24,530 | 32.15 |
| AHRC50 | 4 | 1 | 87,300 | 88.61 | InnoUK120 | 1 | 1 | 20,590 | 50.98 |
| AHRC51 | 1 | 1 | 94,990 | 243.16 | InnoUK121 | 1 | 1 | 01629 | 507.45 |
| AHRC52 | 6 | 2 | 91,03087,300 | 101.4788.60 | InnoUK122 | 1 | 2 | 72,19026,511 | 87.8084.69 |
| AHRC53 | 1 | 1 | 90,030 | 32.88 | InnoUK123 | 1 | 1 | 46,310 | 48.84 |
| AHRC54 | 1 | 1 | 85,590 | 185.88 | InnoUK124 | 1 | 2 | 27,90032,990 | 144.26407.43 |
| AHRC55 | 1 | 1 | 85,520 | 5.45 | InnoUK125 | 1 | 1 | 96,090 | 137.87 |
| AHRC56 | 2 | 1 | 90,020 | 306.41 | InnoUK126 | 1 | 1 | 28,250 | 124.36 |
| AHRC57 | 6 | 1 | 99,000 | 75.26 | InnoUK127 | 1 | 1 | 13,960 | 12.79 |
| AHRC58 | 1 | 1 | 90,040 | 3.29 | InnoUK128 | 2 | 1 | 20,200 | 212.75 |
| AHRC59 | 9 | 8 | 90,03085,52085,59090,01090,02085,52090,01026,200 | 10.626.140.985.125.282.321.536104.20 | InnoUK129 | 1 | 1 | 72,110 | 245.24 |
| AHRC60 | 7 | 1 | 90,030 | 345.15 | InnoUK130 | 1 | 2 | 59,12026,702 | 43.7043.82 |
| AHRC61 | 4 | 1 | 72,190 | 149.49 | InnoUK131 | 1 | 1 | 30,300 | 120.40 |
| AHRC62 | 2 | 1 | 91,011 | 35.78 | InnoUK132 | 2 | 1 | 26,110 | 215.45 |
| AHRC63 | 6 | 1 | 85,520 | 44.80 | InnoUK133 | 1 | 2 | 27,11084,220 | 120.45309.51 |
| InnoUK1 | 1 | 2 | 24,32032,990 | 128.84187.18 | InnoUK134 | 1 | 1 | 70,100 | 24.57 |
| InnoUK2 | 1 | 1 | 01110 | 104.01 | InnoUK135 | 1 | 1 | 10,910 | 72.73 |
| InnoUK3 | 2 | 1 | 01629 | 335.47 | InnoUK136 | 1 | 2 | 13,20026,511 | 239.28175.73 |
| InnoUK4 | 1 | 1 | 29,320 | 213.23 | InnoUK137 | 1 | 2 | 20,13025,290 | 129.98129.98 |
| InnoUK5 | 1 | 1 | 26,110 | 259.28 | InnoUK138 | 1 | 1 | 71,122 | 504.92 |
| InnoUK6 | 1 | 2 | 84,22026,110 | 375.06282.17 | InnoUK139 | 1 | 2 | 72,19026,110 | 216.42171.90 |
| InnoUK7 | 1 | 1 | 10,390 | 258.53 | InnoUK140 | 1 | 2 | 59,13362,012 | 210.3529.90 |
| InnoUK8 | 1 | 2 | 22,29032,990 | 314.92232.83 | InnoUK141 | 1 | 2 | 0162974,909 | 287.84246.34 |
| InnoUK9 | 1 | 1 | 21,100 | 137.48 | InnoUK142 | 1 | 1 | 26,110 | 215.45 |
| InnoUK10 | 1 | 1 | 72,190 | 310.76 | InnoUK143 | 1 | 1 | 13,960 | 12.79 |
| InnoUK11 | 1 | 1 | 25,990 | 214.35 | InnoUK144 | 1 | 1 | 96,090 | 34.54 |
| InnoUK12 | 1 | 1 | 74,909 | 70.99 | InnoUK145 | 1 | 2 | 62,02096,090 | 113.2318.53 |
| InnoUK13 | 1 | 1 | 10,720 | 273.08 | InnoUK146 | 1 | 1 | 21,100 | 116.63 |
| InnoUK14 | 1 | 1 | 72,110 | 276.65 | InnoUK147 | 1 | 1 | 62,012 | 1.28 |
| InnoUK15 | 1 | 1 | 29,100 | 110.03 | InnoUK148 | 1 | 1 | 32,990 | 161.42 |
| InnoUK16 | 1 | 1 | 03210 | 572.63 | InnoUK149 | 1 | 2 | 28,15029,320 | 241.2546.45 |
| InnoUK17 | 1 | 1 | 28,990 | 590.39 | InnoUK150 | 3 | 1 | 82,990 | 57.10 |
| InnoUK18 | 1 | 1 | 72,190 | 258.19 | InnoUK151 | 2 | 1 | 62,012 | 9.85 |
| InnoUK19 | 1 | 1 | 96,090 | 162.70 | InnoUK152 | 1 | 2 | 72,11022,210 | 381.70334.09 |
| InnoUK20 | 1 | 1 | 32,990 | 267.26 | InnoUK153 | 1 | 1 | 70,100 | 149.09 |
| InnoUK21 | 1 | 2 | 22,29082,990 | 19.934.32 | InnoUK154 | 2 | 6 | 96,09010,89010,39011,05046,31070,100 | 172.29169.4484.5331.94189.9456.03 |
| InnoUK22 | 1 | 2 | 29,32029,100 | 131.70273.86 | InnoUK155 | 1 | 1 | 32,990 | 230.35 |
| InnoUK23 | 1 | 1 | 96,090 | 157.91 | InnoUK156 | 1 | 3 | 20,59082,99024,510 | 218.5462.56171.38 |
| InnoUK24 | 1 | 1 | 72,110 | 345.53 | InnoUK157 | 3 | 4 | 29,32027,90032,99071,122 | 94.3473.46105.3289.78 |
| InnoUK25 | 1 | 3 | 0113072,19027,900 | 42.91194.00133.69 | InnoUK158 | 2 | 1 | 20,301 | 367.92 |
| InnoUK26 | 1 | 1 | 19,201 | 176.04 | InnoUK159 | 1 | 2 | 32,99010,710 | 424.77283.36 |
| InnoUK27 | 1 | 1 | 82,990 | 86.95 | InnoUK160 | 1 | 3 | 24,53070,10020,590 | 32.1525.42113.93 |
| InnoUK28 | 1 | 2 | 42,22096,090 | 287.2391.49 | InnoUK161 | 2 | 1 | 26,110 | 41.58 |
| InnoUK29 | 1 | 1 | 27,900 | 216.87 | InnoUK162 | 1 | 1 | 70,100 | 165.57 |
| InnoUK30 | 1 | 1 | 61,900 | 212.73 | InnoUK163 | 1 | 1 | 20,160 | 276.65 |
| InnoUK31 | 3 | 2 | 26,11026,309 | 61.1543.00 | InnoUK164 | 1 | 1 | 27,320 | 107.02 |
| InnoUK32 | 1 | 1 | 25,610 | 112.55 | InnoUK165 | 1 | 1 | 26,110 | 152.58 |
| InnoUK33 | 1 | 1 | 28,150 | 14.72 | InnoUK166 | 1 | 2 | 26,51232,990 | 165.2947.29 |
| InnoUK34 | 1 | 1 | 72,190 | 4.02 | InnoUK167 | 4 | 1 | 72,110 | 135.23 |
| InnoUK35 | 2 | 3 | 0162928,30274,909 | 359.36203.44356.65 | InnoUK168 | 1 | 2 | 22,21020,600 | 32.54554.418 |
| InnoUK36 | 3 | 2 | 28,15020,590 | 78.10230.62 | InnoUK169 | 1 | 1 | 72,190 | 227.28 |
| InnoUK37 | 2 | 1 | 26,110 | 120.72 | InnoUK170 | 1 | 2 | 82,99010,890 | 328.98225.41 |
| InnoUK38 | 1 | 1 | 71,121 | 6.86 | InnoUK171 | 1 | 2 | 96,09074,909 | 290.62609.94 |
| InnoUK39 | 1 | 1 | 28,120 | 221.66 | InnoUK172 | 2 | 1 | 22,220 | 182.04 |
| InnoUK40 | 1 | 1 | 26,110 | 2.11 | InnoUK173 | 1 | 1 | 26,110 | 267.84 |
| InnoUK41 | 1 | 1 | 20,200 | 149.62 | InnoUK174 | 1 | 1 | 72,190 | 85.20 |
| InnoUK42 | 1 | 1 | 74,909 | 91.47 | InnoUK175 | 1 | 2 | 29,32022,290 | 138.19203.04 |
| InnoUK43 | 1 | 1 | 27,900 | 18.64 | InnoUK176 | 3 | 1 | 46,110 | 425.87 |
| InnoUK44 | 1 | 1 | 74,901 | 108.63 | InnoUK177 | 1 | 1 | 96,090 | 155.37 |
| InnoUK45 | 1 | 1 | 26,511 | 45.76 | InnoUK178 | 3 | 2 | 26,51272,190 | 190.88236.08 |
| InnoUK46 | 1 | 2 | 49,41052,103 | 105.14167.86 | InnoUK179 | 2 | 1 | 20,590 | 192.38 |
| InnoUK47 | 1 | 1 | 26,702 | 239.70 | InnoUK180 | 1 | 1 | 72,190 | 195.17 |
| InnoUK48 | 1 | 1 | 72,190 | 47.77 | InnoUK181 | 1 | 3 | 32,99020,59022,290 | 407.43244.19269.94 |
| InnoUK49 | 1 | 2 | 46,31046,310 | 207.06266.16 | InnoUK182 | 2 | 3 | 32,99027,20071,122 | 157.0482.06109.37 |
| InnoUK50 | 1 | 1 | 84,220 | 209.73 | InnoUK183 | 1 | 2 | 71,12190,030 | 83.3625.60 |
| InnoUK51 | 1 | 1 | 32,990 | 282.99 | InnoUK184 | 1 | 2 | 71,12230,120 | 110.16204.94 |
| InnoUK52 | 1 | 1 | 46,690 | 243.80 | InnoUK185 | 1 | 1 | 74,100 | 65.95 |
| InnoUK53 | 1 | 1 | 08120 | 304.30 | InnoUK186 | 1 | 1 | 28,150 | 14.72 |
| InnoUK54 | 1 | 1 | 27,900 | 53.72 | InnoUK187 | 4 | 1 | 72,110 | 135.23 |
| InnoUK55 | 1 | 3 | 28,15026,11026,110 | 192.9123.1860.57 | InnoUK188 | 2 | 3 | 10,4200141010,110 | 305.53188.36234.77 |
| InnoUK56 | 1 | 2 | 32,99033,150 | 25.663.62 | InnoUK189 | 1 | 1 | 26,512 | 203.94 |
| InnoUK57 | 1 | 1 | 72,190 | 151.50 | InnoUK190 | 1 | 2 | 74,90962,090 | 282.84272.22 |
| InnoUK58 | 1 | 1 | 85,590 | 290.75 | InnoUK191 | 1 | 1 | 46,110 | 105.89 |
| InnoUK59 | 1 | 1 | 82,110 | 34.33 | InnoUK192 | 2 | 3 | 72,19096,09027,900 | 120.11178.2253.72 |
| InnoUK60 | 1 | 1 | 10,850 | 20.26 | InnoUK193 | 1 | 4 | 27,11027,11026,11029,100 | 265.824.43207.87325.55 |
| InnoUK61 | 1 | 1 | 20,140 | 9.76 | InnoUK194 | 1 | 2 | 28,15029,100 | 138.60134.71 |
| InnoUK62 | 1 | 1 | 70,100 | 181.22 | InnoUK195 | 1 | 1 | 72,110 | 276.65 |
| InnoUK63 | 1 | 1 | 22,290 | 146.65 | InnoUK196 | 1 | 1 | 62,090 | 30.44 |
| InnoUK64 | 1 | 2 | 26,512 | 28.66 | InnoUK197 | 1 | 3 | 74,909 | 56.77 |
| 30,300 | 70.33 | 71,122 | 13.89 | ||||||
| 41,100 | 104.69 | ||||||||
| InnoUK65 | 1 | 1 | 26,512 | 28.66 | InnoUK198 | 1 | 1 | 72,190 | 102.55 |
| InnoUK66 | 1 | 1 | 96,090 | 90.54 | InnoUK199 | 1 | 1 | 23,120 | 101.51 |
| InnoUK67 | 2 | 1 | 26,309 | 215.09 | InnoUK200 | 1 | 1 | 32,500 | 364.07 |
| InnoUK68 | 1 | 1 | 01629 | 111.95 | InnoUK201 | 1 | 1 | 72,190 | 14.21 |
| InnoUK69 | 1 | 2 | 71,122 | 333.28 | InnoUK202 | 1 | 2 | 72,200 | 1.84 |
| 26,110 | 311.96 | 72,190 | 25.84 | ||||||
| InnoUK70 | 1 | 1 | 96,090 | 155.37 | InnoUK203 | 1 | 1 | 82,990 | 135.70 |
Questions sent to universities.
| TTO Management Structure Questionnaire |
|---|
| 1. How clear is the leadership structure of the TTO? |
| (1 = Very unclear, 5 = Very clear) |
| 2. How effective is the division of responsibilities across management levels in the TTO? |
| (1 = Very ineffective, 5 = Very effective) |
| 3. How well does the communication flow between different management levels within the TTO? |
| (1 = Very poorly, 5 = Very well) |
| 4. To what extent does the TTO employ a balanced management structure (e.g., hierarchical, cooperative, hybrid)? |
| (1 = Strongly hierarchical, 5 = Strongly cooperative) |
| 5. How often does the TTO adopt new ways and processes to deal with new challenges? |
| (1 = Not often, 5 = Often as appropriate) |
| 6. How effectively does the TTO leadership set and communicate strategic goals? |
| (1 = Very ineffectively, 5 = Very effectively) |
| 7. How frequently are leadership roles in the TTO rotated or changed? |
| (1 = Never, 5 = Very frequently) |
| 8. How well-defined and clear are the roles and responsibilities of TTO staff? |
| (1 = Very unclear, 5 = Very clear) |
| 9. Would you say the TTO can find out new ways of working and then exploit this new knowledge? |
| (1= not at all, 5=yes, routinely |
| 10. How adaptable is the TTO's management structure to new trends in technology transfer and innovation? |
| (1 = Not adaptable, 5 = Very adaptable) |