

The purpose of this study was to analyse the psychometric properties and factor structure of the Family Adaptability and Cohesion Evaluation Scale-Couple Version (FACES-CV) and the Communication Scale-Couple Version (Communication-CV), both consistent with the perspective of the circumplex model, with couples undergoing an assisted reproduction process.
Material and methodsA cross-sectional study was conducted on a total of 226 couples in an Assisted Reproduction Centre in Bilbao (Spain) between 2010 and 2014. A self-administered questionnaire (socio-demographic questionnaire, FACES-CV, Communication-CV, and Hostility and Interpersonal Sensitivity subscales from the Spanish adaptation of Symptom Checklist-90-Revised) was used as the assessment tool.
ResultsThe overall reliability of the inventory was high (0.89), and the internal consistency ratios of the subscales that composed it ranged between 0.73 and 0.79. Three alternative measurement models were tested using structural equation modelling. Finally, the model consistent with the circumplex model was chosen, as its goodness-of-fit indexes were adequate: χSB2=768.38, p<.001, χSB2/df=1.91, GFI=.86, CFI=.87, RMSEA=.045, 90% CI [.040, .050]. All the subscales showed a significant and negative correlation with Hostility and Interpersonal Sensitivity.
ConclusionsThe results are coherent with the perspective of the circumplex model. To our knowledge, none of the existing studies have tried to analyse the factor structure of FACES-CV and Communication-CV with couples undergoing an assisted reproduction process. The Spanish versions of the FACES-CV and Communication-CV are psychometrically adequate and suitable for the assessment of couples undergoing an assisted reproduction process.
El objetivo principal de este estudio ha sido el análisis de las propiedades psicométricas y la estructura factorial de la Escala de evaluación de la adaptabilidad y la cohesión familiar-versión para parejas (FACES-CV) y la Escala de comunicación-versión para parejas (Comunicación-CV), ambas en consonancia con la perspectiva del modelo circumplejo, en parejas en reproducción asistida.
Material y métodosSe ha realizado un estudio transversal en el cual se ha evaluado entre 2010 y 2014 a 226 parejas pacientes de un centro de reproducción asistida de Bilbao (España). Se ha empleado un autoinforme (cuestionario sociodemográfico, FACES-CV, Comunicación-CV y subescalas hostilidad y sensibilidad interpersonal de la adaptación española del Cuestionario de 90 síntomas revisado) como instrumento de medida.
ResultadosLa consistencia interna del instrumento a nivel global es elevada (0,89) y los coeficientes de consistencia interna de las 3 subescalas que lo componen oscilan entre 0,73 y 0,79. Se han probado 3 modelos de medida alternativos a través de modelos de ecuaciones estructurales. Finalmente, el modelo coherente con el modelo circumplejo ha sido el modelo de elección, por presentar este unos índices de ajuste adecuados: χ2SB = 768,38, p < 0,001, χ2SB/df = 1,91, GFI = 0,86, CFI = 0,87, RMSEA = 0,045, IC 90% 0,040 a 0,050. Las 3 subescalas han mostrado correlaciones significativas y negativas con las variables hostilidad y sensibilidad interpersonal.
ConclusionesLos resultados son coherentes con la perspectiva del modelo circumplejo. En función de la revisión realizada, ninguno de los estudios llevados a cabo hasta la actualidad ha analizado la estructura factorial del FACES-CV y Comunicación-CV en parejas en tratamiento de reproducción asistida. Las versiones españolas del FACES-CV y Comunicación-CV son psicométricamente adecuadas y apropiadas para la evaluación de parejas en tratamiento de reproducción asistida.
Cross-culturally, infertility is recognized as a stressor with the potential to wreak havoc on individual lives, couples and families (Berger et al., 2013). Infertility diagnosis usually leads to a major life crisis, a sudden and unexpected crisis that does not always have a clear diagnosis (Kim et al., 2014; Sezgin and Hocaoğlu, 2014). The procedure of diagnosis and treatment of infertility is time consuming, economically and psychologically burdening and physically difficult for the patient, and without any pregnancy guarantee (Palacios and Jadresic, 2000).
Over the last few decades, several studies have been conducted to analyse the connection between infertility and marital functioning. In this respect, Monga et al. (2004) found that women with fertility problems scored lower on marital adjustment than the control group, but these differences were not observed in the case of men. More recently, Valsangkar et al. (2011) assessed women diagnosed with primary infertility and women without fertility problems and the former scored lower, especially in cohesion and marital satisfaction with the relationship. However, although there seems to be an association between infertility and marital relationship, infertility is not always related to a decrease in satisfaction or marital adjustment. In this regard, Onat and Kizilkaya Beji (2012) studied the marital relationship of couples with primary infertility diagnosis and fertile couples, finding that the infertile couples obtained higher scores in marital adjustment.
The relevance of studying marital functioning has led to the development of standardized assessment instruments in the last decades “in order to provide efficient, valid, and reliable measures of various aspects of the couple relationship, […] including interviews, qualitative assessment methods, behavioural observations, clinical rating scales, and self-report instruments” (Lavee and Avisar, 2006, p. 234). Some of the most highly acknowledged and extended measures, primarily self-report questionnaires, are: the Marital Adjustment Scale (MAT, Locke and Wallace, 1959), the Dyadic Adjustment Scale (DAS, Spanier, 1976), the Kansas Marriage Satisfaction Scale (KMS, Schumm et al., 1983), the ENRICH (Enriching Relationship Issues, Communication and Happiness) Marital Inventory (Fournier et al., 1983), the Quality of Marriage Index (QMI, Norton, 1983) and the Stockholm Marital Stress Scale (Orth-Gomer et al., 2000). These instruments may be used in research and clinical practice to assess the couple's perception of their own marital functioning.
As Lavee and Avisar (2006) pointed out, some instruments were originally developed to assess family relations and later adapted to assess couple relationships. This is the case of the circumplex model of marital and family systems (Olson et al., 1979) and the instruments developed to assess the relevant variables of the model. This model is the most endorsed framework when it comes to understanding family or marital functioning, as more than 1200 studies have shown (Olson, 2011). The circumplex model was developed to study the functioning of family and marital systems through three variables: cohesion, adaptability and communication. The cohesion and adaptability dimensions were part of the circumplex model since its origins (Olson et al., 1979), and the communication dimension was added following a theoretical update (Olson et al., 1983).
In order to evaluate the three main dimensions of the circumplex model, some assessment tools were developed. Regarding cohesion and adaptability, the Family Adaptability and Cohesion Evaluation Scale (FACES, Olson et al., 1978) was developed. This instrument was modified to improve its psychometric properties, creating different versions: FACES II (Olson et al., 1982), FACES III (Olson et al., 1985) and FACES IV (Olson, 2011; Olson et al., 1996). Whereas the FACES III is the version used in normalized population, the FACES IV is used with dysfunctional families. The Marital Adaptability and Cohesion Evaluation Scale (MACES, Olson et al., 1985) was the version for couples of FACES III. The MACES is a reliable and valid instrument of only 20 items (10 per dimension).
Regarding the communication dimension, Barnes and Olson (1982) developed the Parent-Adolescent Communication Scale (PAC) to assess family communication, specifically between parents and adolescents. Subsequently, Fournier et al. (1983) created the ENRICH Marital Inventory, which includes a 10-item subscale to evaluate the communication dimension in couples. Nowadays, the ENRICH Marital Inventory includes both the MACES and the Communication subscale, so all three dimensions of the circumplex model are assessed through the three subscales of the ENRICH instrument.
Cohesion (togetherness/closeness) is defined as the emotional bonding that couple members have towards each other. Some of the specific concepts or variables used to analyse cohesion are “emotional bonding, boundaries, coalitions, time, space, friends, decision-making and interest and recreation” (Olson et al., 2014, p. 32). Adaptability (change/flexibility) is defined as the ability of a marital system “to change its power structure, role relationships and relationship rules in response to situational and developmental stress” (Olson et al., 2014, p. 35). This dimension is based on the following concepts: family power, negotiation styles, role relationships and relationship rules. These two first dimensions are curvilinear, that is, both extremes are dysfunctional, whereas moderate levels are functional. The basic hypothesis claims that dysfunctional systems tend to obtain extreme scores in both dimensions and have more relationship problems.
Communication is the third dimension of the model and its function is to facilitate couples’ movement in the other two dimensions. Positive communication skills (i.e., empathy, reflective listening, supportive comments) or negative communication skills (i.e., double messages, double binds, criticism) enable or restrict couples’ movement in the cohesion and adaptability dimensions. Communication has a linear relationship with marital functioning – i.e., the more communication, the better the relationship – (Olson et al., 2014).
In terms of infertility research, the ENRICH Marital Inventory has been adapted and used in several international studies of heterosexual and homosexual couples (Borneskog et al., 2012; Katiraei et al., 2010). In all of them, the ENRICH was considered an efficient instrument in the study of couple satisfaction and adjustment. However, the outcomes of these studies have not been analysed in relation to the circumplex model.
In summary, although the circumplex model is explicitly a model of family and marital functioning (Olson, 1993), its research related to couples is very scarce (Hertlein and Hawkins, 2012; Shir, 1999; Thomas and Lewis, 1999), and it has never been used to study the systemic functioning of couples undergoing assisted reproduction.
Therefore, there are two main goals for the present study: on the one hand, to obtain a Spanish version of the Cohesion and Adaptability Scales (referred to in this study as the Family Adaptability and Cohesion Evaluation Scale-Couple Version, FACES-CV) and the Communication Scale (Communication Scale-Couple Version, Communication-CV) and, on the other hand, to analyse the psychometric features of these scales using adequate proceedings for assessment of the items and the conceptual structure according to the circumplex model in couples with fertility problems.
Material and methodsParticipantsA total of 226 couples, 452 patients, from the Quirón Bilbao Assisted Reproduction Centre (QBARC, Bizkaia, Spain) took part in the study. Participants’ age ranged from 23 to 54 years, the average being 36.22 (SD=4.41). The women had a mean age of 35.61 years (SD=4.06), while men's mean age was 36.85 years (SD=4.67).
All of the participants completed the questionnaires during the second appointment, prior to starting the treatment. As regard the assisted reproduction techniques (ART) used, in 62.2% (n=281) of the participants, the intracytoplasmic sperm injection (ICSI) was used, in 20.8% (n=94), the in vitro fertilization (IVF), in 6.6% (n=30), the homologous intrauterine insemination, and other ART in the remaining cases.
The inclusion criteria were: to be a patient of QBARC, to be engaged in a heterosexual intimate relationship, and both members of the couple being willing to participate. The exclusion criteria were: to have non-Spanish nationality and to have difficulties in reading comprehension.
Variables and measuresSeven variables were used in the present study: gender, age, time of data collection, type of ART, quality of the intimate relationship, hostility, and interpersonal sensitivity.
Information about the ART type and the time of data collection were obtained via the clinical history of the participants in this study. The last five variables were gathered using the following instruments:
- 1.
Socio-demographic questionnaire prepared ad hoc for this study: this measure gathers information about participants’ name and surnames, gender and age.
- 2.
Three scales of the ENRICH Marital Inventory (Fournier et al., 1983) corresponding to the FACES-CV and Communication-CV. The complete instrument comprises 165 items rated on a five-point Likert scale, ranging from 1 (strongly disagree) to 5 (strongly agree), organized in 14 subscales: Idealistic Distortion, Marital Satisfaction, Personality Issues, Communication, Conflict Management, Financial Planning, Leisure Activities, Sexual Relations, Children and Parenting, Family and Friends, Roles in the Relationship, Spiritual Beliefs, Couple Closeness and Couple Flexibility. In this study, only three of these subscales were used: Couple Closeness (Cohesion), Couple Flexibility (Adaptability) and Communication, comprising 10 items each. Couple Closeness describes the level of emotional closeness in the couple's current relationship and the ability to balance their separateness and togetherness. Couple Flexibility measures the ability of a couple to change when necessary. Communication focuses on the level of comfort involved when sharing emotions and beliefs, and also their perception both of their own and the other's ability to listen and communicate. The psychometric properties of the measure were suitable. Internal consistency estimates were high, ranging from 0.75 to 0.90, in a 1542-participant sample. Similar results were found for the test-retest procedure, with reliability ranging from 0.80 to 0.83 (Fowers and Olson, 1989; Fowers and Olson, 1993). Content validity and construct validity were suitable, and discriminant and concurrent validities have also been established (Fournier et al., 1983; Fowers and Olson, 1989).
- 3.
Symptom Checklist-90-Revised, SCL-90-R (Derogatis, 1977). This instrument comprises 90 items rated on a five-point Likert scale, ranging from 0 (not at all) to 4 (a lot or extremely). It assesses psychological adjustment based on nine psychopathological symptomatic dimensions (Somatization, Obsessive-compulsive, Depression, Anxiety, Phobic Anxiety, Hostility, Interpersonal Sensitivity, Paranoid Ideation and Psychoticism) and three global indexes of psychological discomfort (Global Severity Index, Positive Symptom Total and Positive Symptom Distress Index). For this research, only the Hostility and Interpersonal Sensitivity subscales from the Spanish adaptation of González de Rivera et al. (1988) were used. This adaptation has good reliability estimates (higher than 0.70, even attaining scores of 0.90). According to De las Cuevas and González de Rivera (1991), validity also seems to be good, due to its convergence with other instruments such as the Minnesota Multiphasic Personality Inventory (MMPI). The Interpersonal Sensitivity subscale comprises nine items that include feelings of shyness and embarrassment, a tendency to feel inferior to others, hypersensitivity to other people's opinions and attitudes, and discomfort and inhibition in interpersonal relationships. The Hostility subscale comprises six items that allude to thoughts, feelings and behaviours related to states of aggressiveness, anger, irritability, rage and resentment. These two subscales were considered a sign of relational difficulties in the couple.
The first step involved developing a Spanish version of the FACES-CV and the Communication-CV. The original versions of the subscales were submitted for translation and back-translation (Behling and McFillen, 2000) by analysing the conceptual equivalence and the items’ clarity of wording, as well as their conceptual and content equivalence. To this end, a bilingual English speaker translated the original subscales into Spanish. Afterwards, a native English speaker who did not know the original versions translated the Spanish versions back into English. In the third stage, both English versions were compared in order to assess the conceptual equivalence and analyse the content and apparent validity.
Following the above-mentioned step, this correlational cross-sectional study was developed at the QBARC. Once the study had been approved, a meeting was arranged with all the professionals who had maintained contact with the patients (gynaecologist, nurses, assistant nurses and psychologist) to inform them of the nature of the research and to ask for their collaboration in handing out the questionnaires to the couples.
The professional who handed out the questionnaire to each couple explained the purpose of the study to the participating couples and briefed them on the confidentiality of the data provided, the voluntary nature of the study and their freedom to withdraw from the research at any time. Once the questionnaires had been handed out, each partner was asked to complete them individually but simultaneously and with no time limit. They were also informed they could ask any questions that could arise when completing the questionnaires. The average time for each evaluation was about 30min per couple.
Statistical analysisTo conduct item analysis, the mean, standard deviation, skewness (Sk), kurtosis (K) and the correlation coefficient between the item and the global scale (rg) or subscale (rs) were measured, as well as the value of Cronbach's alpha coefficient if the item was removed from the global scale (α-g) or subscale (α-s). Then, the suitability of the correlation matrix was verified to ensure that it was factorizable using the Kaiser–Meyer–Olkin test (KMO) and the Bartlett sphericity test.
To validate the instrument based on the theoretical model, a confirmatory factor analysis (CFA) with covariance structural techniques using EQS (Bentler, 1995; Bentler and Wu, 1995) was conducted with each dimension and with the global model. Non-weighted least-square estimation was used to estimate the parameters. The chi-squared test (χ2) was used to evaluate the goodness of fit of the corresponding model, and this indicated the probability that the variation between the sampling variance and covariance matrix and the matrix resulting from the hypothesized model was random. In the event of non-compliance with multivariate normality, estimations were carried out by applying robust methods (Satorra, 2003; Satorra and Bentler, 2010).
Because the χ2 is sensitive to variations in sample size (Schermelleh-Engel et al., 2003), additional measurements of the goodness of fit of the model were used (Bentler and Wu, 1995), such as the root mean square error of approximation (RMSEA) and 90% confidence interval of RMSEA, which considers values below .05 to be adequate and those below .08 to be acceptable, the goodness-of-fit (GFI) and comparative fit (CFI) indexes, with values above .90, and the Akaike information criterion (AIC) to compare the models with different estimated parameters, for which lower values would indicate higher parsimony and would be eligible.
This last-mentioned model will be graphically represented and the parameters of structural relationships indicated using standardized factor coefficients and estimation errors. A significance level of p<.05 was chosen for a 95% reliability interval in order to interpret the results.
The reliability analysis was carried out using Cronbach's alpha coefficient. A fundamental measure was also used for the assessment of the measurement model, namely composite reliability. The optimum value of this coefficient is around 0.70 (Hair et al., 2006). The average variance extracted (AVE.) was also analysed, with values above .50 being considered optimum, although values above .35 might be deemed acceptable in Social Sciences (Arias, 2008; Hair et al., 2006).
In order to analyse the concurrent validity of the scales, they were correlated with the scores in Hostility and Interpersonal Sensitivity measured by the SCL-90-R. A negative correlation was expected such that couples with lower Cohesion, Adaptability and Communication scores would obtain the highest scores in relational difficulties.
All the analyses were carried out using the SPSS V.18 programme (Norusis, 2010), although the CFA was done using the EQS V.5 programme (Bentler, 1995; Bentler and Wu, 1995).
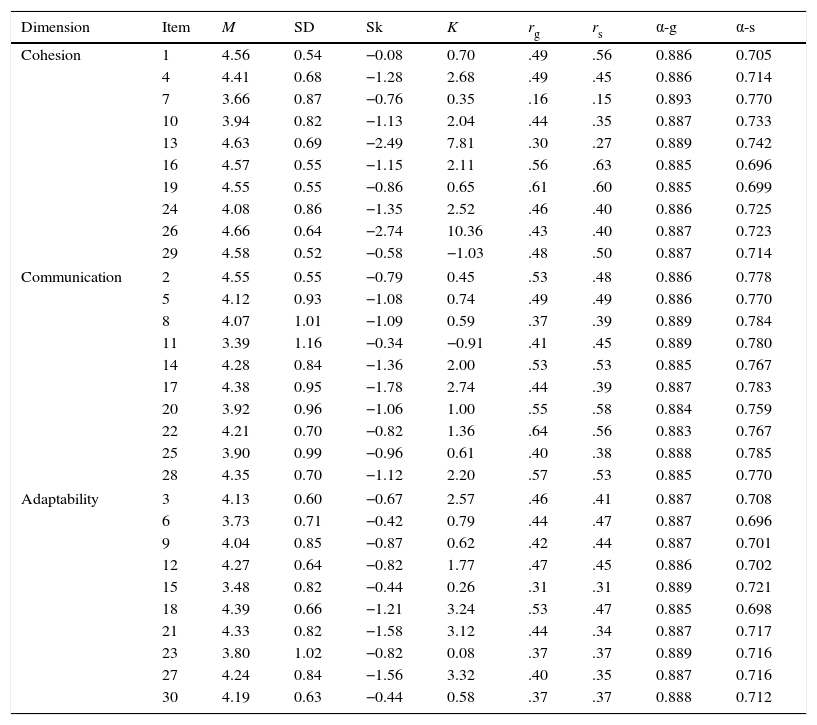
ResultsAnalysis of the distribution of items (Table 1) revealed that the participants’ responses tended to group towards the higher scores, showing negative skewness. The dispersion of responses was similar in all items, and the mean correlation of items with the scale was moderate (r=.45). However, not all the items contributed substantially to the scale. For example, Items 7, 13 and 15 showed correlations with the scale below .35. In addition, Items 13 and 26 displayed very high skewness and kurtosis values, indicating great uniformity of responses in the items clumped together at the lowest values. However, skewness and kurtosis values were generally high, following this trend. The reliability of the global scale did not increase when any of the items were discarded.
Descriptive analysis of the items.
| Dimension | Item | M | SD | Sk | K | rg | rs | α-g | α-s |
|---|---|---|---|---|---|---|---|---|---|
| Cohesion | 1 | 4.56 | 0.54 | −0.08 | 0.70 | .49 | .56 | 0.886 | 0.705 |
| 4 | 4.41 | 0.68 | −1.28 | 2.68 | .49 | .45 | 0.886 | 0.714 | |
| 7 | 3.66 | 0.87 | −0.76 | 0.35 | .16 | .15 | 0.893 | 0.770 | |
| 10 | 3.94 | 0.82 | −1.13 | 2.04 | .44 | .35 | 0.887 | 0.733 | |
| 13 | 4.63 | 0.69 | −2.49 | 7.81 | .30 | .27 | 0.889 | 0.742 | |
| 16 | 4.57 | 0.55 | −1.15 | 2.11 | .56 | .63 | 0.885 | 0.696 | |
| 19 | 4.55 | 0.55 | −0.86 | 0.65 | .61 | .60 | 0.885 | 0.699 | |
| 24 | 4.08 | 0.86 | −1.35 | 2.52 | .46 | .40 | 0.886 | 0.725 | |
| 26 | 4.66 | 0.64 | −2.74 | 10.36 | .43 | .40 | 0.887 | 0.723 | |
| 29 | 4.58 | 0.52 | −0.58 | −1.03 | .48 | .50 | 0.887 | 0.714 | |
| Communication | 2 | 4.55 | 0.55 | −0.79 | 0.45 | .53 | .48 | 0.886 | 0.778 |
| 5 | 4.12 | 0.93 | −1.08 | 0.74 | .49 | .49 | 0.886 | 0.770 | |
| 8 | 4.07 | 1.01 | −1.09 | 0.59 | .37 | .39 | 0.889 | 0.784 | |
| 11 | 3.39 | 1.16 | −0.34 | −0.91 | .41 | .45 | 0.889 | 0.780 | |
| 14 | 4.28 | 0.84 | −1.36 | 2.00 | .53 | .53 | 0.885 | 0.767 | |
| 17 | 4.38 | 0.95 | −1.78 | 2.74 | .44 | .39 | 0.887 | 0.783 | |
| 20 | 3.92 | 0.96 | −1.06 | 1.00 | .55 | .58 | 0.884 | 0.759 | |
| 22 | 4.21 | 0.70 | −0.82 | 1.36 | .64 | .56 | 0.883 | 0.767 | |
| 25 | 3.90 | 0.99 | −0.96 | 0.61 | .40 | .38 | 0.888 | 0.785 | |
| 28 | 4.35 | 0.70 | −1.12 | 2.20 | .57 | .53 | 0.885 | 0.770 | |
| Adaptability | 3 | 4.13 | 0.60 | −0.67 | 2.57 | .46 | .41 | 0.887 | 0.708 |
| 6 | 3.73 | 0.71 | −0.42 | 0.79 | .44 | .47 | 0.887 | 0.696 | |
| 9 | 4.04 | 0.85 | −0.87 | 0.62 | .42 | .44 | 0.887 | 0.701 | |
| 12 | 4.27 | 0.64 | −0.82 | 1.77 | .47 | .45 | 0.886 | 0.702 | |
| 15 | 3.48 | 0.82 | −0.44 | 0.26 | .31 | .31 | 0.889 | 0.721 | |
| 18 | 4.39 | 0.66 | −1.21 | 3.24 | .53 | .47 | 0.885 | 0.698 | |
| 21 | 4.33 | 0.82 | −1.58 | 3.12 | .44 | .34 | 0.887 | 0.717 | |
| 23 | 3.80 | 1.02 | −0.82 | 0.08 | .37 | .37 | 0.889 | 0.716 | |
| 27 | 4.24 | 0.84 | −1.56 | 3.32 | .40 | .35 | 0.887 | 0.716 | |
| 30 | 4.19 | 0.63 | −0.44 | 0.58 | .37 | .37 | 0.888 | 0.712 | |
α=0.890. KMO=.91. Bartlett sphericity test 3854.616. p<.05.
Note: M: mean; SD: standard deviation; Sk: asymmetry; K: kurtosis; rg: correlation coefficient for the item with the rest of the scale; rs: correlation coefficient for the item with the subscale to which it belongs; α-g: reliability coefficient value for the total scale if the item is withdrawn; α-s: reliability coefficient of the subscale if the item is withdrawn; α: global reliability coefficient; KMO: Kaiser–Meyer–Olkin test.
In the case of the Cohesion subscale, the average correlation of items was moderate (r=.43), but again Items 7 and 13 showed very low correlations. The elimination of Item 7 contributed positively to the internal consistency of the subscale. In the Communication subscale, the average correlation of items with the subscale was .48, and none of the items had any correlation below .35, nor did the removal of any item contribute to the internal consistency of the subscale. The average correlation of items with the Adaptability subscale was moderate (r=.40), with Item 15 providing the lowest contribution.
The global scale showed a high level of internal consistency (α=0.89) and, according to the KMO and Bartlett sphericity tests, the correlation matrix could be factorized.
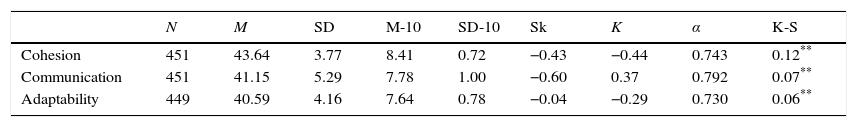
Table 2 summarizes the descriptive features of the dimensions analysed. Using a 10-point scale, it can be concluded that participants reported high levels of Cohesion (M=8.41, SD=0.72), Communication (M=7.78, SD=1) and Adaptability (M=7.64, SD=0.78) in their relationships. The skewness of the subscales was negative in all cases, although the values were close to 0, indicating a slight grouping at the higher values. The kurtosis was negative in the Cohesion and Adaptability dimensions, indicating the presence of extreme scores.
Internal consistency and descriptive characteristics of the subscales.
| N | M | SD | M-10 | SD-10 | Sk | K | α | K-S | |
|---|---|---|---|---|---|---|---|---|---|
| Cohesion | 451 | 43.64 | 3.77 | 8.41 | 0.72 | −0.43 | −0.44 | 0.743 | 0.12** |
| Communication | 451 | 41.15 | 5.29 | 7.78 | 1.00 | −0.60 | 0.37 | 0.792 | 0.07** |
| Adaptability | 449 | 40.59 | 4.16 | 7.64 | 0.78 | −0.04 | −0.29 | 0.730 | 0.06** |
Note: N: number of participants; M: mean; SD: standard deviation; M-10: mean on 0–10 scale; SD-10: standard deviation on 0–10 scale; Sk: asymmetry; K: kurtosis; α: coefficient of reliability; KS: Kolmogorov–Smirnov test.
The internal consistency coefficients yielded suitable values in all cases, with values of 0.74 for Cohesion, 0.79 for Communication and 0.73 for Adaptability. The normality test was significant in all three dimensions, suggesting a violation of this assumption. With large sample sizes, it is very easy to obtain significant results in the Kolmogorov–Smirnov test with only small deviations from normality, and so, taking into account the features of the sample, the extent of non-normality was questioned.
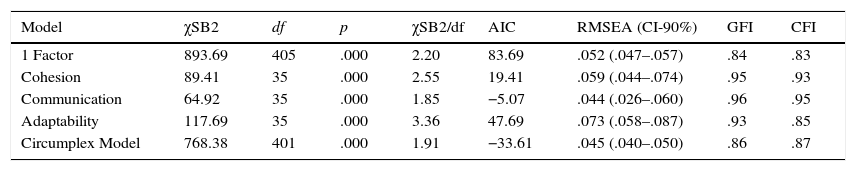
As the KMO and Bartlett sphericity tests had established that the correlation matrix could be factorized, a CFA was then carried out. Firstly, the fit was tested for the single-factor model, and as this proved inadequate, the fit was tested on data pertaining to each model separately. Lastly, the structure of the three factors was ascertained, in which Cohesion and Adaptability are subsumed in a second-order factor that is related to the Communication factor, in accordance with the circumplex model (Table 3).
Summary of the confirmatory factor analysis.
| Model | χSB2 | df | p | χSB2/df | AIC | RMSEA (CI-90%) | GFI | CFI |
|---|---|---|---|---|---|---|---|---|
| 1 Factor | 893.69 | 405 | .000 | 2.20 | 83.69 | .052 (.047–.057) | .84 | .83 |
| Cohesion | 89.41 | 35 | .000 | 2.55 | 19.41 | .059 (.044–.074) | .95 | .93 |
| Communication | 64.92 | 35 | .000 | 1.85 | −5.07 | .044 (.026–.060) | .96 | .95 |
| Adaptability | 117.69 | 35 | .000 | 3.36 | 47.69 | .073 (.058–.087) | .93 | .85 |
| Circumplex Model | 768.38 | 401 | .000 | 1.91 | −33.61 | .045 (.040–.050) | .86 | .87 |
Note: χSB2: Satorra–Bentler chi-square test; df: degree of freedom; p: probability value; χSB2/df ratio of Satorra–Bentler chi square to its degrees of freedom; AIC: Akaike Information Criterion; RMSEA (CI-90%): Root Mean Squared Error of Approximation (90% Confidence Interval); GFI: Goodness of Fit Index; CFI: Comparative Fit Index.
The measurement models of each subscale separately showed a suitable fit, with goodness-of-fit indexes above .90 both in Cohesion and Communication. In Adaptability, the values were slightly lower. Although the RMSEA exceeded the optimum value of .05 in the Cohesion and Adaptability factors, it was found to be within the range deemed acceptable (.05–.08). The data did not seem to fit the Adaptability factor, although deviations were minimal.
The data also showed an acceptable fit for the three-factor model, in coherence with the circumplex model. Although the GFI and CFI failed to reach .90, they obtained values close to this, and the RMSEA and the χSB2/df both obtained optimum values.
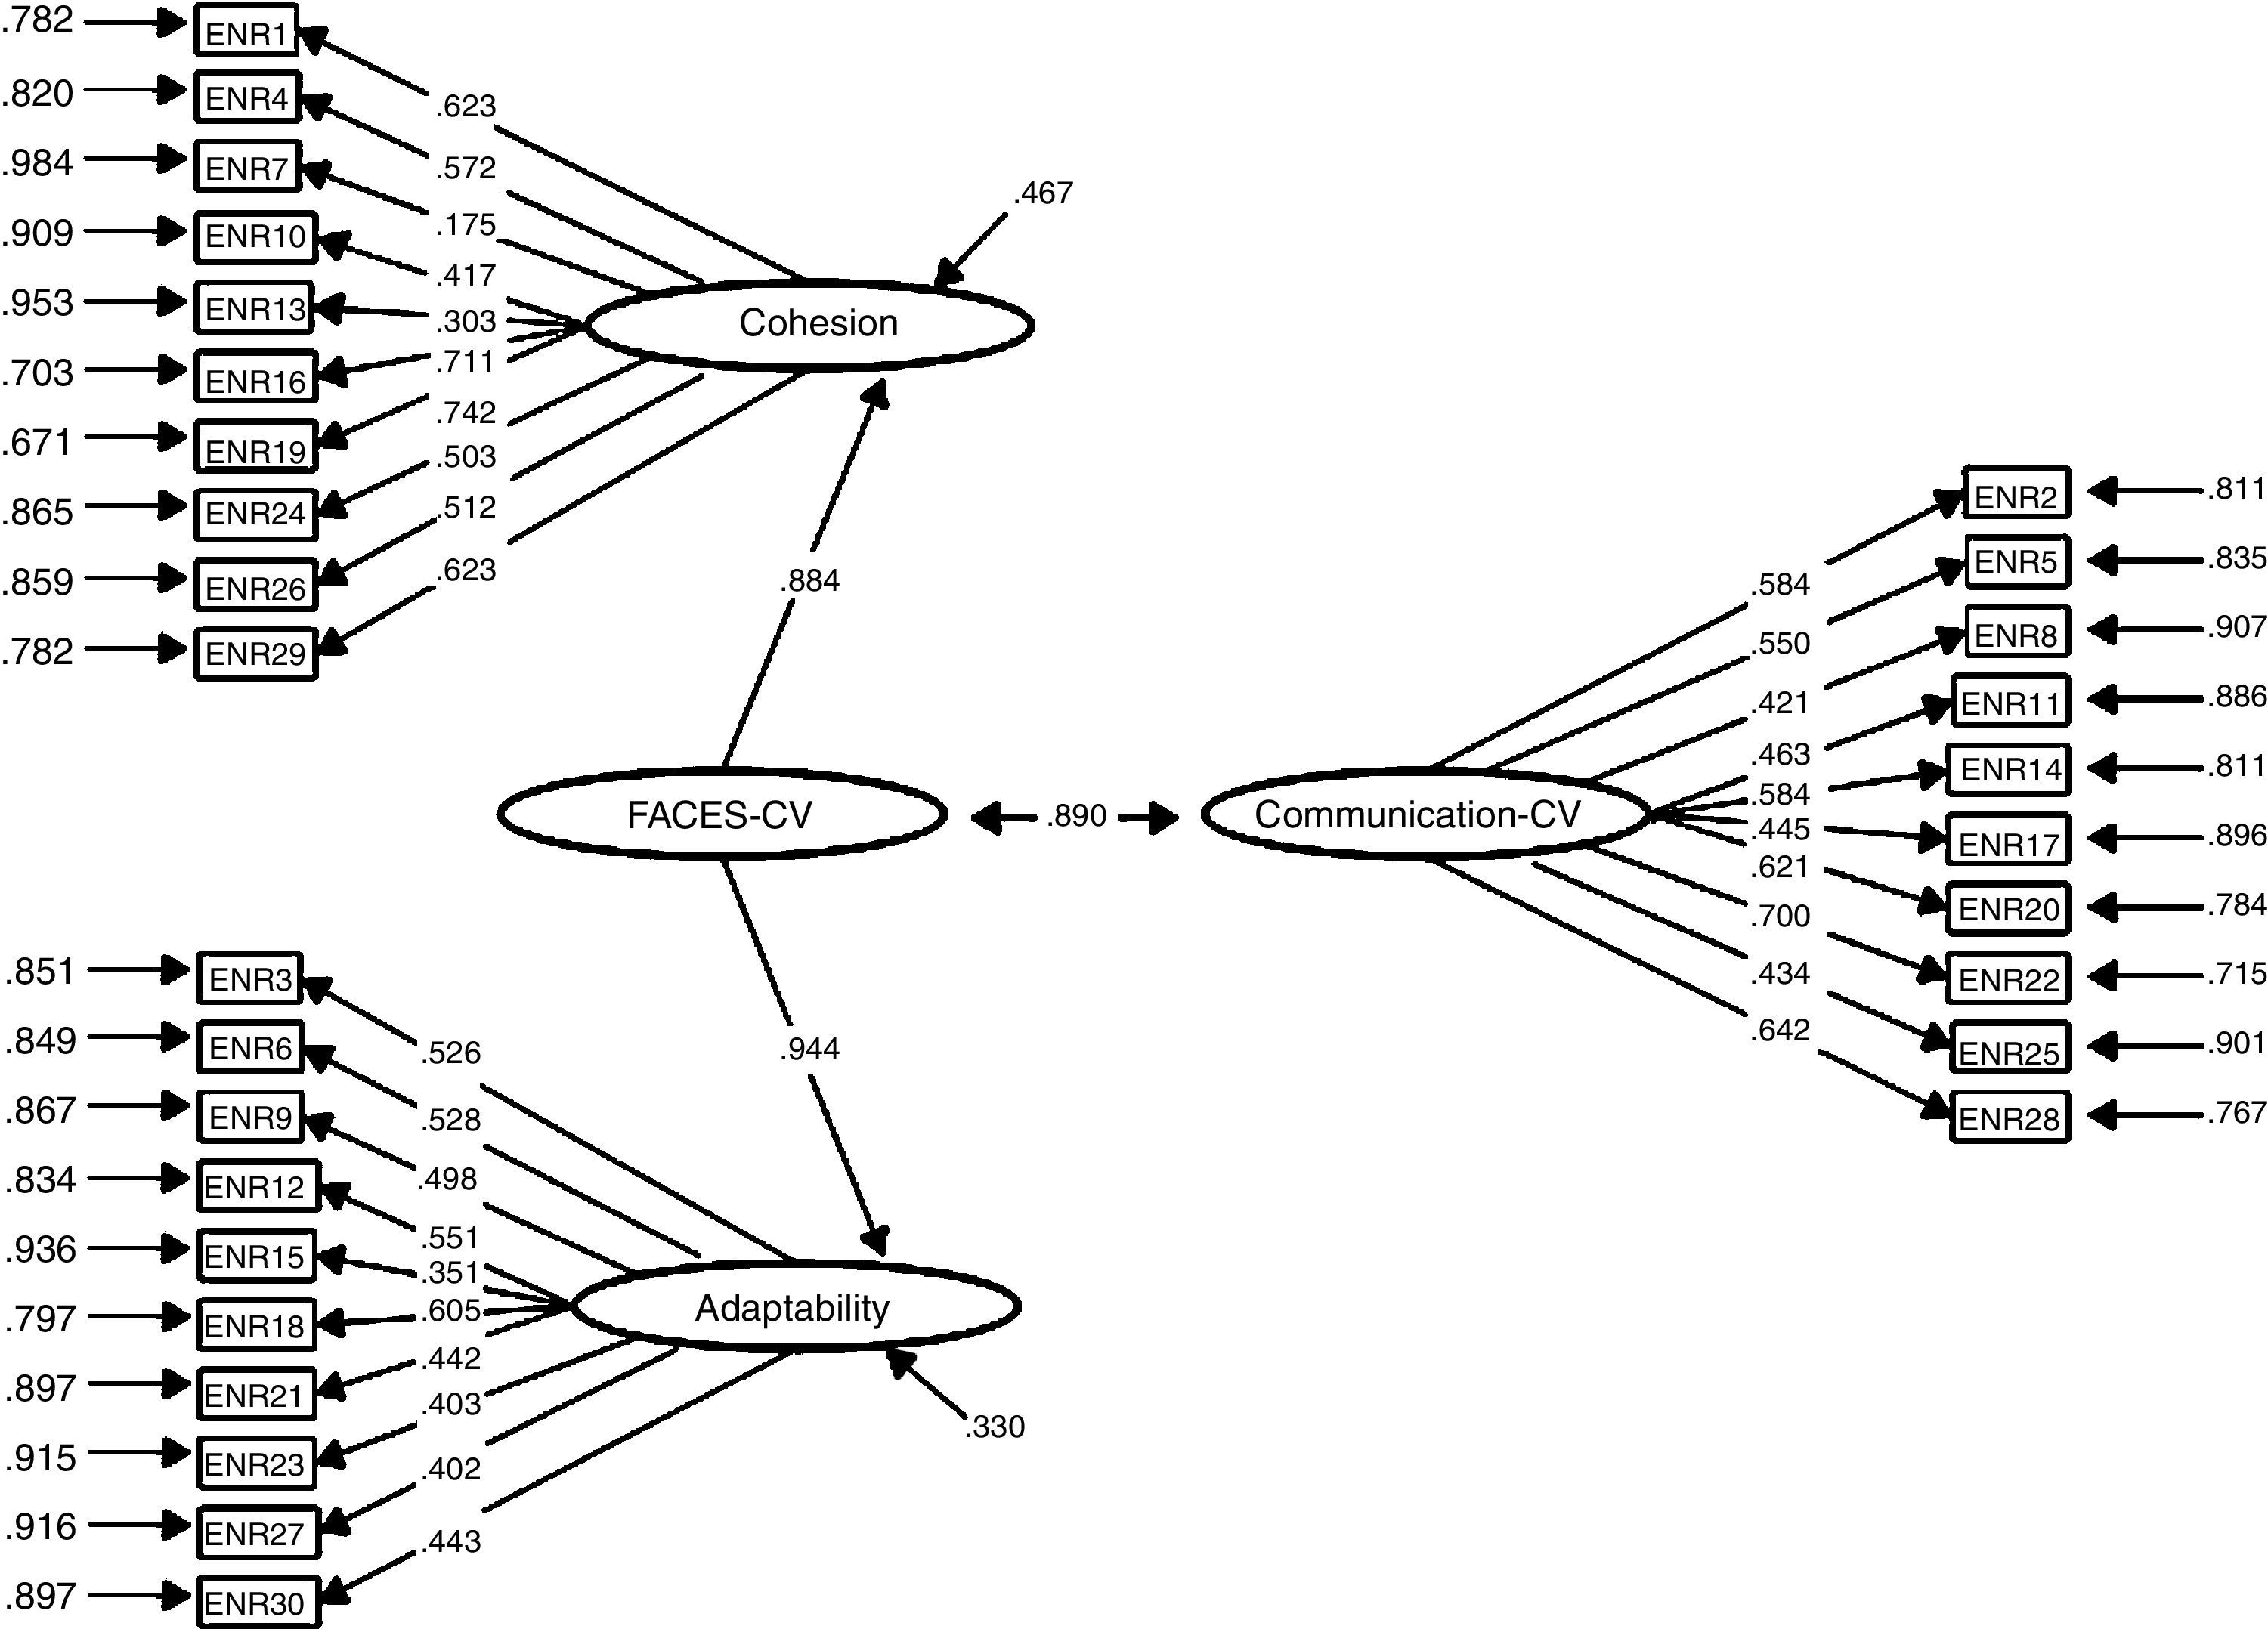
Analysis of the standardized structural coefficients for this model revealed that Items 7, 8, 10, 13, 15, 23 and 27 showed values significantly below .50, which is considered the optimal value. However, all standardized structural coefficients proved to be statistically significant. The estimated factor correlation between the factor comprising Cohesion and Adaptability and the Communication factor was .89 (Fig. 1).

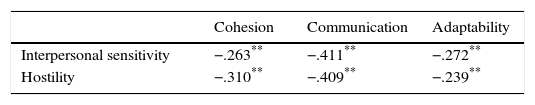
Composite reliability (0.96) and AVE (.50) for the instrument exceeded acceptable values for Social Sciences. As expected, we found a significant correlation between the three subscales and the Hostility and Interpersonal Sensitivity dimensions regarding functioning in interpersonal relationships. Correlation coefficients are shown in Table 4.
DiscussionThe purpose of the present study was to assess the quality of couple relationships in people with fertility problems via the adaptation of the subscales Cohesion, Adaptability and Communication of the ENRICH Marital Inventory. The Cohesion and Adaptability subscales constitute the FACES-CV, and the Communication subscale corresponds to Communication-CV. The aforementioned subscales enable us to deepen our knowledge about couple functioning from the perspective of the circumplex model of marital and family systems, a family functioning model that is highly supported by over 1200 studies (Olson, 2011). After completing the translation, conceptual adaptation to the cultural context and the back-translation of the subscales, an empirical study was carried out through the assessment of 452 patients from the QBARC, developing as a result a suitable version for Spanish couples with fertility problems.
These three subscales comprise ten items each. Some of the items, especially those from the Cohesion subscale, showed high levels of both skewness and kurtosis. These high coefficients can be explained by the participants’ characteristics: couples with an unsatisfied gestational desire who attend a private clinic in order to initiate an assisted reproduction treatment. Among the couples who have been unsuccessfully trying to have a child for a long time and who are requesting medical assistance – with the psychological and physical issues involved and financial expense that assisted reproduction entails – there may be an over-representation of couples who enjoy a healthy relationship and share a common life project, displaying high scores in Cohesion, Adaptability and Communication.
Taking into account other criteria used for analysing the functioning of the items – the correlation coefficient of the item with the global scale and with its corresponding subscale and the significant increase in the reliability coefficient when discarding the item – three items (Items 7, 13 and 15) displayed less acceptable functioning. This poorer performance may be explained by the differences that these items reflect in terms of content. Item 7 refers to the time devoted by a couple to friends or relatives, while Item 13 deals with jealousy in the relationship. Both items belong to the Cohesion subscale, but are far from what the marital cohesion construct represents. Lastly, in the case of Item 15 (“We try out new ways of tackling problems”) corresponding to Adaptability, the same thing occurs. This item is related to the couple's capacity for adaptation, although it might be more representative of other constructs such as Creativity or Dealing with problems.
However, despite the inappropriate psychometric functioning of these items, due to the relevance of their content and the information they provide at a clinical level and the original approach of the authors, it was decided to preserve the complete subscales. Furthermore, the reliability coefficients for the three subscales support this decision. The reliability of the global scale proved to be very high.
After analysing item distribution, three models were tested via CFA. Taking into account that the model coherent with the circumplex model (the Cohesion and Adaptability factors subsumed in a single factor, FACES-CV, with regard to the Communication factor, Communication-CV) is consistent with literature on the subject and with the theoretical model used to understand the quality of the couple's relationship, it was decided that this would be the model of choice. The goodness-of-fit indexes for this model were suitable, especially in the case of RMSEA and χSB2/df. Moreover, this model showed adequate structural coefficients, except for the case of Item 7.
The composite reliability index value showed great internal consistency in terms of the construct indicators; that is, they indicate the latent construct to a high degree. The AVE, which measures the portion of item variance explained by the latent variable, attained acceptable values.
The last analyses were carried out to assess concurrent validity, for which purpose the subscales were correlated with two of the SCL-90-R dimensions: Hostility and Interpersonal Sensitivity. All correlations found were low-moderate, negative and statistically significant. As expected, when Cohesion, Adaptability and Communication are higher, Interpersonal Sensitivity and Hostility are lower.
As pointed out in the Introduction, despite the fact that several studies have used the ENRICH to assess couples with fertility problems, the outcomes of these studies have not been analysed in relation to the circumplex model (Borneskog et al., 2012; Katiraei et al., 2010). Therefore, there are no data with which to compare the results of this study.
The results obtained in this study may be influenced by some of its methodological limitations. The first of these limitations are the characteristics of the participants. All of them were patients from the same assisted reproduction centre: a private clinic in Bilbao (Spain) attending clients with a probable medium to high socio-economic status. The heterogeneous nature of the sample is limiting in this sense. Social desirability may also have influenced the high scores obtained. Most of the participants completed the questionnaires prior to initiating their assisted reproduction treatment and they may have given positive responses for fear of being denied the chance to start such treatment if they were considered to have a low-quality or conflictive couple relationship.
Therefore and in order to overcome the aforementioned limitations, it is recommended to continue working on the scales in future studies. It is suggested that the sample size should be increased to achieve higher heterogeneity, so as to obtain more robust results. It would also be interesting to control social desirability through some additional measures and complement the information gathered with in-depth interviews with the couples. The functioning of Items 7, 13 and 15 needs to be reviewed in subsequent studies.
In short, the Spanish versions of FACES-CV and Communication-CV attached to the ENRICH Marital Inventory seem to be valid and reliable measures of a couple's relationship in people with fertility problems. Their psychometric properties are suitable and their factor structure enables us to understand the results from the circumplex model perspective.
The theoretical and clinical relevance of studying the couple relationship in cases where there are fertility problems provides added value to the Spanish adaptation of the FACES-CV and Communication-CV. These scales offer a quick and simple assessment of three fundamental dimensions like cohesion, adaptability and communication in marital relationships. These brief scales may help to detect possible problems in the dyadic relationship and to plan psychotherapeutic intervention to deal with the most conflictive areas of the couple relationship in order to promote suitable conditions during the assisted reproduction process.
Ethical disclosuresProtection of human and animal subjectsThe authors declare that no experiments were performed on humans or animals for this investigation.
Confidentiality of dataThe authors declare that no patient data appears in this article.
Right to privacy and informed consentThe authors must have obtained the informed consent of the patients and/or subjects mentioned in the article. The author for correspondence must be in possession of this document.
Conflict of interestThe authors declare no conflict of interest.
We thank all patients for their participation and Quirón Bilbao Assisted Reproduction Centre for permission to collect data. We will also like to extend our gratitude to the Faculty of Psychology and Education and to OTRI/DEIKER at the University of Deusto.
