


Nonalcoholic fatty liver disease (NAFLD), an emerging clinical entity with worldwide recognition, is today the most common cause of abnormal liver function tests among adults in the United States. In Mexico City, its prevalence has been reported by our group to be around 14%, but its incidence is higher in the hispanic population in the United States (hispanic population 45%, white population 33%, black population 24%). The main issues in the diagnosis, follow-up, and management of NAFLD are our limited understanding of its pathophysiology and the difficulties involved in developing a noninvasive diagnostic method. Several imaging techniques can detect fatty infiltration of the liver, each with its own advantages and disadvantages. Ultrasound is still in the first option for diagnosis, but its accuracy depends on the operator and the patient’s features. Computed tomography can detect hepatic fat content, but only at a threshold of 30%, and it involves ionizing radiation. Magnetic resonance (MR) spectroscopy is probably the most accurate and fastest method of detecting fat, but it is expensive and the necessary software is still not easily available in most MRI units. MR elastography, a new technique to detect liver stiffness, has not been demonstrated to detect NAFLD, and is still undergoing research in patients with hepatitis and cirrhosis. In conclusion, all these imaging tools are limited in their ability to detect coexisting inflammation and fibrosis. In this review, we discuss the radiological techniques currently used to detect hepatic fat content.
Nonalcoholic fatty liver disease (NAFLD) occurs at a high frequency in the general population (13–34%).1,2 In Mexico City, its prevalence has been reported by our group to be around 14%,3 but its incidence is higher in the hispanic population living in the United States (hispanic population 45%, white population 33%, black population 24%).4 Today, NAFLD is the most common cause of abnormal liver function tests among adults in United States,4-8 and will be the second most important cause of liver disease in the future, with an impact higher than that of infectious diseases.9
NAFLD is characterized by the accumulation of fat (predominantly triglycerides), constituting more than 510% of the liver weight,1 and asymptomatic, mild elevations of serum aminotransferase levels, in the absence of excessive alcohol intake or other chronic liver diseases.10,11 It is also common among patients with insulin resistance (such as that observed in type 2 diabetes mellitus), high plasma leptin levels,12,13 low levels of adiponectin,12,14,15 hyperlididemia,13 and obesity,6,13,15,16 all of which are components of the metabolic syndrome.15,17 As the prevalence of obesity increases, the prevalence of NAFLD is increasing worldwide, making it potentially the most common form of chronic liver disease.10,18
The Mexican population has a high incidence of over-weight19 (up to 70% of adults between 30 and 60 years of age) and obesity (around 30% of adults older than 20 years).19,20 Mexicans are also susceptible to the insulin resistance associated with obesity (the phenotype known as the «metabolic syndrome»).21 It has been suggested that insulin resistance is involved in the pathogenesis of NAFLD. In Mexico, type 2 diabetes mellitus is the first and second causes of death in women and men, respectively, and the prevalence of NAFLD in patients with type 2 diabetes mellitus may be as high as 100%.22 The subclinical nature of NAFLD has led to increased efforts to facilitate its diagnosis and to prevent its potential progression to nonalcoholic steatohepatitis (NASH), liver cirrhosis, and hepatocellular carcinoma.23
From a previous study that suggested a total hepatic fat fraction of 30% in living transplantation donors,24 we have a reference for the maximum acceptable percentage of fat in clinical practice. The main issues in the diagnosis, follow-up, and management of NAFLD are the difficulties involved in developing a noninvasive diagnostic method and our limited understanding of its pathophysiology. Traditionally, the assessment of liver fat infiltration has been based on a liver biopsy, because the histological determination of fat content in liver biopsy specimens is accepted as the gold standard in the evaluation of donors for split liver transplantation. However, the biopsy procedure is often painful,25 requires bed rest for 6-8 h,26 and is associated with discomfort because of its invasive nature, risk of infection, and biliary leakage. More serious drawbacks include bleeding and even a low mortality risk.27 Biopsies are also subject to sampling error because less than 1/50,000th of the liver is available for histological analysis.28 Furthermore, liver biopsies may not accurately reflect the degree of hepatic steatosis when the distribution of fat infiltration is heterogeneous.29,30
Noninvasive imaging techniques, such as ultrasound (US), computed tomography (CT), magnetic resonance imaging (MRI), and proton magnetic resonance spectroscopy (MRS), can detect fatty infiltration of the liver, but they are limited in their ability to detect coexisting inflammation or fibrosis.28 We discuss the main radiological modalities used in the diagnosis of increased fat accumulation (steatosis) in the hepatic parenchyma.
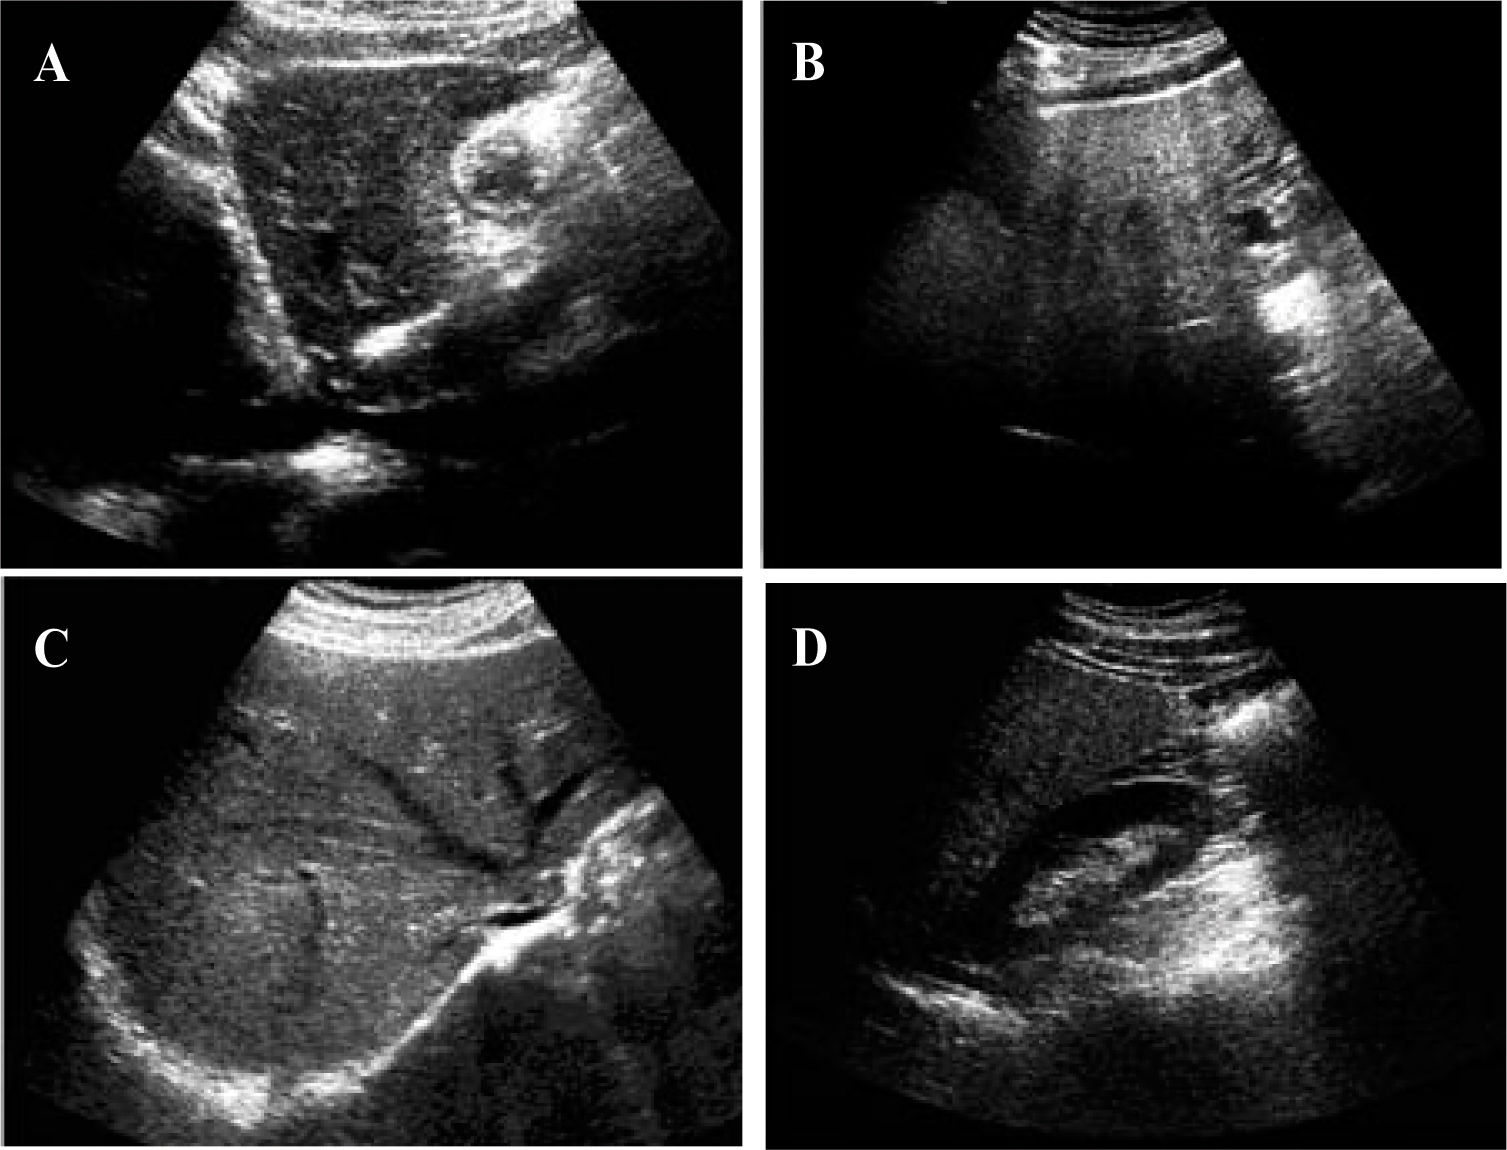
UltrasoundUltrasound is much more accessible than CT or MRI, is less expensive, and allows a qualitative assessment of hepatic fat. In abdominal US evaluations, steatosis appears bright or hyperechoic relative to the adjacent right kidney or spleen.31,32 The sensitivity of US increases with increasing degrees of steatosis.33Mild steatosis is characterized by a mild increase in liver echogenicity. Moderappears as increased liver echogenicity that obscures the hepatic and portal vein walls (Figure 1). In severe steatosis, there is posterior attenuation of the deep liver parenchyma, which is useful in diagnosing steatosis of more than 30%.34 However, the ultrasonographic evaluation of steatosis does not exactly match the histo-pathological quantification of steatosis, so accurate quantification of steatosis is not feasible with the current technology. The degree of fatty infiltration is based upon a visual assessment of the intensity of the echogenicity:10 grade 0, normal echogenicity; grade 1, slight, diffuse increase in fine echoes in the liver parenchyma, with normal visualization of the diaphragm and intrahepatic vessel borders; grade 2, moderate, diffuse increase in fine echoes, with slightly impaired visualization of the intra-hepatic vessels and diaphragm; and grade 3, marked increase in fine echoes, with poor or no visualization of the intrahepatic vessel borders. However, the US method is somewhat subjective.28 In hepatitis accompanied by inflammation and fibrosis,35,36 the fibrosis may be hyperechoic. However, most of the time, fibrosis and fatty infiltration coexist in cirrhotic patients, in the so-called «fatty-fibrotic pattern».33,37

Characteristic appearance of liver steatosis. A and B, sagittal views of the left lobe of livers with grade 1 and grade 3 steatosis respectively. There is hyperechogenicity with deep attenuation, which makes visualization of the cava vein difficult. C, Hyperechoic liver parenchyma with partial visualization of the suprahepatic veins. D, Comparison of the echogenicity of the right kidney and the right lobe of the liver. The hepatic attenuation allows a qualitative diagnosis of moderate steatosis.
Several studies have assessed the sensitivity and specificity of US in detecting hepatic steatosis. The sensitivity ranged from 60 to 94% and the specificity from 84 to 95%.37-39 The operator dependency of ultrasound, its inability to precisely quantify the hepatic fat content, and its inability to detect small changes in liver fat with time all potentially limit its use in longitudinal clinical studies.28
Computed tomographySteatosis results in a reduction in the attenuation of the liver, which can be measured in Hounsfield units (HU) and appears as hypodense liver parenchyma.40-42 Unenhanced CT images are used for qualitative evaluations and the spleen is used as the reference organ for comparisons. Knowledge of the attenuation value in the healthy liver (50–57 HU) on noncontrast-enhanced CT, and its reduction by 1.6 HU for each milligram of triglycerides deposited per gram of hepatic tissue43 facilitates several methods of determining the appropriate CT values.44 These methods include the measurement of hepatic attenuation only45 and the normalization of the hepatic attenuation to the splenic attenuation, the measurement of the difference in attenuation between the liver and the spleen,46-48 and the calculation of the ratio of these values.41
The pattern of hepatic fatty changes can be graded as: 0, normal; 1, diffuse, homogeneous; 2, geographic pattern; 3, focal; and 4, focal sparing (pseudotumor, glove pattern, simulating metastasis). The severity of hepatic fatty infiltration is graded as: grade 0, normal; grade 1, liver attenuation slightly less than that of the spleen; grade 2, more pronounced difference between the liver and spleen, and the intrahepatic vessels are not visible or show slightly higher attenuation than that of the liver; and grade 3, markedly reduced liver attenuation, with sharp contrast between the liver and intrahepatic vessels.10
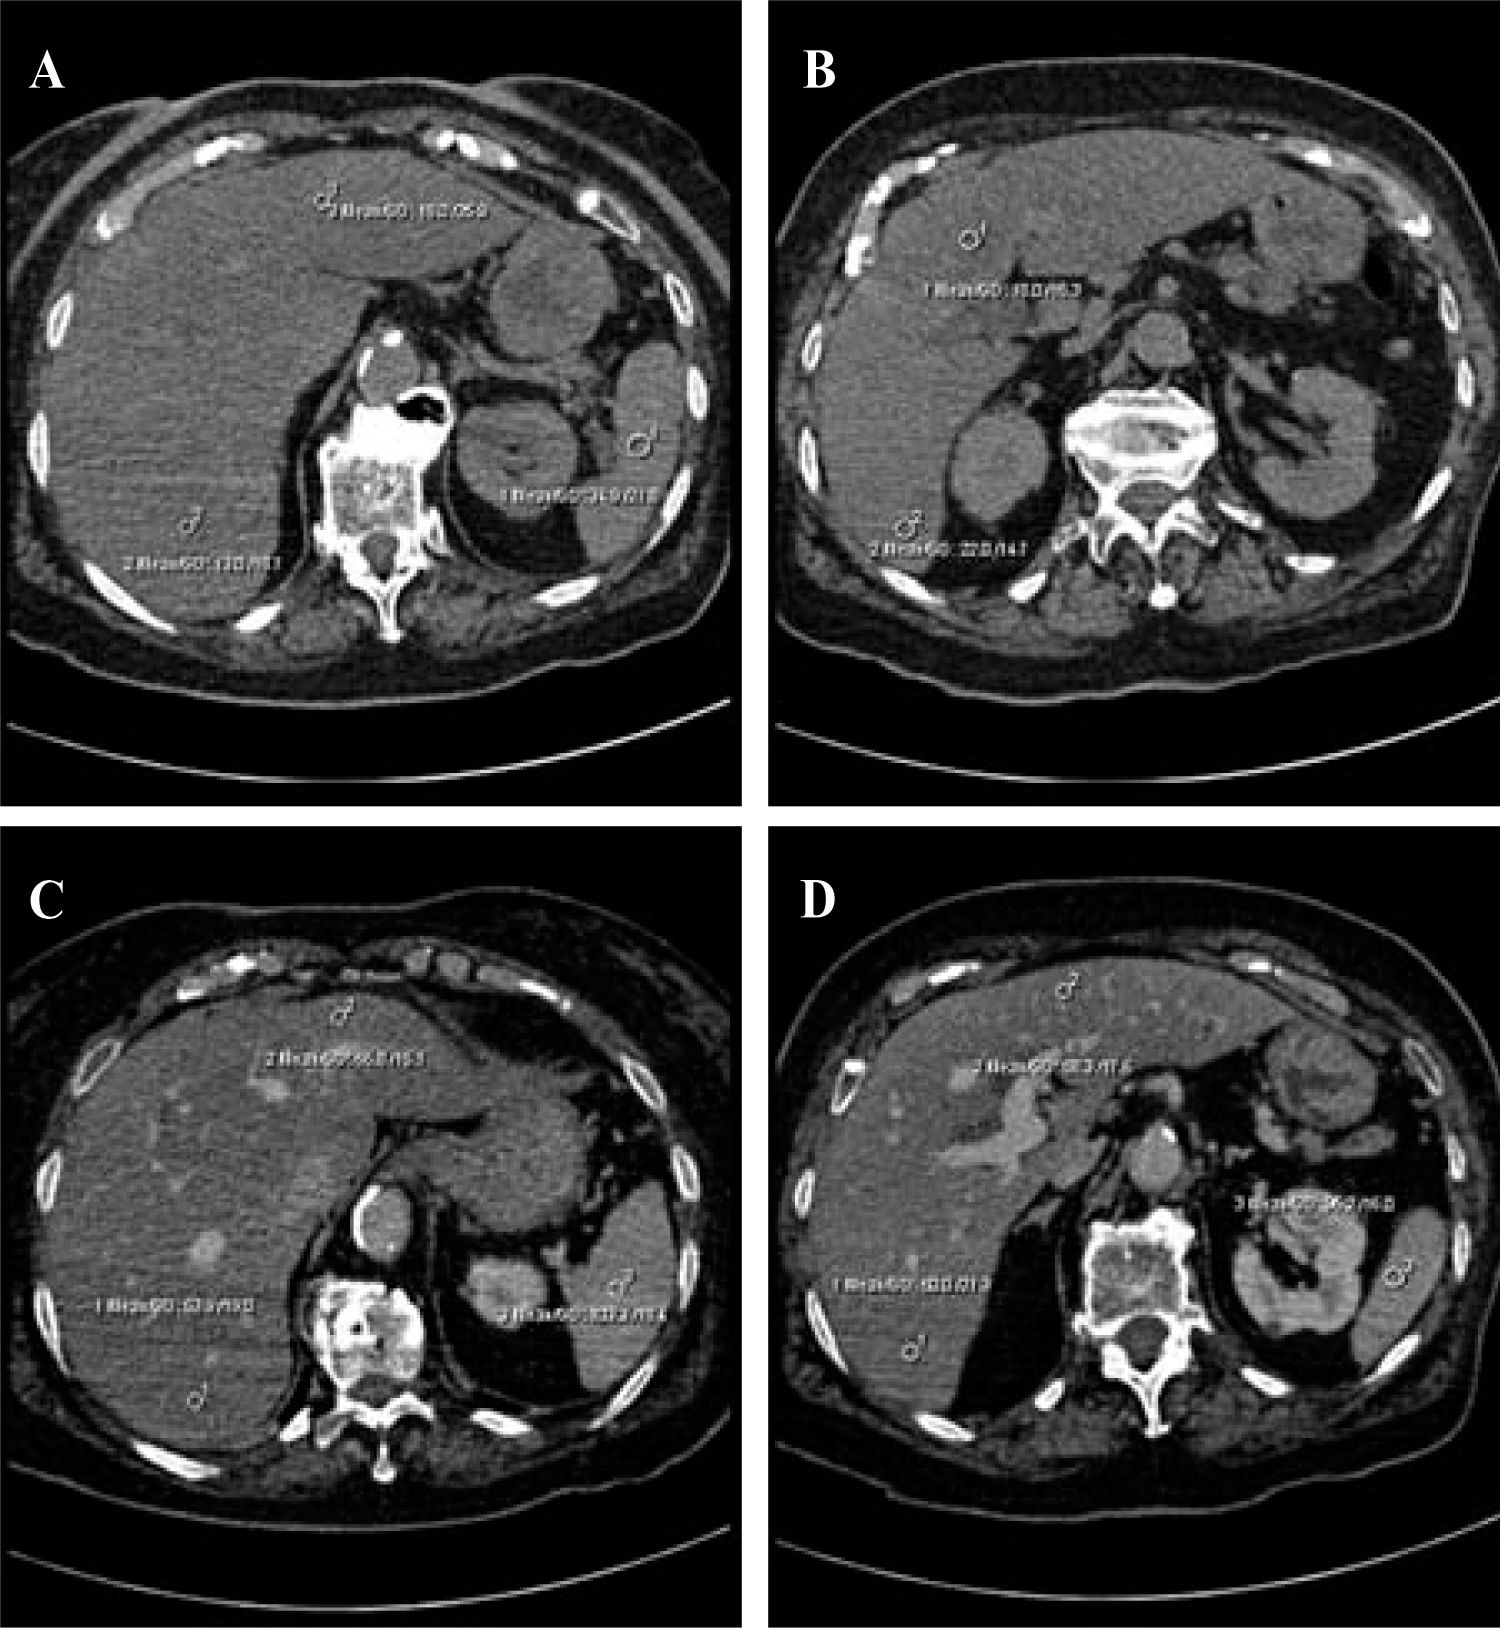
In quantitative evaluations, a spleen-to-liver attenuation ratio with a cut-off value of 1.1 has been proposed to exclude moderate steatosis.40 Calculating the difference between the attenuation of the spleen and that of the liver can also be used to evaluate steatosis. The attenuation of the spleen is approximately 8–10 HU less than that of the liver in a normal patient, whereas a liver-to-spleen attenuation difference greater than 10 HU is highly predictive of hepatic steatosis (Figure 2).46
 and the spleen (31 HU). The attenuation of the liver parenchyma is also 40 HU lower than the normal value, which is sufficient to allow a diagnosis of grade II steatosis. C–D, Enhanced CT in the portal phase. There is less enhancement of the liver parenchyma (53 HU) than of the hepatic vessels and the spleen (103 HU). Again, there is a difference of more than 10 HU in the spleen–liver attenuation values.")
Severe hepatic steatosis. A–B, Unenhanced CT. There is a difference greater than 10 HU between the attenuation values of the liver (13–18 HU) and the spleen (31 HU). The attenuation of the liver parenchyma is also 40 HU lower than the normal value, which is sufficient to allow a diagnosis of grade II steatosis. C–D, Enhanced CT in the portal phase. There is less enhancement of the liver parenchyma (53 HU) than of the hepatic vessels and the spleen (103 HU). Again, there is a difference of more than 10 HU in the spleen–liver attenuation values.
Enhanced CT has a limited role in the diagnosis of steatosis because of the influence of the contrast injection rate and the timing of the analysis of liver attenuation, which can significantly influence the optimal liver-minus-spleen attenuation difference necessary for a diagnosis of fatty liver.47,48 It has been suggested that muscle, rather than spleen, may be a better qualitative standard reference for diagnosing fatty liver on contrast-enhanced CT (the liver has a lower attenuation value than muscle),49 although such a comparison can only be made successfully if the degree of fatty infiltration is severe.28
From the assessment of hepatic steatosis in transplant donors, it has been concluded that unenhanced CT performs very well in diagnosing steatosis of 30% or more, with 100% specificity and 82% sensitivity (similar sensitivity is found with a liver/spleen attenuation ratio of 0.8 and a difference of 9 HU between the attenuations of the liver and spleen).50
However, the best method for predicting the pathological fat content of the liver with CT is the simple measurement of liver attenuation on unenhanced CT scans. Therefore, the attenuation measurement of the spleen does not contribute to the prediction of hepatic fat content.44 The use of these criteria can be helpful in avoiding biopsies for moderately steatotic livers.51
Other considerations in the use of CT include differences in the attenuation values of CT scanners obtained from different vendors. Even when using the same CT scanner, the attenuation of fat varies with the patient’s size and position, and with imaging artifacts, and can actually vary between images from a single patient.52 The small (less than 1 cm diameter) regions of interests (ROIs) used by some researchers could be changed to ROIs with larger diameters (still within the hepatic parenchyma, avoiding vessels and bile ducts), and this might be more accurate because, theoretically, a larger ROI value should give a more accurate result.44,53
It should be noted that up to 40% of patients with NASH may have an increased iron content in the liver,54 which will alter the hepatic attenuation on CT. Many of these patients also have increased levels of glycogen, which is known to increase the attenuation of the liver, further confounding attempts to quantify hepatic fat on the basis of attenuation.52 A recent study concluded that the diagnostic performance of unenhanced CT in the quantitative assessment of macrovesicular steatosis is not clinically acceptable.50 Moreover, CT scanning has the drawback of exposing subjects to ionizing radiation. These two factors limit its potential use in longitudinal studies and in children.
Magnetic resonance imaging and proton magnetic resonance spectroscopyThe nuclear magnetic resonance (MR) phenomenon was first reported by Bloch et al. in 1946.28 The clinical MR technique exploits the quantum mechanical property of spin behavior in hydrogen-1, a source of angular momentum intrinsic to nuclei with an odd mass number. When placed in a magnetic field, they behave like magnetic dipoles, aligning parallel to the applied static magnetic field. When excited with nonionizing radiofrequency energy, this alignment of the nuclei is disturbed. During relaxation, the nuclei return to their original orientation, giving off a radiofrequency signal, which is detected by a receiver coil. This signal is resolved by a computer-based mathematical process into either an image, providing anatomical information (MRI), or a frequency spectrum, providing biochemical information (MRS).55,56
In-/Out-of-Phase MethodThe sequence used for this purpose is a breathhold T1-weighted gradient-echo in-/out-of-phase sequence.57-59 This technique has been used to evaluate patients before living-related liver transplantation and has shown promise for the noninvasive evaluation of steatosis.29,60
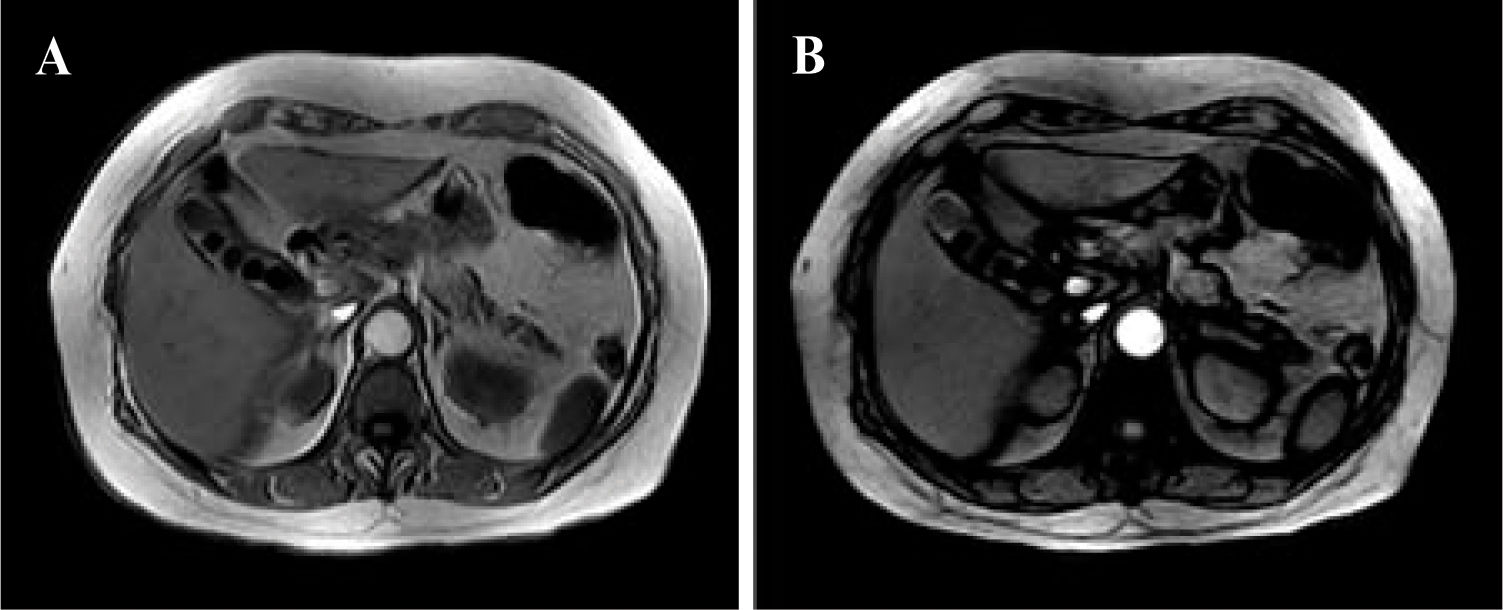
This sequence can be obtained with all types of MR scanners with different magnetic intensities including 0.5, 1, 1.5, and 3 T, but echo time (TE) values for the in and out phases decrease according to the magnetic power of the scanner. In the presence of steatosis, a signal drop is observed on the out-of-phase images because of the phase cancellation by fat and water (Figure 3).

Quantitative measure of signal loss from in-phase to opposed-phase images can be obtained by measuring an ROI in the left and right lobes (excluding vessels and areas of motion artifacts, to minimize partial volume effects) and calculating a ratio using the spleen as the internal reference. The ratio can be calculated with the following formula:
SDR • Lop/Sop/Lip/Sop
where SDR is the signal drop, Lop and Lip are the liver out-of-phase and in-phase signals, respectively, and Sop and Sip are the spleen out-of-phase and in-phase signals, respectively. The lower the ratio, the greater the signal drop and thus the higher the fat content.
With this method, the reported sensitivity is 100%, the specificity is 90.4%, the positive predictive value is 50%, the negative predictive value is 100%, and the overall accuracy is 91.2%.60 Recently, this sequence has been optimized for the quantitative measurement of the fat fraction in the liver by applying dual flip angles (20 and 70 degrees) to resolve the ambiguity of the dominant constituent.61
Proton MRSProton MRS allows the examination of the resonance frequencies of all hydrogen nuclei (protons) within an ROI.28 Although the absolute differences in resonance frequencies in MRS are quite small, the concentration of any given molecule in a sample is proportional to the area under the specific resonance peak within the spectrum. The MR spectra are plotted on an axis of chemical shift. Frequency separation, and hence spectral resolution, is determined by the strength of the main magnetic field. The quantification of hepatic fat using proton MRS requires the evaluation of the two dominant peaks within the unsuppressed MR spectrum, water at 4.7 ppm and lipid at 1.0-1.5 ppm.62 Saggital, coronal, and axial slices through the right lobe of the liver are acquired, and a small voxel of 27 cm3 volume is used, avoiding major blood vessels, intrahepatic bile ducts, and the lateral margins of the liver. After the system has been tuned and shimmed, the spectra are collected.4 Several studies have shown MRS to be a fast, safe, noninvasive method for the quantification of hepatic fat content (63-65), and the reported diagnostic precision is about 80%–85%, with 87–100% sensitivity.66
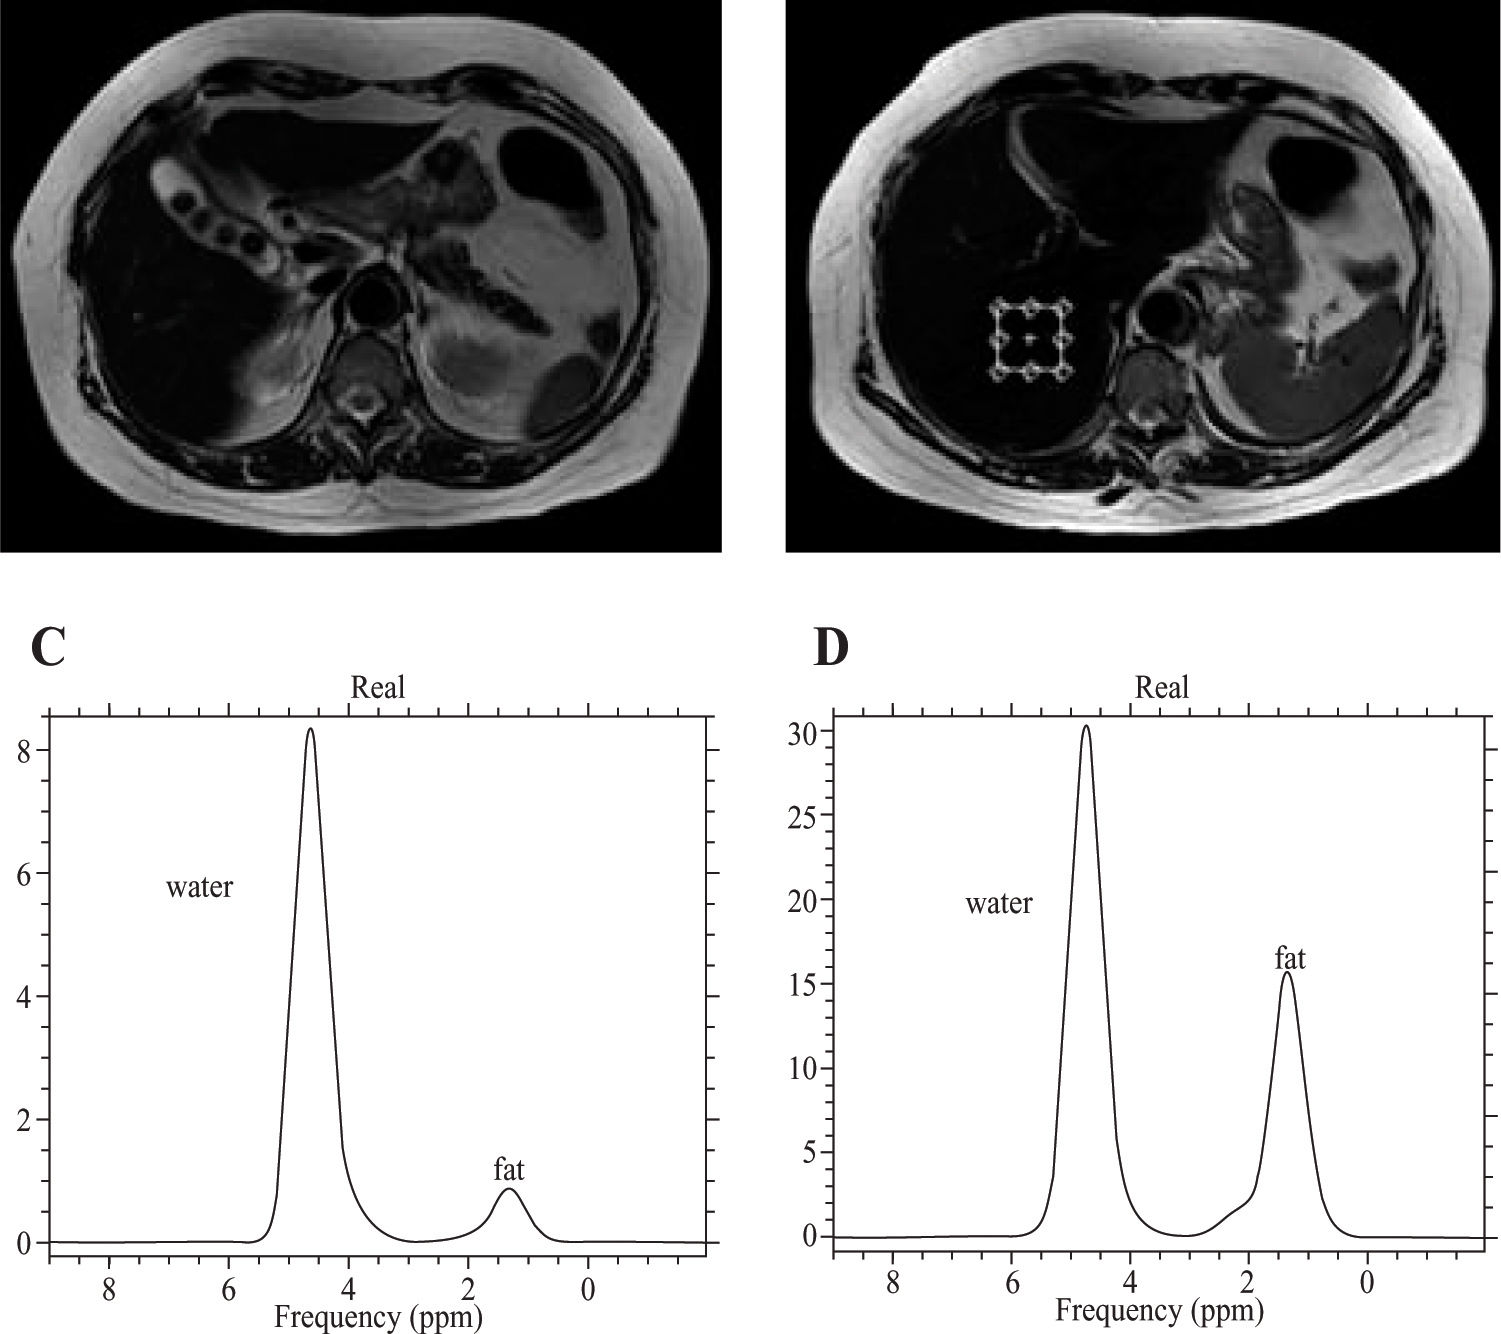
In the presence of hepatic steatosis, MRS shows an increase in the intensity of the lipid resonance peak (Figure 4). Because MRS allows the direct measurement of the area under the lipid resonance peak, it can be used to provide a quantitative assessment of fatty infiltration of the liver.

A, T2-weighted MR of the liver, axial plane. Cholelithiasis is apparent in a patient with grade I steatosis. B, Voxel location in the axial plane for the spectroscopic determination of the fat fraction. C, The spectrum shows water and fat peaks in grade I steatosis. D, Increase in the height and width of the peak for lipids in a patient with grade II steatosis. It is possible to calculate the area under the curve to measure the fat fraction.
Although these methods are used in the assessment of liver fibrosis, they can also be used in conjunction with the methods described above to further characterize pathologies such as NASH, which may have a significant fibrosis component.
These new diagnostic modalities address the physical properties of the liver.67Ex vivo and intraoperative studies have shown that liver elasticity correlates with the degree of fibrosis found in biopsy specimens and with the results of liver function tests.68-72 Ultrasonography-based techniques have been proposed for the noninvasive assessment of tissue elasticity,73-76 and in vivo measurement of liver fibrosis has proved feasible with some of these methods.74,77,78
The transient real-time elastography method is performed with an ultrasound transducer probe mounted on the axis of a vibrator.79 The vibration is transmitted toward the liver, inducing an elastic shear wave that propagates through the tissue. These propagations are followed by pulse-echo sonographic acquisitions, and the velocity of the propagation (directly related to tissue stiffness) is measured. The harder the tissue, the faster the shear wave propagates.79-82
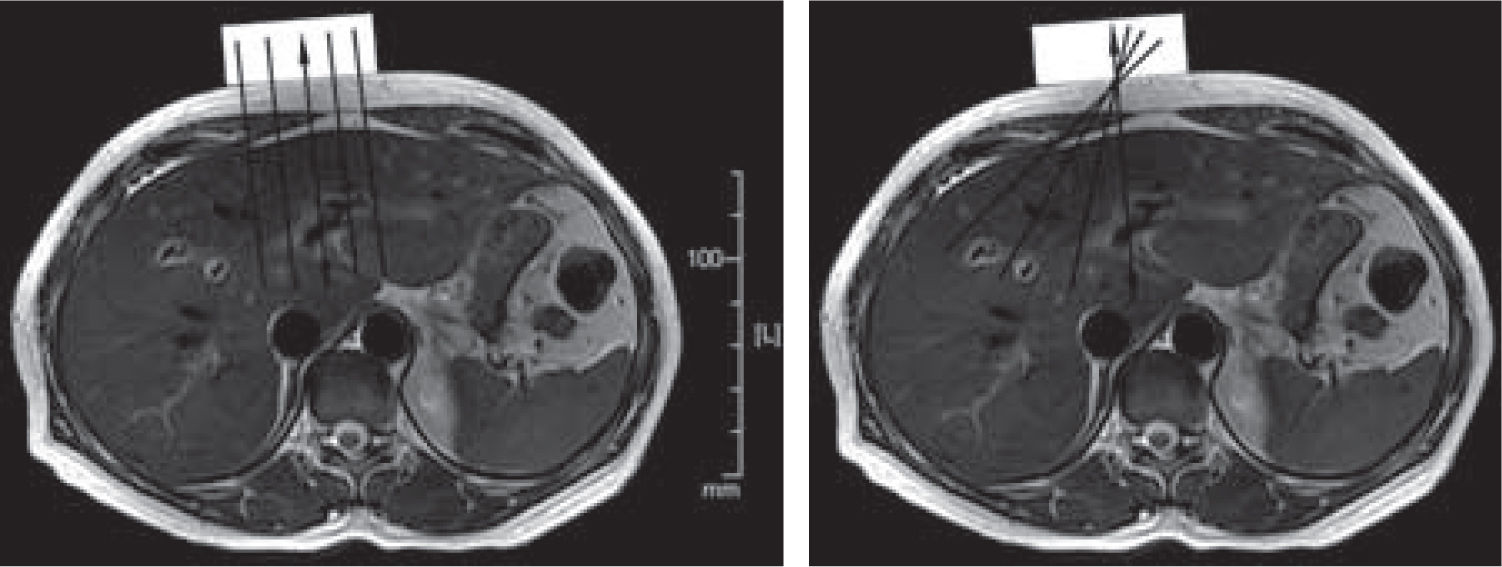
MR elastographyMR elastography uses a modified phase-contrast MRI sequence to visualize propagating shear waves in tissue83,84(Figure 5). For liver MRI, it uses a 90 Hz driving frequency. This relatively short wavelength allows several waves to be imaged in the anterior portion of the liver.85 Subcostal and transcostal approaches yield similar estimations of normal liver stiffness (1.9 and 2.1 kPa, respectively, for a 90 Hz driving frequency). However, the optimum frequency is yet to be determined.85 Lower frequencies are less attenuated and allow the estimation of stiffness in deeper portions of the liver. If liver shear stiffness is measured at several different frequencies, it should be possible, in principle, to calculate the shear viscosity of the liver tissue, which is potentially an independent parameter for tissue characterization.86 This technique has also been applied to quantitatively assess the viscoelastic properties of the breast, brain, and muscle in humans.87
 can be positioned below the ribs or against the anterior part of the rib cage. The shear waves reach only a limited part of the liver. The vibrational motion of the driver is perpendicular to its surface. A, Planes orthogonal to the surface of the driver. B, Oblique planes passing through the center of the driver.")
Schematic representation of image generation in MR elastography. The double-headed arrows indicate the vibrational motion of the driver in these axial MR images. The driver (rectangle) can be positioned below the ribs or against the anterior part of the rib cage. The shear waves reach only a limited part of the liver. The vibrational motion of the driver is perpendicular to its surface. A, Planes orthogonal to the surface of the driver. B, Oblique planes passing through the center of the driver.
Steatosis from NAFLD could also, theoretically, influence liver stiffness measurements.86 However, a study by Sandrini77 found no influence of steatosis on liver elasticity. It is possible with MRI to estimate the degree of steatosis by obtaining dual-echo gradient-echo images88 in the same plane as MR elastographic images. MR elastography could be a convenient complement to MRS in estimating noninvasively the degree of steatosis and the level of liver stiffness. However, MR elastography requires further study before it can be introduced into clinical practice. Current research is oriented toward discriminating different stages of fibrosis in hepatitis and cirrhosis. Its combination with laboratory values (for example, the aspartate transaminase-to-platelet ratio index, APRI test)79 may further improve the specificity and sensitivity of the noninvasive estimation of liver fibrosis.67
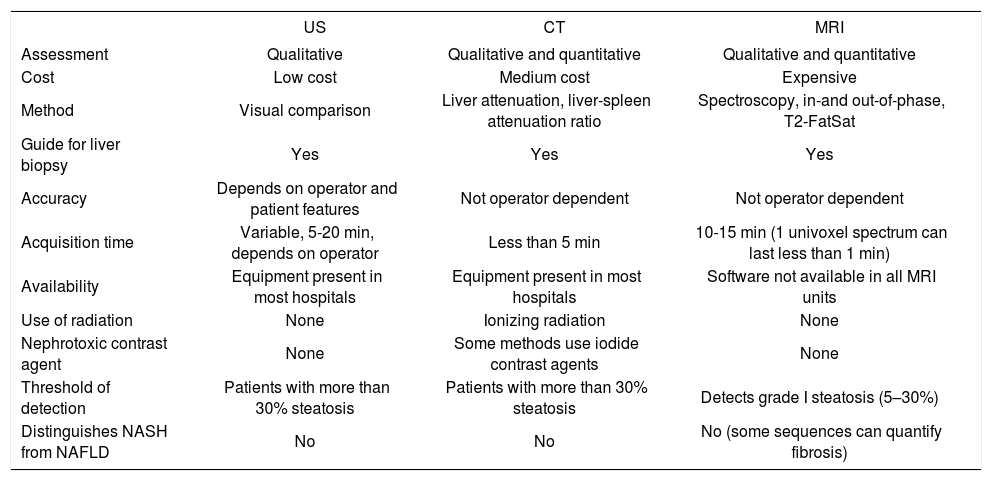
ConclusionsCurrent noninvasive methods for the diagnosis of NAFLD offer reasonable sensitivity and specificity. They can be used to complement biochemical markers in assessing the severity of steatosis.15Table I shows the main advantages and disadvantages of these imaging modalities.
Advantages and disadvantages of current noninvasive methods of quantifying hepatic fat content.
| US | CT | MRI | |
|---|---|---|---|
| Assessment | Qualitative | Qualitative and quantitative | Qualitative and quantitative |
| Cost | Low cost | Medium cost | Expensive |
| Method | Visual comparison | Liver attenuation, liver-spleen attenuation ratio | Spectroscopy, in-and out-of-phase, T2-FatSat |
| Guide for liver biopsy | Yes | Yes | Yes |
| Accuracy | Depends on operator and patient features | Not operator dependent | Not operator dependent |
| Acquisition time | Variable, 5-20 min, depends on operator | Less than 5 min | 10-15 min (1 univoxel spectrum can last less than 1 min) |
| Availability | Equipment present in most hospitals | Equipment present in most hospitals | Software not available in all MRI units |
| Use of radiation | None | Ionizing radiation | None |
| Nephrotoxic contrast agent | None | Some methods use iodide contrast agents | None |
| Threshold of detection | Patients with more than 30% steatosis | Patients with more than 30% steatosis | Detects grade I steatosis (5–30%) |
| Distinguishes NASH from NAFLD | No | No | No (some sequences can quantify fibrosis) |
The US examination continues to be the first option in diagnosing NAFLD, because it is inexpensive and has no adverse effects, but its accuracy depends on the prevalence of steatosis. CT is cost-effective and accurate in assessing hepatic fat, requires only unenhanced CT, and can detect focal lesions. However, the patient is exposed to significant ionizing radiation. Both methods have a threshold of more than 33% fat.
MRI, with its different sequences, is becoming the best quantitative method of diagnosing steatosis because it allows the detection of fat fractions of less than 33%. Its disadvantages include its high cost and the limited availability in most hospitals of the software required for the post processing of the data, even when an MRI scanner is available.
No noninvasive technique can distinguish NASH and other forms of NAFLD, a distinction that has important prognostic implications.89 The patient’s particular clinical history and perhaps a liver biopsy continue to be required for the appropriate management of some particular cases.


