


In the literature on the firm-industry debate to explain organizational performance the firm effect has been more supported than the industry effect by empirical studies, mainly focused on manufacturing firms and long time periods. Unfortunately, little attention has been paid to the service sector. In this paper we study separately manufacturing and services in a broad sample of Spanish companies. We observe that in manufacturing the firm effect outweighs the industry effect while in services the opposite is the case in a ten-year period. However, when we split the time horizon into two five-year sub-periods, this behavior only remains in the second one, of moderate economic growth. In the first one, of strong economic growth, the firm effect prevails for both manufacturing and services. These findings underline the importance of the industry effect for services, suggesting that such effect may have been underestimated in the literature, as well as that of the level of economic growth specially for the decision-making of practitioners.
In relation to organizational profitability (Aydiner, Tatoglu, Bayraktar, Zaim, & Delen, 2019; Deb, David, O'Brien, & Duru, 2019; Jackson, Plumlee, & Rountree, 2018; Makino, Isobe, & Chan, 2004; Uribe-Bohorquez, Martínez-Ferrero, & García-Sánchez, 2018), a line of research that has given rise to an in-depth ongoing debate is what is known as the firm effect versus the industry effect (Andonova & Ruíz-Pava, 2016; Certo, Withers, & Semadeni, 2017; Fernández, Iglesias-Antelo, López-López, Rodríguez-Rey, & Fernandez-Jardon, 2019; González-Fidalgo & Ventura-Victoria, 2002; Schröder & Yim, 2018; Zhang, Hult, Ketchen, & Calantone, 2020). The structure-conduct-performance (SCP) paradigm, which was developed within the field of Industrial Organization (IO), argues that contextual factors associated with the industry in which a firm competes (industry effect) have a decisive influence on performance. The resource-based view (RBV) approach, on the other hand, argues that differences on performance are due to the unique resources the firms have (firm effect), regardless of the industry in which they compete.
Empirical evidence has shown that it is mainly the firm effect which has the greater explanatory power of organizational performance, rather than the industry effect. But most of tests have been carried out with US firms and often with manufacturing sectors (Hough, 2006), excluding services. However, manufacturing firms have idiosyncratic attributes different from those of service firms (Audretsch, Klomp, Santarelli, & Thurik, 2004), which could support differentiated behaviors. Even so, studies of firm and industry effects in services versus manufacturing have barely been addressed. In this sense, the works of McGahan and Porter (1997) and Galbreath and Galvin (2008)) stand out, although providing conflicting evidence. Specifically, while McGahan and Porter (1997) found that the firm effect is more important in manufacturing and the industry effect is more important in services, Galbreath and Galvin (2008)) reached the opposite. In our view, these contradictory results, together with the limited attention that has been paid to the services sector in the firm-industry debate despite the fact that services provide about 70% of value added and employment in most developed countries, justify the need of additional research.
Accordingly, the aim of this work is twofold. First, to conduct an analysis of the industry and firm effects on services and manufacturing separately. We present theoretical arguments that offer an explanation of the difference in the pattern of the performance of service firms from that of manufacturing firms, based on their different attributes. Second, to delve into the reason for the observed behavior. In particular, we argue that the economic phase of the time period is relevant both in manufacturing and services when it comes to “activating” the firm effect or the industry effect. Looking closely at the studies mentioned in the previous paragraph, it can be seen that McGahan and Porter's study deals with data of 7003 US companies in a 14-year period while that of Galbreath and Galvin only with 285 Australian companies in a 1-year period. Apart from the sample size and other differences, which may also play a role in explaining the results, we posit that the significant disparity in their respective time periods is key. Thus, we put the focus on the level of economic growth changing over time and test our hypotheses with a sample that covers a 10-year phase of steady growth of the Spanish economy, although at different levels, and includes 11,490 manufacturing and service firms of all sizes, extracted from the SABI database. This allows us to extend the analysis to a broad population, without ruling out firms in the services sector or non-diversified or unlisted firms, and to a European economy and significantly smaller than that of the USA, in order to enhance the possibilities of generalizing the results. We have also sought to enhance such possibilities by choosing the same methodology and explained variable as in McGahan and Porter's study, whose sample has a size and a time horizon more similar to ours than that of Galbreath and Galvin.
Our results show that, in a 10-year expansion phase of economy, the industry effect has greater weight in services while the firm effect has greater weight in manufacturing. But, in a 5-year sub-period of that phase, of strong economic growth, the firm effect prevails both for manufacturing and services. This means that the result obtained in the whole 10-year growth phase seems to echo what happens only in half of it and underlines the importance the intensity of economic growth has in the analysis of firm and industry effects.
Interesting theoretical implications also derive from these findings. Among others, first, they contribute to support analysis of goods and services separately, since the separation of goods and services is still highly controversial, with at least two schools of thought, one considering that goods and services should be treated together and another one postulating the opposite. The separation of goods from services should help researchers to go more deeply into understanding the essential elements of services (Lovelock & Gummesson, 2004). And second, they not only provide evidence that the industry effect is critical in some contexts, such as that of service companies in certain stages of the economic cycle, with the consequences that derive from this for practitioners, but also suggest that it may have been undervalued by the empirical literature, thus for years depriving the IO field of deserved support.
The rest of the paper is organized as follows. First, we briefly review the empirical and theoretical literature underlying the firm-industry effect debate, and the idiosyncratic characteristics of the services sector, and we justify and set out our hypotheses. Then, we include a methodological section. Next, we present and discuss the obtained results. Finally, we derive a set of conclusions with implications for both practitioners and researchers.
2Theory and hypothesesThe instrument that Industrial Organization (IO) uses to explain economic profitability is the structure-conduct-performance paradigm (McWilliams & Smart, 1993). In its traditional formulation, this postulates that the industry's structure conditions a firm's results (Bain, 1951; Mason, 1939; Shepherd, 2018). The part played by firms' conduct is minimized, since it is assumed that firms pursue the same goal and adapt more or less passively to the conditions of the industrial structure (Jacquemin, 1987; Scherer, 1980). The principal advocate for this approach in the field of strategic management was Porter (1980).
The RBV approach has also had an extensive influence in the strategic management field (Newbert, 2007; Wibbens, 2019). It was introduced by Wernerfelt (1984), but had its origins in the work of Penrose (1959). According to this theory, the large profits of the most competitive firms are actually Ricardian rents from the possession of superior resources (Amit & Schoemaker, 1993; Grant, 1991; Mahoney & Pandian, 1992; Peteraf, 1993) in the sense of their being valuable, rare, hard to imitate, and non-substitutable (Barney, 1991). These create a competitive advantage that is difficult to replicate. The intrasectoral dispersion of economic profitability will be maintained insofar as there persists heterogeneity of the resources the firms possess (Penrose, 1959). This in turn depends on the existence of mechanisms of isolation (Rumelt, 1984) which prevent the replication of the resources that sustain the competitive advantage of the most profitable firms.
The pioneering study of which of the two effects was the principal factor in determining the differences in corporate profitability was that of Schamalensee (1985). This analyses firm and industry effects in the year 1975′s economic performance of a sample of 1,775 business units contained in the Federal Trade Commission (FTC) database. It found that the firm effect was not explanatory, but the industry effect explained 19.6% of the variance in performance, thus being support for the industry effect. Subsequently, Rumelt (1991) used the same database as Schmalensee but extending the temporal horizon (1974–1977) and extracting two samples, the second of which was augmented with smaller firms. The results now for both samples provided support for the preponderance of the firm effect (46.37% and 44.17%) compared to the industry effect (8.32% and 4.03%).
Since then there have been numerous comparative studies (among others: Arend, 2009; Bamiatzi, Bozos, Cavusgil, & Hult, 2016; Claver, Molina, & Tari, 2002; Hawawini, Subramanian, & Verdin, 2003; Karabag & Berggren, 2014; Makino & Chan, 2017; McGahan & Porter, 2002; Roquebert, Phillips, & Westfall, 1996). The clear majority conclude that the firm effect has a significantly greater capacity to explain the variance in performance than the industry effect. And this is so regardless of the database, methodology, and dependent variables selected.
2.1Comparing manufacturing and servicesWith respect to comparisons of firm-industry effects in services and manufacturing, the literature is very sparse. On the one hand, McGahan and Porter (1997), with data of large firms listed on the US stock markets, found the industry effect to be more important than the firm effect in the services sector, while the opposite was the case with manufacturing. On the other hand, Galbreath and Galvin (2008)) with a sample of Australian firms and a different methodology, report findings that are precisely the contrary.
A central element in our work is that goods and services have different, and in many cases opposite, characteristics that condition the attainment of a sustainable competitive advantage and the formulation of a business strategy.
In the economics literature, the term product refers to both goods and services. In a first approximation, goods can be defined as objects, devices, or things, and services as deeds, acts, or performances (Berry, 1980). There is a clear idea about what a good is in economics. Hill (1999) considers it to be an entity that exists independently of its owner and preserves its identity over time, so that it can be transferred from one economic unit to another. This is not the case with a service, which seems to be everything else (Rathmell, 1966; Sampson & Froehle, 2006). It is a rather vague concept with different meanings depending on who is using it, and a consensus definition has yet to be reached (Parry, Newnes, & Huang, 2011).
The separation of goods and services is still highly controversial. There are at least two schools of thought (Baines, Lightfoot, Benedettini, & Kay, 2009; Edgett & Parkinson, 1993; Hoffman & Bateson, 2017; Lee, Yoo, & Kim, 2016; Levitt, 1972; Lovelock & Gummesson, 2004; Moeller, 2010; Vandermerwe & Rada, 1988; Zeithaml, Parasuraman, & Berry, 1985). One considers that goods and services should be treated together, and that, in the limit, all economic activity is a service. If so, one would expect that differences in profitability of manufacturing and service firms would depend basically on the resources available to them. The other school of thought, which the present authors identify with, considers that there are substantial differences between goods and services, so that differences in profitability of manufacturing and service firms could be caused by different factors. In particular, the contextual factors associated with the industry where service firms compete (industry effect) have a key influence on their profitability. While the valuable, rare, inimitable and non-substitutable resources that the manufacturing firms own and/or control (firm effect) are those that determine the differences in profitability.
The inclusive school originated more than forty years ago when Theodore Levitt (1972) postulated that there were no such things as industrial and services sectors. All sectors have a service component, only this component has greater weight in some sectors than in others. In many respects, there is considered to be some convergence between industry and services. On the one hand, services tend to incorporate some of the characteristics of industrial goods. Levitt (1972) called this process the "industrialization of services". This line of thought has been widely developed, giving rise to different approaches, such as, among others, servitization (Lee et al., 2016; Vandermerwe & Rada, 1988) or the concept of Product Service System (Baines et al., 2009). Continuing with this evolution towards a new conception of services, Vargo and Lusch (2008) proposed a more radical perspective: service-dominant logic. And on the other, there is a parallel trend of industrial firms increasingly incorporating service activities (Bustinza, Parry, & Vendrell-Herrero, 2013). If the goods and services were not separable, it is assumed that the firm effect would have more weight than the industry effect in determining the profitability of services.
The other school believes that services have four principal characteristics that differentiate them from goods: intangibility, heterogeneity, inseparability, and perishability (IHIP) (Edgett & Parkinson, 1993; Hoffman & Bateson, 2017; Lovelock & Gummesson, 2004; Moeller, 2010; Zeithaml et al., 1985). Nevertheless, not all services have all these characteristics, let alone in their pure state.
Intangibility is a characteristic that is common to all services (Fitzsimmons & Fitzsimmons, 2014; Hoffman & Bateson, 2017; Lovelock & Gummesson, 2004; Sampson & Froehle, 2006). While some services offer results that are in part tangible, the costs of the material good commonly represent just a small fraction of the cost of the professional work provided by the service. Products that lack physical substance face a number of problems that are not solvable with the traditional solutions applied to goods. Intangibility is associated with impediments to patenting innovations in matters of services (Tufano, 1989), and the ease with which they can be imitated (Atuahene-Gima, 1996). In general, the barriers to the creation or disappearance of firms are considered to be lower in services since, being less intensive in physical capital than industrial firms (Gordo, Jareño, & Urtasun, 2006). Intangibility is one of the reasons that many services need regulation to give them the attribute of credibility (Hipp & Grupp, 2005).
Research economists are clear about the existence of manufacturing and of service activities. In general, the data used to carry out industrial analyses are grouped in accordance with some standard classification. These classifications (e.g., SIC, NACE or CNAE-20091) are structures that are designed to group together into the same category units that are homogeneous according to some defined criterion. This ensures that a set of information can be labeled with a code, facilitating the statistical analyses and interpretation of the data. The units grouped together into an activity classification are firms and establishments that have common activities. The CNAE-2009 classification shows the range of activities that are covered by the sections corresponding to the principal categories of the economy. The services sector includes all economic activities whose outputs are not physical products or construction. They are generally consumed at the same time they are produced and create added value in ways that are essentially intangible and related to their first purchaser.
At the same time, another services’ characteristic, heterogeneity, works in favor of services' flexibility and tailoring to the client (Onkvisit & Shaw, 1991), and contributes to their differentiation (Wyckham, Fitzroy, & Mandry, 1975). On the other hand, intangibility and heterogeneity eliminate two of Barney's four criteria (1991): hard to imitate and nonsubstitutable. That is, in general, a valuable service can be easily imitated and substitutable, so it does not provide a sustainable competitive advantage. Consequently, in the service firms, the industry effect should present a greater explanatory capacity in profitability than the firm effect.
In sum, there exists a discrepancy among researchers, with the existence of at least two schools of thought. One school considers that goods and services should be treated together, even to the limit of considering that all economic activity is an exchange of services. There coexists, however, an alternative school which argues that goods and services have clearly differentiated characteristics – the IHIP – and that these continue to constitute a useful tool with which to delimit the two (Moeller, 2010). One also finds this argument expressed in different textbooks on services marketing (Fitzsimmons & Fitzsimmons, 2014; Hoffman & Bateson, 2017). The separation of goods from services also helps researchers to go more deeply into understanding the essential elements of services (Lovelock & Gummesson, 2004).
This separation of goods from services leads us to conjecture that the source of the competitive advantage of goods differs from that of services. Specifically, services cannot be patented, they are easy to imitate, and barriers to entry are very low. On the other hand, many branches of service activities are heavily regulated; and in regulated industries the industry effect prevails (Karabag & Berggren, 2014; Luo, 1999). Thus, as argued above, and since in manufacturing firms the firm effect predominates in explaining differences in profitability, we consider that, in general, in services it will be the industry effect that is predominant, since the firms will find it difficult to keep their valuable resources isolated from their competitors. Accordingly, we posit the following hypothesis:
H1. The weights of the firm and industry effects are significantly different in services and manufacturing: in manufacturing, the firm effect predominates, and in services, the industry effect predominates.
2.2The strong growthIn general, macroeconomic factors condition firms' strategies (Pearce & Michael, 2006) and are important in determining firm performance (Forcadell, Sanchez-Riofrio, Guerras-Martín, & Romero-Jordán, 2020; Reyes, Vassolo, Kausel, Torres, & Zhang, 2020). In line with this, recent research (Cheong & Hoang, 2021) tests the impact of some macroeconomic factors (for example GDP growth) on organizational profitability. However, both the industry effect and the firm effect have been often analyzed in the context of a stable and unchanged environment. Although the environment changes and it is assumed that the weight of both effects can also change (Bamiatzi et al., 2016). In periods of recession, resources are scarce and are very unevenly distributed, so that the firms that monopolize them and use them more efficiently improve competitiveness (Garcia-Sanchez, Mesquita, & Vassolo, 2014). Any difference in profitability among firms in the same industry depends on the resources available to them (Majundar & Bhattacharjee, 2014). On the other hand, Bamiatzi et al. (2016) found that firm effects become stronger in recessionary periods comparatively with expansionary periods. But what happens in an expansionary period in terms of explaining firm versus industry effects?
An expansionary period is characterized by an increase in the number of competitors with new entrants, and an increase in demand (Karniouchina, Carson, Short, & Ketchen, 2013). However, high growth may mean that the market is absorbing new entrants without there occurring any increase in rivalry. That is, the rivalry tends to be relatively low (Porter, 1980). Therefore, the market absorbs all kinds of heterogeneous companies. Rapid growth in demand allows firms to have increasing income without taking share away from their competitors (Hill & Jones, 2009). Each firm is unique because of the endowment of the resources it possesses at a given moment, and this generates asymmetries in the competition to obtain new resources. Firms expand their portfolio of resources based on existing resources (Wernerfelt, 2011) and, in this way, initial differences in resource endowment will widen over time creating additional between-firm heterogeneity (Madsen & Walaker, 2002). The heterogeneity of the firms and the high diversity of products determine the differences in profitability of the companies (Karniouchina et al., 2013; Knott, 2003). Therefore, in a rapidly growing market there is room for very heterogeneous firms with high and low levels of efficiency. Accordingly, we posit the following hypothesis:
H2. In a phase of strong growth, the weights of the firm and industry effects are similar in services and manufacturing: the firm effect predominates over the industry effect.
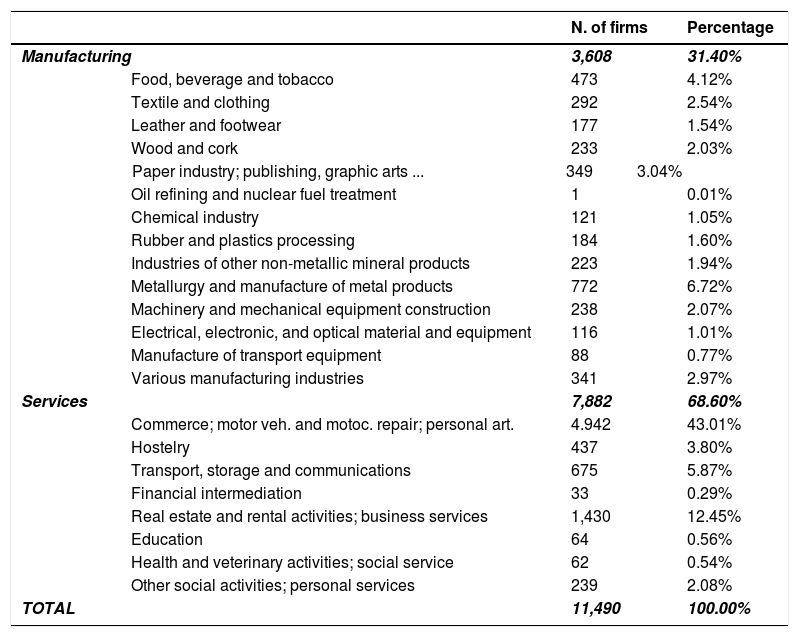
3Research methodology3.1SampleThe original sample used consisted of 14,204 firms, which were the ones with complete data for a ten-year sample period, 1995–2004, in the Bureau van Dijk's SABI database. Of these, 0.80% are large, 6.05% medium-sized, 48.36% small, and 44.78% microenterprises. And, according to the CNAE classification, 3,608 of them correspond to manufacturing (114 CNAE 3-digit sectors) and 7,882 to services (97 CNAE 3-digit sectors). Table 1 shows a more detailed description of the different subsectors that make up the final sample of 11,490 manufacturing and service firms.
Sample composition by sectors and subsectors.
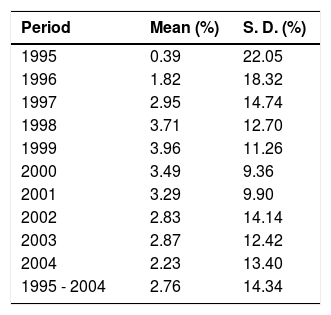
As will be explained in the following section, we use ROA as organizational performance measure. Table 2 shows the mean ROA and its standard deviation per year and for the whole time period of all sample firms.
The sample period, 1995–2004, deserves explanation. A long enough (e. g., 10 years) relatively recent time period was considered appropriate. But, on the one hand, it should provide different patterns of economic growth in order to focus them separately, and, on the other hand, it should not include a recession stage in order to leave economic decline for future research. The selected decade meets these requirements, covering the expansive phase of an economic cycle. It shows a steady growth of the Spanish gross domestic product, although this growth exhibits a clearly different pattern in each of its two halves: strong during the period 1995–1999, and moderate in intensity and volatility in 2000–2004. This is also partially illustrated by data in Table 2.
3.2Measures and modelThe proposed model estimates the relative weights of firm and industry effects when it comes to explaining organizational performance. The return on assets (ROA), or gross profit to assets ratio, is the proxy for performance and it has been chosen in order to favor comparisons of results with those of previous studies, given that it is the most common measure in the literature and, particularly, it is the one used in the study of McGahan and Porter (1997), with which we intend to compare ours as far as possible, and which, in turn, compares its results with those of Rumelt (1991) and Schmalensee (1985). Nevertheless, the use of ROA is highly controversial due to a set of reasons arisen from its accounting nature; among others, this ratio does not measure value creation, cash flows or risk-adjusted return (Hawawini et al., 2003), gross profit is not linked to the financial structure of the firm (McGahan & Porter, 1997) and it fails to consider differences related to taxes. According to Wernerfelt and Montgomery (1988), these properties are likely to vary more across sectors than across firms, which might positively bias the industry effect. Consequently, some scholars have proposed measures of performance based on market values, such as Tobin's Q. However, as Lorca, De Andrés, Díez, Del Coz, and Bahamonde (2007) state, when working with unlisted firms, measures based on market values are difficult to implement. In short, our study includes ROA despite that certain accounting conventions might exert an influence on the effects being examined, and it is in this light that the results must be interpreted.
The proposed model here is similar to that of Rumelt (1991), although it does not consider the business unit and corporate effects because these were impossible to measure with the information available in the database we used. As the alternative, we measure a single firm effect together with the industry effect, the temporal effect, and the effect resulting from the industry-year interaction (transient industry effect). Formally:
where rijt, the model's dependent variable, is the ROA of firm j belonging to industry i in year t; a, a constant, is a global average; fj represents the firm effect; si represents the industry effect; yt accounts for the temporal effect resulting from annual macroeconomic changes; (sy)it identifies the transient industry effect resulting from the impact of the economic cycle on the industry to which the firm belongs; and eijt is the random error, i.e., the part of the ROA that the model does not explain.
As in numerous other studies (e.g., Chang & Singh, 2000; McGahan & Porter, 1997; Rumelt, 1991; Xia & Walker, 2015), we use a technique of decomposition of the variance of random effects in order to analyze the relative importance of the various effects studied. This technique decomposes the variance of the return on assets (σr2) as follows:

Where σf2, σs2, σy2, σsy2, and σe2 are the variances of the measured effects and of the random error. These, the model's explanatory variables, have normal distributions with zero means, and are generated by random processes that are independent of each other. To estimate the components of the variance, we used the lme4 library of the R statistics programming language (Team, 2014).
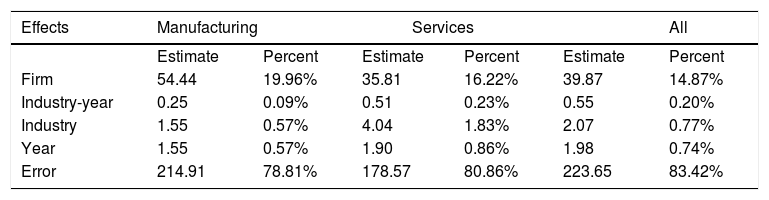
4Results and discussion4.1Main resultsHypothesis 1 is confirmed by the results. As one can see from Table 3, the weight of the firm effect is similar in both manufacturing and services, although slightly lower in the case of services. But the weight of the industry effect is negligible in the case of manufacturing, and more than thrice the firm effect in the case of services. This is also a reason for the model's better explanation of the variance of the service firms' return on assets since their random error component is much smaller. It can also be observed that the results of a complete sample of firms of all the sectors2 are in the same line as those of just the manufacturing firms, highlighting the influence of these firms on the total even though in numbers they are fewer than half those of the service firms. Probably their greater average size explains this result, at least in part.
In all cases, less than 0.50% of the variance of ROA is explained both by the temporal effect, which accounts for annual macroeconomic changes that affect all firms to the same degree in a year, and the industry-year effect, which results from those changes affecting the industry to which each firm belongs. This reinforces the idea of the stability over time of the effects that do present a more significant degree of explanation of profitability: industry and firm.
With respect to the comparison of our results with those of the previous two studies (Table 4), our results are contrary to those of Galbreath and Galvin (2008)), although their sample has very little similarity to ours: very few firms, different methods and dependent variable, and, what is more important, the fact of putting their focus only on one year, which is a rather short time period from a business strategy point of view. Furthermore, a longer period allows to measure the effects over different phases of the economic cycle and leads to more robust results against temporary anomalies. For these reasons, we will compare our results with those of the other study (McGahan & Porter, 1997), which is far more homogeneous with ours in terms of number of firms, methods, dependent variables and time periods, since these latter are not-overlapping and successive, and in both cases of generalized economic growth in their respective countries, not for the years 1982 and 1991 in the USA, of negative GDP growth. However, there are still some differences. Firstly, McGahan and Porter (1997) distinguish corporate effects from business unit effects, whereas we only analyze a firm effect because of the impossibility of measuring the corporation effect with our database. Secondly, we do not classify services in the same way. McGahan and Porter (1997) use a very restrictive classification of services – Code 8 at the SIC 1-digit level – leaving out firms in other sectors which are also services. Instead, our classification is broader, in the style of that of Goddard and Wilson (1996).3 Thirdly, their sample is of listed firms, whereas ours is mostly of unlisted firms of an average size well below that of Compustat firms.
Comparison of results.
| McGahan and Porter (1997) | Galbreath and Galvin (2008)) | Our study | |||||||
|---|---|---|---|---|---|---|---|---|---|
| Country | US | Australia | Spain | ||||||
| Sample | All sectors except finance | Manufacturing and services | All | ||||||
| Firms | 7,003 | 285 | 14,204 | ||||||
| Method | VCA | Regression | VCA | ||||||
| Industries | 628 | 12 | 243 | ||||||
| Years | 1981–94 | 2006 | 1995–04 | ||||||
| Performance | ROA | Subjective scale | ROA | ||||||
| All | Services | Manufacturing | All | Services | Manufacturing | All | Services | Manufacturing | |
| Industry | 18.68 | 47.37 | 10.81 | 3 (∆R2) | 2.3 (∆R2) | 8.7 (∆R2) | 3.35 | 34.86 | 0.45 |
| Firm | 31.71 | 33.46 | 35.45 | 6.7 (∆R2) | 9.6 (∆R2) | 3.8 (∆R2) | 12.71 | 10.13 | 13.09 |
| Corporate | 4.33 | n.a | n.a | ||||||
An additional difference between our sample and that of McGahan and Porter arises from the requirement that we have imposed on the companies in our sample to have the data required by our model for each and every one of the ten years of the time horizon. This means that our sample suffers from a certain survival bias, since both the firms that failed to provide information in any of the years, and those that disappeared or were created throughout the decade studied, have been left out of the study. This is not the case in the McGahan and Porter's study, in which the average years of firms’ data are 5.7 in their 14-year sample. This reinforces the stability of the effects studied in our work compared to those of these authors.
As can be observed in Table 4, our results are in line with those reported by McGahan and Porter. Although their model explains a greater proportion of the variance in performance than ours, which probably also has to do with the size of the firms in the samples (Rumelt, 1991). But, even with this different size of firms in both studies, both models lead to similar conclusions: in manufacturing and in the entire sample, the firm effect is markedly more important than the industry effect, whereas in services the industry effect predominates. These results suggest that, theoretically, IO is better reflected in services and RBV in manufacturing.
Hypothesis 2 is also confirmed by the results. Table 5 shows that, in a period of strong growth, only the firm effect is significant in both manufacturing and services, while the stable industry effect remains at levels below 2% and the temporary effects below 1%. Even though the firm effect is slightly lower and the industry effect slightly higher in services than in manufacturing, the differences are minimal. In both groups of firms, the model is not very explanatory since the variance of the unexplained performance is around 80%. The results are similar at the level of the entire sample, with some reduction in the firm effect and, as a consequence, in the model's explanatory capacity.
Whereas, in contrast, in a phase of moderate growth (2000–2004) the results depict a different picture (Table 6). The firm effect in manufacturing has twice the weight it has in services and, while in manufacturing the industry effect is hardly significant at all, in services it reaches 73.32% if the industry and industry-year effects are considered together (note that in this case the transient industry effect is relevant.). As a consequence, the model is highly explanatory in the case of services since the random error is only 17.94%, while in manufacturing the opposite is the case, with an error of 80.10%. With respect to what is observed at the level of the entire sample, the result is intermediate between the other two. Thus, the model has a moderate explanatory capacity with an error of 53.58%, and the weight of the firm effect is similar to that of the manufacturing firms, although very much below that attained by the industry effect, which could lead us to conclude that the model gains explanatory capacity in phases of economic growth that are not strong. The prevalence of the industry effect over the firm effect places this result in line with that found for services. Moreover, these result show a remarkable parallelism with those of McGahan and Porter for all firms.
Analysis of the components of the variance of ROA in manufacturing, services, and all sectors with moderate growth (period 2000–2004).
Various authors have emphasized the potential influence on the results of how outliers are treated (McGahan & Porter, 1997; Roquebert et al., 1996). Outliers point out companies with clearly different behaviors from the average, that is, companies that show extraordinarily high or extraordinarily low results, normally due to factors specific to that company that most do not share. Consequently, this type of company can condition the results when estimating the model, hence the interest in studying the robustness of the previous hypothesis to check if extraordinary factors condition that hypothesis.
At the empirical level two forms of proceeding can be observed. In the first, the sample is pre-filtered to remove atypical data (Eriksen & Knudsen, 2003; McGahan & Porter, 1997; Roquebert et al., 1996), while in the second, a test is made to see whether the results are affected by the inclusion or exclusion of outliers (Hawawini et al., 2003; McNamara, Aime, & Vaaler, 2005). These different ways of dealing with outliers can yield opposing results. Thus, the first found that the industry effect increases considerably on eliminating outliers, while with the second hardly any variation could be appreciated in the relative weights of the two effects according to whether or not outliers were excluded.
From an economic perspective, it is reasonable that the fact of whether or not the data of firms with unusually high or low profitability are taken into account should be reflected in the weights of the firm and industry effects. Removing the exceptional firms would focus the analysis on firms whose conduct is more standard, more similar to the industry average, which theoretically should be those most influenced by structural characteristics, resulting in greater weight of the industry effect. Also, by not considering firms with extraordinary performances, firms which would presumably have some unique attributes determining that outstanding performance, one would be reducing the weight of the firm effect. In the literature cited there is no proposal on how the treatment of outliers can lead to different results in services and manufacturing with respect to the prevalence of one effect over the other. However, following the arguments given for the hypothesis 1, it seems logical to think that there will still be differentiation in the behavior of the two effects studied, regardless of whether or not outliers are excluded.
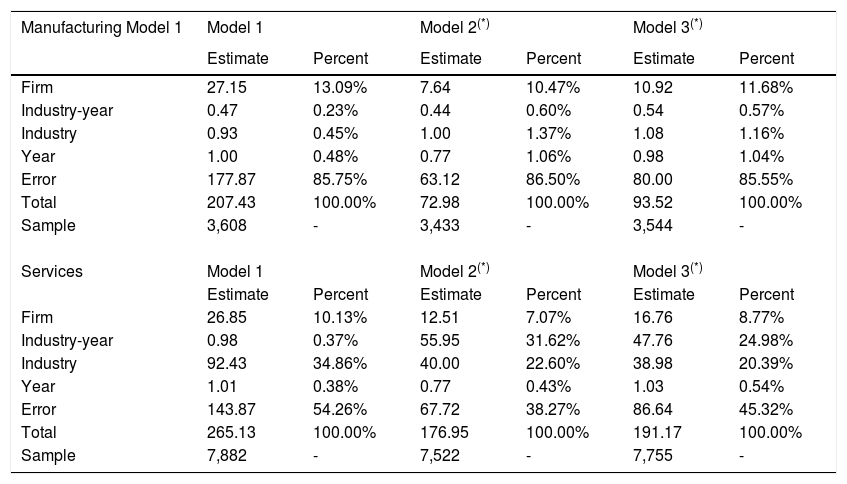
The analysis of robustness implies the use of three alternative models: model 1 uses the full sample; model 2 uses the sample without outliers to 95%; and model 3 uses the sample without outliers to 99%. Our results confirm that the weights of the firm and industry effects differ significantly between manufacturing and services regardless of whether or not outliers are removed from the entire sample. As shown in Table 7, whose columns named “Model 1” contain the results given in Table 3, the only effect that is relevant in the case of manufacturing is the firm effect, while the weight of this effect in services is somewhat smaller than in manufacturing and much smaller than the weight reached by the industry effect, and all this regardless of whether or not outliers are removed from the sample. It is also striking how, with the elimination of outliers, the transient firm effect gains importance in services.
Analysis of the components of the variance of ROA in manufacturing and services, with and without outliers (period 1995–2004).
| Manufacturing Model 1 | Model 1 | Model 2(*) | Model 3(*) | |||
|---|---|---|---|---|---|---|
| Estimate | Percent | Estimate | Percent | Estimate | Percent | |
| Firm | 27.15 | 13.09% | 7.64 | 10.47% | 10.92 | 11.68% |
| Industry-year | 0.47 | 0.23% | 0.44 | 0.60% | 0.54 | 0.57% |
| Industry | 0.93 | 0.45% | 1.00 | 1.37% | 1.08 | 1.16% |
| Year | 1.00 | 0.48% | 0.77 | 1.06% | 0.98 | 1.04% |
| Error | 177.87 | 85.75% | 63.12 | 86.50% | 80.00 | 85.55% |
| Total | 207.43 | 100.00% | 72.98 | 100.00% | 93.52 | 100.00% |
| Sample | 3,608 | - | 3,433 | - | 3,544 | - |
| Services | Model 1 | Model 2(*) | Model 3(*) | |||
| Estimate | Percent | Estimate | Percent | Estimate | Percent | |
| Firm | 26.85 | 10.13% | 12.51 | 7.07% | 16.76 | 8.77% |
| Industry-year | 0.98 | 0.37% | 55.95 | 31.62% | 47.76 | 24.98% |
| Industry | 92.43 | 34.86% | 40.00 | 22.60% | 38.98 | 20.39% |
| Year | 1.01 | 0.38% | 0.77 | 0.43% | 1.03 | 0.54% |
| Error | 143.87 | 54.26% | 67.72 | 38.27% | 86.64 | 45.32% |
| Total | 265.13 | 100.00% | 176.95 | 100.00% | 191.17 | 100.00% |
| Sample | 7,882 | - | 7,522 | - | 7,755 | - |
As for both sub-periods (1995–1999 and 2000–2004), that is, in relation to hypothesis 2, this robustness analysis leads to results in the same line as those obtained for the full 10-year period, namely, the elimination of the outliers does not affect the conclusions that were drawn and exposed in the previous section.
5ConclusionsIn the field of strategic management, two major drivers of profitability have been identified, which have led to a major controversy. What is known as the industry effect has been justified within IO by the postulate that the determinants of organizational performance are the structural characteristics of the industry in which the firm competes. What is known as the firm effect has been defended within RBV by the proposal that the heterogeneous resources an organization has and the existence of isolation mechanisms that prevent their replication are the source of its competitive advantage.
Despite its breadth, there are still gaps in the firm-industry effect debate which call for further research. The academic literature overwhelmingly identified the firm effect as having the greater capacity to explain performance of manufacturing firms. Nonetheless, service firms have differential characteristics that, in our opinion, justify a significantly distinct behavior from that of manufacturers and, consequently, deserve distinct consideration. And this was reflected in the results of the present work. Thus, with the sample used, we find that the industry effect is by far the most important in services, while in manufacturing it is the firm effect which is more important. And this is regardless of whether or not the sample is pre-filtered to a greater or lesser extent to remove atypical data; i.e., firms with the most extreme performances do not determine this differential behavior, suggesting the robustness of this hypothesis.
This result has an important managerial implication. In service firms it is relevant where to compete, so the strategy seeks to achieve a competitive advantage that allows obtaining a favorable position against the forces that drive competition in the sector. For manufacturing firms what is important is how to compete, with resources being a more solid basis for competitive advantage, and, therefore, part of the strategy (Reed & DeFillippi, 1990). In industrial firms, managers must formulate strategy based on the resource-based approach. On the contrary, in service organizations the approach of Porter (1980) seems more appropriate, since any difference in profitability in the same service category is a matter of the firms ’positioning against their counterparts within the service category.
Another of this work's interesting contributions is connected to the intensity of economic growth. No differentiation is found in a sub-period of strong growth: both in manufacturing and in service firms, the industry effect predominates. This result can be deceptive for the managers of service firms. They may think that they have heterogeneous resources and isolation mechanisms that prevent their replication by competitors. When what they have is the luck of being in a stage of strong growth, and, if they do not have a favorable position, in periods of normal or stable growth their benefits will disappear. We also observed that if the sample was not disaggregated into services and manufacturing, then, considering the full-time horizon, the result was favorable to the firm effect, coinciding with the result obtained for just the manufacturing firms, i.e., there is a prevailing influence of a group of firms which constitute only the 31.40% of the sample. This is probably because of the larger size of these manufacturers compared to that of services (Gordo et al., 2006), what requires additional research.
Some interesting theoretical implications also derive from our results. On the one hand, they suggest that some methodological aspects may have led to the firm effect being overvalued in the literature and the industry effect undervalued, and, therefore, that the empirical support received by RBV being given too much weight, and the received by IO too little. On the other hand, our results also lead us to argue that the IO and RBV complement each other rather than compete in explaining business competitiveness. In the context of services, IO shows greater explanatory capacity, while RBV is better reflected in the results of the manufacturing firms. RBV and IO may even alternate in their relative explanatory capacities according to the economic phase, as it was also found in Bamiatzi et al. (2016).
To end, we must not fail to mention some limitations of this work. Firstly, the available data did not allow to measure business unit and corporate effects separately. Secondly, the accounting nature of the performance proxy, ROA, could have led to a certain bias in the results favouring the industry effect. It would be of utmost interest to implement alternative organizational performance indicators, as a robustness analysis. In this sense, the possibilities are wide: from simple variants of the ROA measure, to other measures of profitability, such as return on equity (ROE), of cash flow, such as sales growth, or of efficiency, such as the sales per employee ratio, through others based on market value. Finally, as a line of future research, we consider to study services versus manufacturing in periods of economic decline, and how country regulation affects the firm and industry effects. We also believe it is interesting to see if the size of the firms affects industrial and service organizations in the same way, as well as the weight of both effects on service firms depending on the weight of their physical assets on the balance sheet. It would also be interesting to check the influence of the institutional environment (with special reference to developed and developing countries) or the type of property (public vs. private) on the weight of both effects.
SIC is the standard industry classification mainly used in US; NACE is the statistical classification of economic activities in the European Union; and CNAE-2009 is the Spanish national classification of economic activities, adapted from NACE.
The full sample consists of 25.4% manufacturing firms, 55.5% service firms, and 19.1% firms in the primary sector, electricity, and construction.
Our sample includes as services the following NACE Rev. 1.1 (1-digit) categories: G. Wholesale and retail trade: repair of motor vehicles, motorcycles, and personal and household goods; H. Hotels and restaurants; I. Transport, storage, and communications; J. Financial intermediation; K. Real estate, renting and business activities; M. Education; N. Health and social work; and O. Other community, social and personal services activities.
recomendados

www.publicationethics.org.