Supply chain management (SCM) and total quality management (TQM) represent two parallel approaches to improving organizational performance. Previous studies have analyzed the SCM features impacting organizational performance independently of the design of TQM practices. Similarly, the recent literature on SCM overlooks TQM when incorporating lean and agile elements in SCM practices and strategies. Scattered attempts have been made to evaluate lean and agile SCM practices and TQM action plans, but no concrete integrated approach has been developed. In particular, no study has presented a structured analysis to quantify the influence of the SCM components on achieving predetermined TQM goals. We propose a comprehensive, four-phase, integrated procedure with a total score to quantitatively assess lean and agile SCM to fill this research gap. This comprehensive score selects the most suitable TQM action plan for increasing productivity and sustainability. The four phases of the proposed procedure include an initial qualitative analysis for defining indicators, sub-indicators, and characteristics of the lean and agile approach (Phase 1), the formulation of a mathematical model for computing the total score of the whole SCM approach (Phase 2), the selection of an action plan to achieve TQM goals (Phase 3), and the validation of the proposed framework and the results obtained (Phase 4). We show the applicability of the proposed evaluation procedure in a real-life case study and demonstrate that the general formulation of the mathematical model allows for extensions of the proposed method to other evaluation contexts.
Lean and agile are two supply chain management (SCM) strategies that focus on minimizing cost and waste while being highly flexible to adapt quickly to the continuous changes that SCM systems undergo (Salvendy, 2007). Lean and agility can be regarded as quality-changing tools that support strategic decisions to increase an organization's competitive advantages and deal with dynamic customer preferences (Srinivasan et al., 2020; Oliveira-Dias et al., 2022).
Total quality management (TQM) can be regarded as a parallel concept to lean SCM and agile SCM. It refers to a customer-oriented process that continuously improves the management of business operations at all levels by actively involving all employees (Boaden, 1997; Talha, 2004; Kujala and Ullrank, 2004; Mehra and Ranganathan, 2008). In this respect, identifying factors affecting the achievement of TQM goals related to productivity and sustainability represents a key issue for managers and researchers. Despite the impact of SCM decisions on TQM actions being clear and generally recognized, the possible implications of SCM workflows on assessing TQM goals are usually overlooked (Kannan and Tan, 2005; Vanichchinchai and Igel, 2009; Kaur et al., 2019; Soares et al., 2017).
Most previous studies have combined lean and agile elements in SCM without considering related TQM goals. Moreover, even though attempts have been made to evaluate lean and agile SCM practices and TQM action plans, no concrete integrated approach has been developed. This is true both for qualitative and quantitative studies. The literature review section provides many examples in this sense. In particular, none of the existing studies has tackled the problem of explicitly identifying the relationship between the factors characterizing an efficient design of lean and agile SCM and those yielding successful TQM practices. Another issue overlooked in the literature is the possibility of assigning a score to these factors to allow for a quantitative – hence, more objective – assessment of the action plan to implement for TQM.
The present study is motivated by the following research question: “How can lean and agility contribute to total quality management (TQM) in supply chain management?”. This question is addressed by considering two particular issues: (1) Can specific lean and agile factors adequately be defined to account for TQM principles? (2) Can the impact of lean and agile SCM on achieving specific TQM goals be measured systematically and systematically?”
To fill the research gap represented by these questions, we focus on a systematic analysis of the lean and agile SCM and show that it can lead to successful TQM. We introduce a wide range of lean and agile SCM factors. These factors are categorized as indicators, sub-indicators, and characteristics and are linked to the main domains of TQM.
Identifying common features between lean and agile factors and TQM elements creates ideal conditions for designing a comprehensive evaluation procedure to measure the impact of lean and agile SCM on achieving specific TQM goals. The primary objective of this procedure is to provide a tool that assists experts and managers in selecting suitable intervention strategies.
The evaluation procedure proposed in this study is based on a qualitative-quantitative approach that relies on the continuous full cooperation of researchers and practitioners. This evaluation scheme is designed to reflect two main objectives. The first objective is to define the total scores of lean and agile SCM approaches to account for the links between lean and agile indicators and TQM principles. The second objective is to use the total scores to select the actions to implement in an organization to achieve predetermined TQM goals.
The innovative aspects of the proposed procedure are related to the empirical investigation that was conducted in a real-life organization to complement the theoretical framework. Indicators, sub-indicators, and their characteristics are specifically defined to evaluate the lean and agile SCM practices concerning the possibility of achieving prearranged TQM goals. The systematic definition of these indicators and sub-indicators was possible thanks to the collaboration of the TQM practitioners who participated in the empirical investigation. Well-defined and experience-based TQM goals are identified, and their pivotal role in assessing the practical validity of the proposed procedure is demonstrated. A mathematical model is introduced to add objectivity to the data provided by the practitioners through subjective evaluation. The mathematical formulas can be coded for an easy and automated computation of all the necessary scores. Excel was used in the empirical study due to its simplicity and common use, but many other software can be used to program the score spreadsheet. The active involvement of TQM practitioners in all the phases of the proposed procedure is the key to an accurate global assessment that encompasses assigning total scores to lean and agile SCM, choosing the TQM action plan to implement, and validating the organization's results in terms of productivity and sustainability.
The rest of the paper proceeds as follows. Section 2 provides a literature review of the relevant work produced over the last two decades. Section 3 illustrates the research framework and outlines the proposed four-phase evaluation procedure. Section 4 explains the method followed in selecting the TQM experts whose evaluations are essential to implement the proposed procedure. Section 5 describes the first phase of the proposed procedure, the qualitative phase. Section 6 describes the second phase, that is, the quantitative phase. The mathematical model defined to compute the total score of lean and agile SCM is explained in this section. Section 7 describes the third phase, the guidelines for the TQM practitioners to recommend the right action plan for achieving TQM goals. Section 8 describes the fourth phase, the results assessment phase. Section 9 discusses the main findings, their implications, and possible extensions. Section 10 concludes.
Literature reviewThis section focuses on the studies published over the last two decades on SCM and TQM practices and the effects that possible synergistic relationships between them may have on an organization's performance.
Previous studies on the impact of SCM and TQM on organizational performanceMany studies have suggested that TQM and SCM strengthen organizational competitiveness and improve customer satisfaction. The impact of the main areas of SCM on TQM has been investigated relative to other initiatives, such as enterprise resource planning and electronic commerce. This impact endorsed a complete integration of SCM across organizational value chains, with a cross‐boundary focus on transaction cost reduction (Gunasekaran and McGaughey, 2003).
TQM and SCM have evolved similarly to reach the same goal: customer satisfaction. However, TQM and SCM have different starting points and primary goals, making an integrated implementation complex. According to several authors, TQM should aim to enhance internal partnerships (employee), while SCM should focus on external partnerships (business partners). Both partnerships must be enhanced to strengthen further the “total” in TQM and the “entire supply chain” in SCM (Vanichchinchai and Igel, 2009). Other researchers have followed a different interpretation: TQM should center on continuous quality improvement and participation, while SCM emphasizes supplier relationships, management, and on-time delivery of products and services (Talib et al., 2011a,b).
The relationships between TQM and SCM have been analyzed using business models like Kanji's Business Excellence model. This model uses TQM principles to help companies achieve business excellence and compensate for the inadequacies of existing SCM models by creating new ones (Kanji & Wong, 1999).
The cost deriving from working without TQM concepts has also been considered (Liapis et al., 2013), while sporadic attempts were made to assess SCM and TQM practices concerning firms’ supply performance (Vanichchinchai, 2014). Both issues have been tackled mostly in empirical studies, with the assessment of SCM components separated from TQM.
The problem of integrating SCM practices with TQM ones has attracted the attention of researchers and practitioners more and more over the last decade.
Different combinations of SCM-TQM practices were proposed for an enterprise to operate efficiently, and case studies were conducted to support their practical implementation (Sharma and Modgil, 2015). The results obtained from the practical deployments of fairly innovative SCM approaches were used to infer the factors characterizing a successful TQM (Jung and Chung (2016). Synergistic relationships between the SCM and TQM paradigms proved more helpful than pure SCM initiatives in enhancing overall business performance (Sidhu et al., 2019). Common practices in TQM and SCM were identified based on key factors identified empirically (Kaur et al., 2019). Some SCM models incorporated operation management techniques, allowing us to conclude the relative influence of TQM and SCM and the impact of TQM and agile production and green SCM practices on organizational performance (Green et al., 2019). Assessment methodologies were proposed for quality-related performance measures involving supply chain risk (Ganguly, 2020).
SCM and TQM practices can impact each other and operational performance differently and at various levels. For instance, by testing alternate models, Sharma and Modgil (2020) concluded that SCM and TQM practices influence operational performance, but TQM also directly impacts SCM components. Thus, TQM practices influence the overall operational performance. Kaur et al. (2020a, b, c) assessed organizational performances based on the implementation of SCM-TQM combined initiatives and of SCM and synergistic SCM approaches. The correlation between dependent and independent factors and competitive dimensions of SCM and SCM-TQM approaches was also studied. Kaur et al. (2021) identified the barriers impeding a successful implementation of SCM-TQM practices and ranked such barriers based on a VIKOR approach. Shaikh et al. (2023) argued that TQM initiatives are directly correlated to improvements in SCM while both positively affect an organization. A systematic literature review of the trendy topics related to TQM and SCM elements has been presented by Mahdikhani (2023), among others.
Finally, the most recent studies related to TQM witnessed much more heterogeneous and interdisciplinary developments. For instance, Shan et al. (2023) proposed a multi-factor conceptual model to analyze the relationship between supply chain partnerships and innovation performance. Following a knowledge-management approach, supply chain partnerships and innovation performance are described by factors and measurement metrics typical of TQM practices. Liu et al. (2024) studied the impact of market accessibility on innovation performance, considering supply chain resilience as an influence path. Market accessibility is shown to influence significantly innovation performance, in contrast to its reduced impact on innovation quality. Mahajan et al. (2023) investigated the relationship between TQM and inventory management and concluded that inventory management highly correlates with the inventory turnover ratio. However, unlike TQM, it is unrelated to firm performance. Toufighi et al. (2024) focused on how participative leadership and cultural factors influence employees’ speaking-up behavior and knowledge-sharing within supplier development. Practical implications involve fostering a highly inclusive and collaborative work environment aligning with TQM goals.
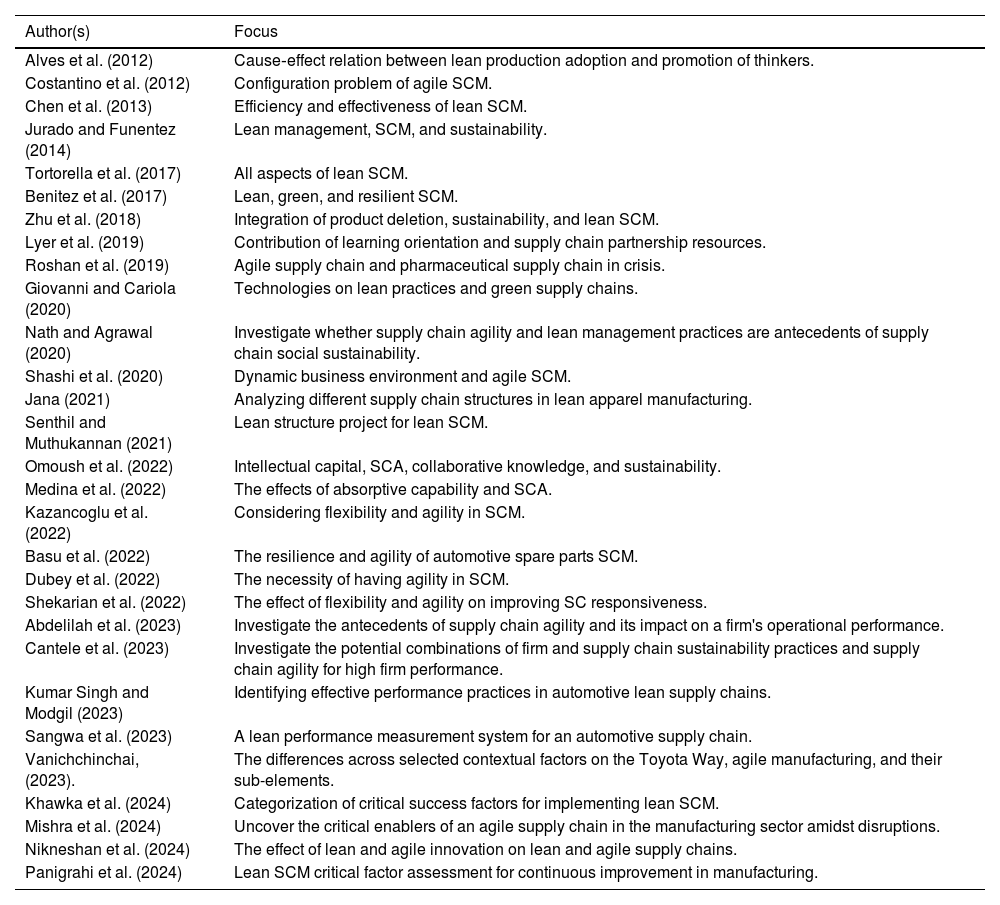
Previous studies on the impact of lean and agile SCM on quality conceptsTable 1 outlines the efforts made by the existing literature to study the role played by lean and agile SCM in developing quality concepts. These tables present studies facilitating the connection between lean and agile SCM and TQM. However, these studies have been inadequate in supporting a comprehensive evaluation of the decisions to achieve TQM goals.
Previous studies on lean and agile SCM approaches to quality concepts.
| Author(s) | Focus |
|---|---|
| Alves et al. (2012) | Cause‐effect relation between lean production adoption and promotion of thinkers. |
| Costantino et al. (2012) | Configuration problem of agile SCM. |
| Chen et al. (2013) | Efficiency and effectiveness of lean SCM. |
| Jurado and Funentez (2014) | Lean management, SCM, and sustainability. |
| Tortorella et al. (2017) | All aspects of lean SCM. |
| Benitez et al. (2017) | Lean, green, and resilient SCM. |
| Zhu et al. (2018) | Integration of product deletion, sustainability, and lean SCM. |
| Lyer et al. (2019) | Contribution of learning orientation and supply chain partnership resources. |
| Roshan et al. (2019) | Agile supply chain and pharmaceutical supply chain in crisis. |
| Giovanni and Cariola (2020) | Technologies on lean practices and green supply chains. |
| Nath and Agrawal (2020) | Investigate whether supply chain agility and lean management practices are antecedents of supply chain social sustainability. |
| Shashi et al. (2020) | Dynamic business environment and agile SCM. |
| Jana (2021) | Analyzing different supply chain structures in lean apparel manufacturing. |
| Senthil and Muthukannan (2021) | Lean structure project for lean SCM. |
| Omoush et al. (2022) | Intellectual capital, SCA, collaborative knowledge, and sustainability. |
| Medina et al. (2022) | The effects of absorptive capability and SCA. |
| Kazancoglu et al. (2022) | Considering flexibility and agility in SCM. |
| Basu et al. (2022) | The resilience and agility of automotive spare parts SCM. |
| Dubey et al. (2022) | The necessity of having agility in SCM. |
| Shekarian et al. (2022) | The effect of flexibility and agility on improving SC responsiveness. |
| Abdelilah et al. (2023) | Investigate the antecedents of supply chain agility and its impact on a firm's operational performance. |
| Cantele et al. (2023) | Investigate the potential combinations of firm and supply chain sustainability practices and supply chain agility for high firm performance. |
| Kumar Singh and Modgil (2023) | Identifying effective performance practices in automotive lean supply chains. |
| Sangwa et al. (2023) | A lean performance measurement system for an automotive supply chain. |
| Vanichchinchai, (2023). | The differences across selected contextual factors on the Toyota Way, agile manufacturing, and their sub-elements. |
| Khawka et al. (2024) | Categorization of critical success factors for implementing lean SCM. |
| Mishra et al. (2024) | Uncover the critical enablers of an agile supply chain in the manufacturing sector amidst disruptions. |
| Nikneshan et al. (2024) | The effect of lean and agile innovation on lean and agile supply chains. |
| Panigrahi et al. (2024) | Lean SCM critical factor assessment for continuous improvement in manufacturing. |
In summary, based on the literature review, it can be concluded that the previous studies did not offer a comprehensive approach to the interaction between SCM and TQM. Their scope is valuable but too limited to allow for a successful analysis of TQM, starting with qualitative elements or quantitative data collected within lean and agile SCM systems.
MethodologyCompared to the previous ones, the innovative idea of this study is to focus on making a compelling connection between the components of lean and agile SCM and the main domains of TQM. The current paper introduces an evaluation procedure where a quantitative assessment of an organization's lean and agile SCM system is performed and used to assist TQM practitioners in selecting the right course of action for achieving prearranged and well-defined TQM goals.
The methodology follows the typical multicriteria decision-making approach where researchers’ knowledge and practitioners’ experience are combined to draw and weight relevant factors. The general research framework is based on coordination and integration. We coordinate the efforts of all the actors involved in the study: academic researchers and selected TQM practitioners. We integrate different and often distant perspectives for an accurate definition and comprehensive assessment of the factors interlinking SCM and TQM within lean and agile environments. Fig. 1 represents the proposed research framework. The arrows indicate the links representing broad (internal two-way arrows) and specific (external arrow) viewpoints.
We refer to Rostamkhani and Ramayah (2023) for the component structure of SCM. Regarding the TQM domains, we identify them with the seven essential principles of TQM introduced by Besterfield et al. (2012) and Oakland et al. (2020): quality tools, product design, customer focus, supplier quality, process management, employee commitment, and continuous improvement. We focus on the first five of these domains of TQM, that is, those allowing for corresponding concepts in SCM.
The following sections will introduce the specific lean and agile indicators and the TQM goals.
Proposed evaluation procedureWithin this framework, we propose a comprehensive and integrated four-phase procedure for assessing the impact of lean and agile SCM on the domains of TQM and the consequent achievement of specific TQM goals. The phases of the proposed evaluation procedure are outlined below. A detailed description of each phase will be provided in the following sections.
Phase 1 (Qualitative phase): This phase consists of defining qualitative concepts, including indicators, sub-indicators, and relevant characteristics, that can link the lean and agility of SCM to TQM goals. The TQM goals are also identified in this phase.
In summary: Researchers and practitioners define indicators, sub-indicators, and relevant characteristics.
Phase 2 (Quantitative phase): This phase introduces the mathematical model. Evaluation matrices and weight vectors are defined for a quantitative assessment of the concepts of Phase 1 and to assign total scores to both the lean and the agile approaches.
In this phase, the researchers code the mathematical formulation using software known to the practitioners. We have prepared an Excel spreadsheet to compute partial and total scores since Excel is a worldwide known and relatively easy-to-use software. At the same time, the selected TQM practitioners analyze all the concepts of Phase 1 and provide the necessary data to run the mathematical model.
In summary: (a) Researchers define evaluation matrices, weight vectors, and all the formulas to assign a score to each indicator and sub-indicator and a total score to both lean SCM and agile SCM separately; (b) Researchers code all the formulas using an Excel spreadsheet (or another software known to the practitioners); (c) Senior practitioners assign importance weights to indicators, sub-indicators, and characteristics; (d) General practitioners provide a quantitative evaluation of the characteristics; and (e) All practitioners use the Excel spreadsheet to compute the partial and total scores of lean and agile SCM.
Phase 3 (Action plan recommendation): Determining the action plan to recommend for the target organization and implementing the recommended actions.
In summary: Practitioners choose the action plan based on a specific classification schema and oversee the implementation of the corresponding actions, ensuring that the selected approach to TQM is pursued.
Phase 4(Assessment of results): Validating the methodology and verifying whether there has been an actual improvement in terms of productivity and sustainability using Process Capability Indices (PCI).
In summary: Independent practitioners (external experts) are called to act as referees and evaluate the methodology's validity based on the concrete results obtained for the target organization.
Fig. 2 presents a schematic representation of the four phases above, describing the actors (researchers and practitioners) involved in each phase.
Selecting TQM expertsTQM practitioners play a crucial role in all the phases outlined above. They are called to perform all the qualitative and quantitative evaluations that will take place through the different phases. The assessments provided by senior and general practitioners allow data collection for the mathematical model. The practitioners analyze the data through an Excel spreadsheet. Finally, a second group of practitioners, i.e., external experts, act as referees to appraise the validity and reliability of the results obtained. Consequently, selecting TQM practitioners is the first key issue to consider.
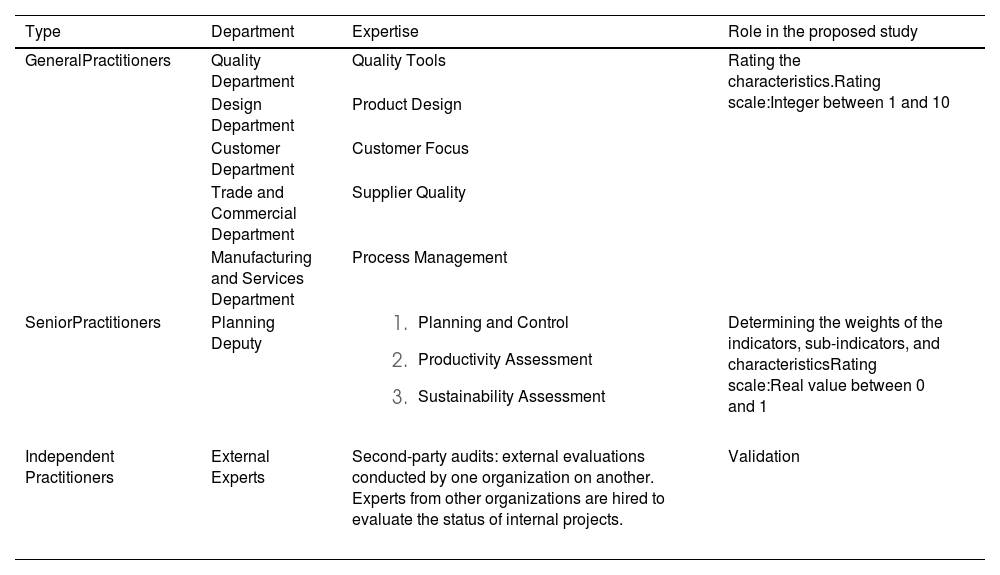
Fig. 3 outlines the different levels of TQM knowledge considered for selecting the experts. The categories of experts involved in our evaluation procedure, their expertise, and their role are summarized in Appendix A.
Selecting the TQM practitioners (Phases 1 to 3)To evaluate the empirical validity of the proposed framework and evaluation procedure, we contacted 33 organizations operating in the Middle East. The organizations were asked for the availability of their TQM experts. One organization was chosen as the target organization to check the applicability and validity of the proposed four-phase evaluation procedure.
Two types of practitioners had to be selected: (1) general practitioners to evaluate the lean and agile indicators, sub-indicators, and characteristics concerning the TQM domains; (2) senior practitioners to weight the lean and agile indicators, sub-indicators, and characteristics.
General practitionersFor the general practitioners, we proceeded as follows. First, we regarded the group of 33 organizations that agreed to participate in our study as the research population and determined the sample size to guarantee accuracy when gathering data.
For populations that are not too large, a sample can be selected using a variant of Cochran's formula (Nanjundeswaraswamy and Divakar, 2021):
where:n is the sample size
N is the community size
d is the tolerable error (between 0.01 and 0.1)
z is the standard deviation in the average variability
p is the approximate prevalence rate for which the survey is conducted
q equals 1−p
This formula is obtained for small populations by combining the standard Cochran's formula n0=z2pqd2 (sample size for a large population proportion) with the adjustment formula n=n0/[1+n0−1N].
Thus, we calculated the population sample size using Eq. (1) and the following values for the parameters:
Obtaining the sample size:
Once the sample size was known, we had to define a rule to choose 25 organizations out of the 33 available. The population of 33 organizations was categorized according to the five main domains of TQM considered in this study. Table 2 outlines these five domains.
Each of the 33 organizations was associated with one or more domains. Hence, 25 organizations were selected so that it was possible to divide them into five groups of five units each. Finally, we invited one representative from each of the 25 organizations and put the representative in the corresponding group.
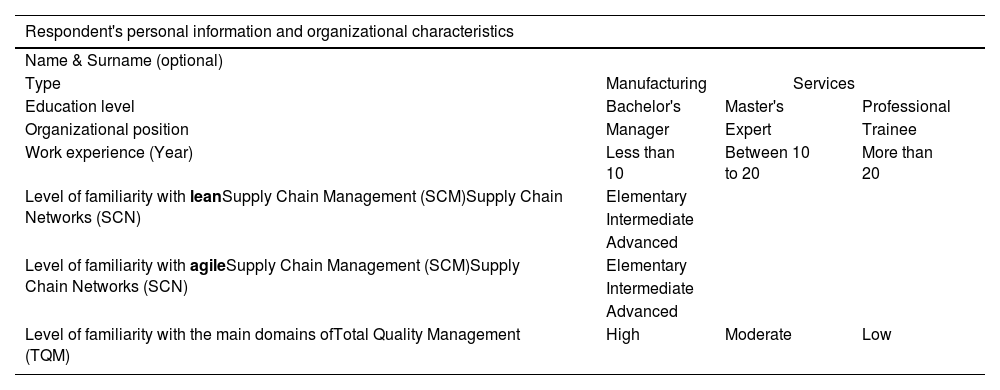
The invitations to experts were sent based on the information provided by the experts themselves regarding their personal and organizational experiences through a questionnaire. This questionnaire – included in Appendix B – assessed the possible candidates based on the following indicators: educational level, managerial position, work experience (year), and familiarity with lean and agile SCM. The human resources management departments of the 25 selected organizations verified the information collected through the questionnaire.
Senior practitionersFor the senior practitioners, we proceeded as follows. For each group of general practitioners, one senior practitioner was invited from one of the five organizations of the general practitioners in the group. In this way, a group of five senior practitioners was created. The information collected with the questionnaire was used again to guide the choice of the senior experts.
Selecting the TQM external experts (Phase 4)The research validation was carried out based on independent expert's opinions. This is in line with many researchers’ perspectives. Expert judgments are one of the best tools for conducting content validation, given that the experts’ competence has been correctly assessed based on experience, suitable education, and level of topic familiarity (Perez and Martinez, 2008; Fernández-Gómez et al., 2020).
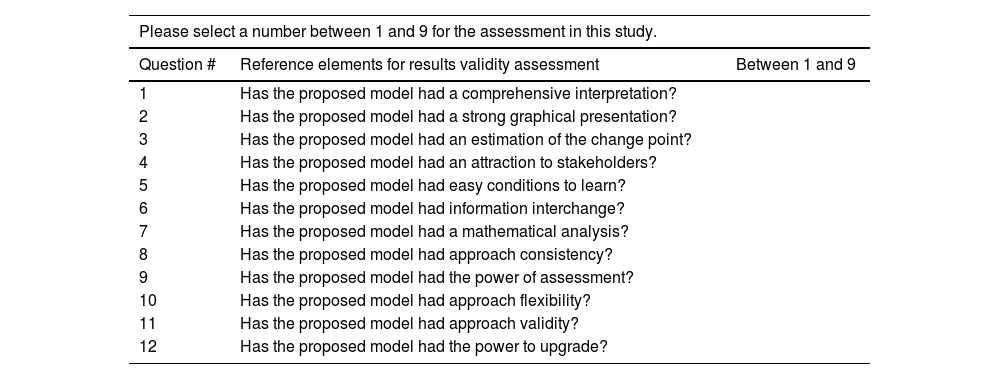
For this study, we asked the target organization to contact TQM external experts they trusted and had already contracted for project evaluation. However, we provided the organization with a questionnaire for the experts to apprise the proposed methodology and its applicability. The questionnaire is included in Appendix C.
Phase 1: qualitative phaseLean and agile indicators to link SCM to the main domains of TQMRegarding the leading indicators, we build on the research of Rostamkhani and Karbasian (2020) and Rostamkhani and Ramayah (2023), who introduced two different categories of indicators for leading commercial, industrial, and military organizations to implement and exploit lean and agile approaches in SCM successfully.
Lean and agile SCM have the same components. Thus, in the qualitative phase, the differences between the lean and agile contexts are reflected by introducing innovative indicators, sub-indicators, and their characteristics. Table 3 shows the leading indicators proposed in this study.
Lean and agile indicators vs. SCM components.
| Lean SCM | Agile SCM | SCMComponents | ||
|---|---|---|---|---|
| Indicator | Proposed Main LeanIndicators | Indicator | Proposed Main LeanIndicators | |
| I1 | Customer satisfaction | I1 | Rapid response | Customers |
| I2 | Predicting all processes | I2 | Consumption estimation | Forecasting |
| I3 | Flexible product design | I3 | Modular product design | Designing |
| I4 | Creating reliable processes | I4 | Creating flexible processes | Processing |
| I5 | Creating required processes | I5 | Creating all valued processes | Inventory |
| I6 | Effectiveness of the suppliers | I6 | Using information technology | Purchasing |
| I7 | Reinforcement of the suppliers | I7 | Involving suppliers in development | Suppliers |
| I8 | Correct placement of the products | I8 | Keeping the work environment clean | Location |
| I9 | On-time and reliable delivery of product | I9 | Equipping after-sales service centers | Logistics |
As shown in Table 3, the leading lean and agile indicators are defined as being in one-to-one correspondence with the components of lean and agile SCM, respectively. At the same time, each indicator is associated with one or more of the main domains of TQM. As mentioned above, this study focuses on the five primary domains of TQM, as outlined in Table 2.
Fig. 4 presents the relationships between the proposed lean and agile indicators and the considered TQM domains. These tables summarize which lean/agile indicator covers which TQM domain and, vice versa, which TQM domain is reflected by which indicator.
Finally, Table 4 lists the goals of TQM considered in this study. These goals have been defined with the help of the selected TQM practitioners based on their experience and data from the organizations involved in the study (see Appendix D).
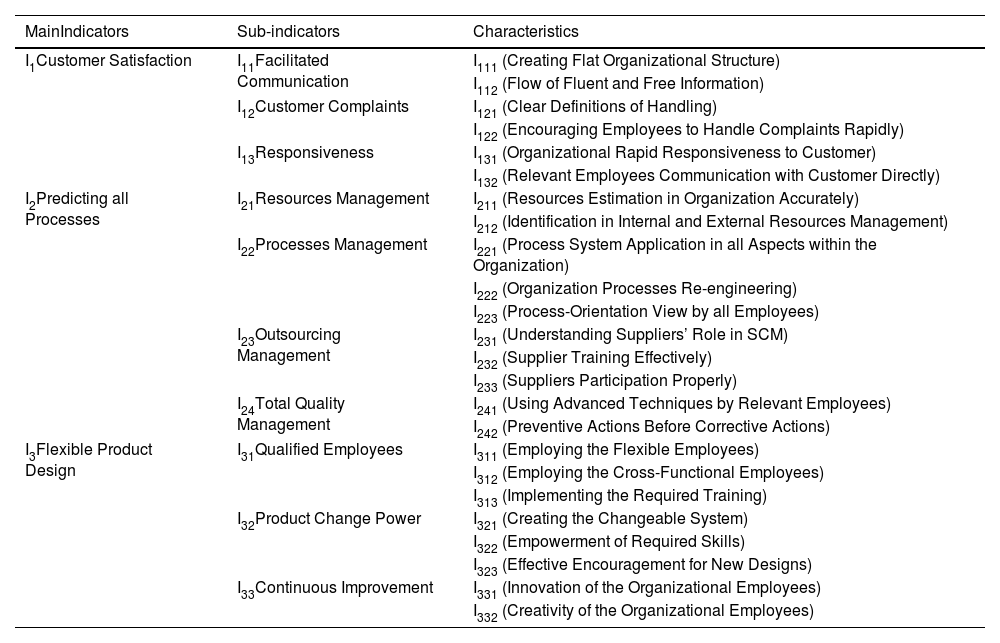
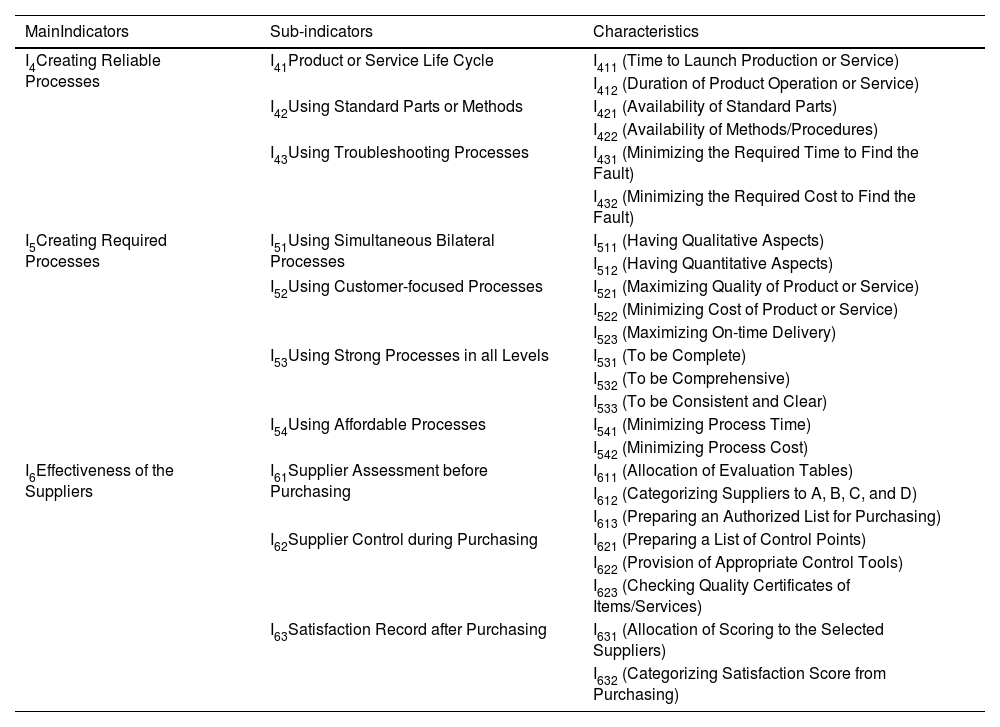
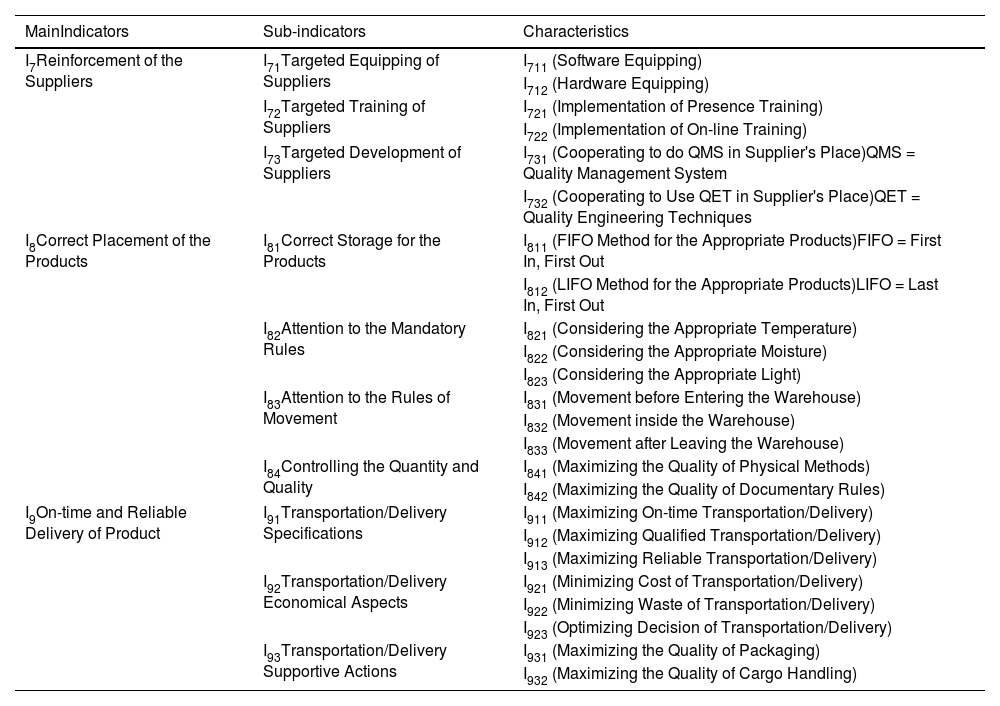
Introducing lean and agile sub-indicators and the corresponding characteristicsOne of the main contributions of the current paper is to show that five of the main domains of TQM can be covered by correctly defining not only leading indicators but also sub-indicators and their characteristics in lean and agile SCM. In principle, this type of categorization can be developed based on a careful and systematic literature review and the researchers’ knowledge. In our case, we used a literature review to extract the leading indicators. We combined our knowledge and experience with those of the TQM practitioners to determine the declination of sub-indicators and characteristics.
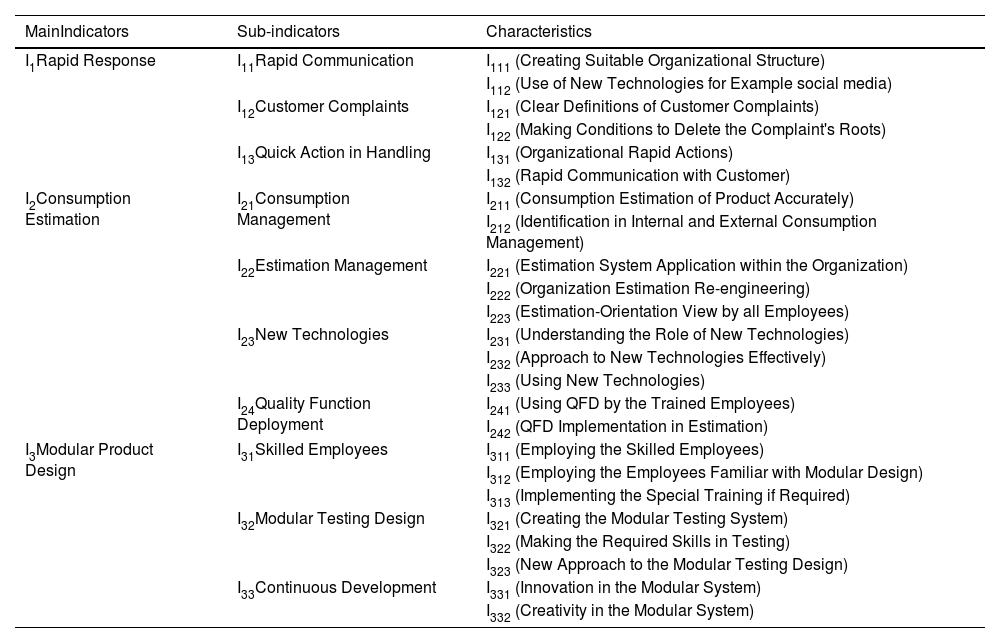
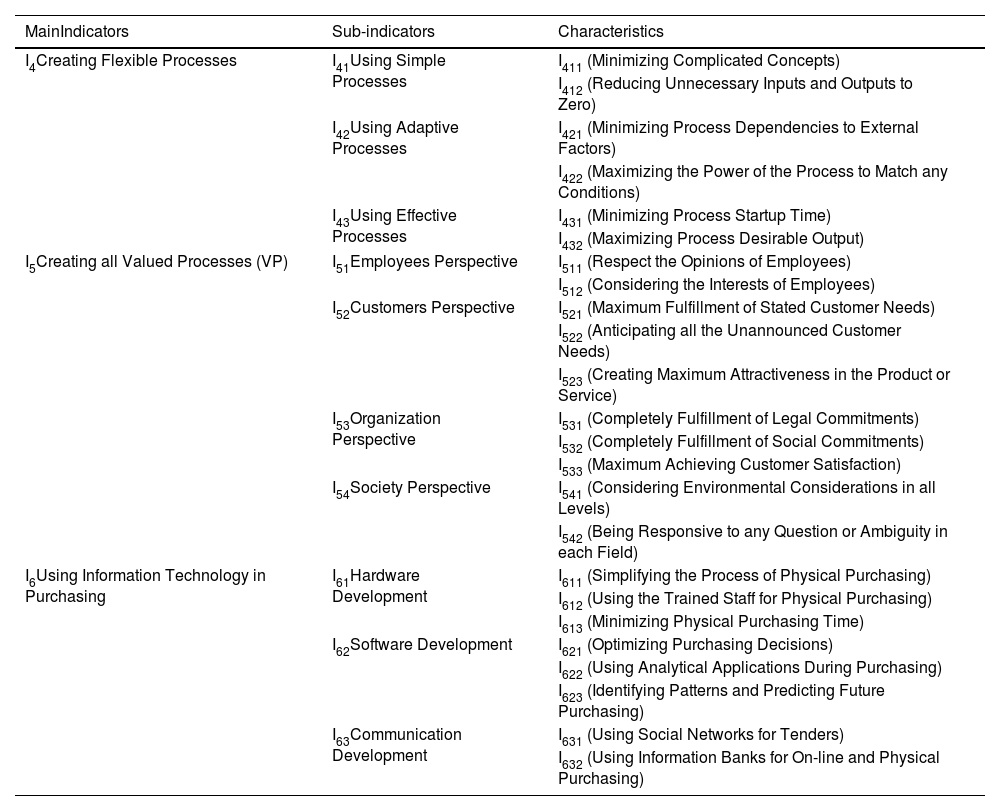
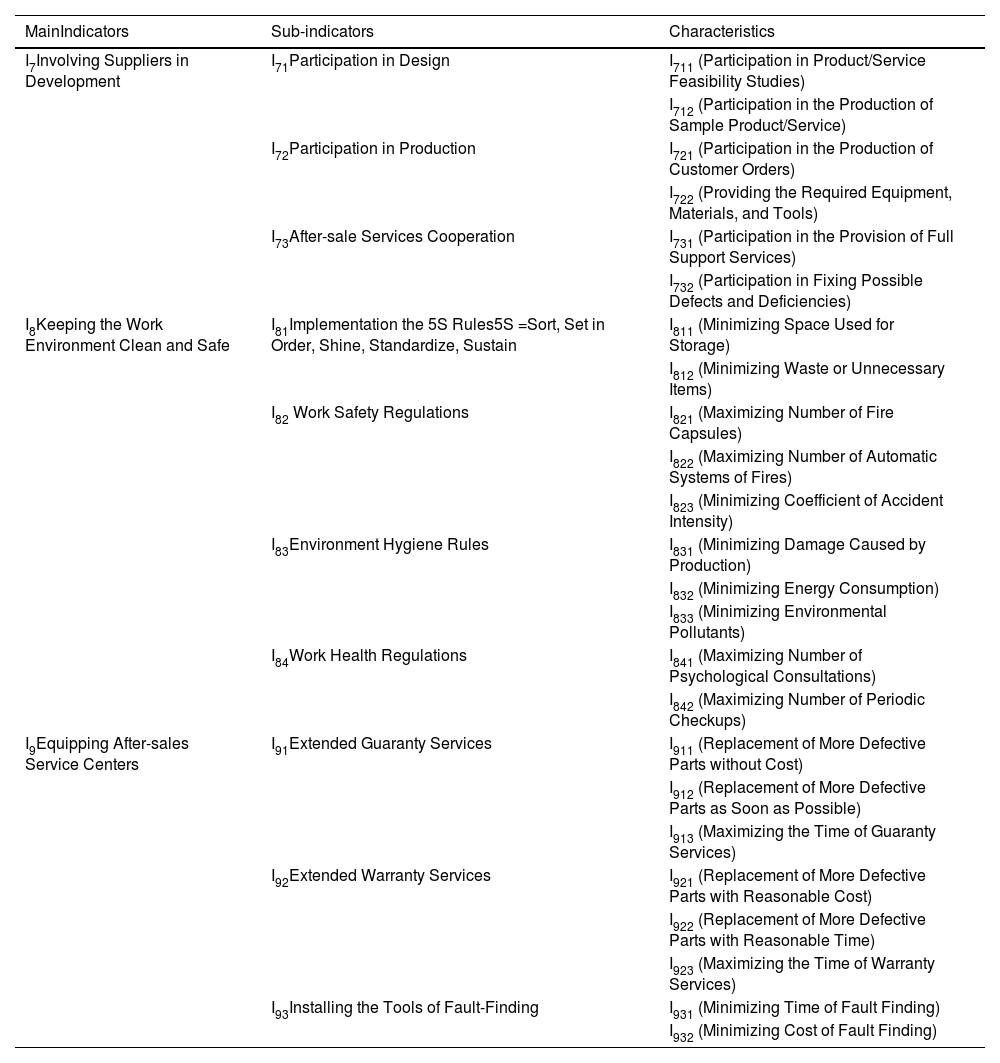
Tables 5–7 show the sub-indicators and characteristics proposed for the lean indicators. Tables 8–10 show the sub-indicators and characteristics proposed for the agile indicators.
Sub-indicators and characteristics of I1, I2, and I3 in lean SCM.
| MainIndicators | Sub-indicators | Characteristics |
|---|---|---|
| I1Customer Satisfaction | I11Facilitated Communication | I111 (Creating Flat Organizational Structure) |
| I112 (Flow of Fluent and Free Information) | ||
| I12Customer Complaints | I121 (Clear Definitions of Handling) | |
| I122 (Encouraging Employees to Handle Complaints Rapidly) | ||
| I13Responsiveness | I131 (Organizational Rapid Responsiveness to Customer) | |
| I132 (Relevant Employees Communication with Customer Directly) | ||
| I2Predicting all Processes | I21Resources Management | I211 (Resources Estimation in Organization Accurately) |
| I212 (Identification in Internal and External Resources Management) | ||
| I22Processes Management | I221 (Process System Application in all Aspects within the Organization) | |
| I222 (Organization Processes Re-engineering) | ||
| I223 (Process-Orientation View by all Employees) | ||
| I23Outsourcing Management | I231 (Understanding Suppliers’ Role in SCM) | |
| I232 (Supplier Training Effectively) | ||
| I233 (Suppliers Participation Properly) | ||
| I24Total Quality Management | I241 (Using Advanced Techniques by Relevant Employees) | |
| I242 (Preventive Actions Before Corrective Actions) | ||
| I3Flexible Product Design | I31Qualified Employees | I311 (Employing the Flexible Employees) |
| I312 (Employing the Cross-Functional Employees) | ||
| I313 (Implementing the Required Training) | ||
| I32Product Change Power | I321 (Creating the Changeable System) | |
| I322 (Empowerment of Required Skills) | ||
| I323 (Effective Encouragement for New Designs) | ||
| I33Continuous Improvement | I331 (Innovation of the Organizational Employees) | |
| I332 (Creativity of the Organizational Employees) |
Sub-indicators and characteristics of I4, I5, and I6 in lean SCM.
| MainIndicators | Sub-indicators | Characteristics |
|---|---|---|
| I4Creating Reliable Processes | I41Product or Service Life Cycle | I411 (Time to Launch Production or Service) |
| I412 (Duration of Product Operation or Service) | ||
| I42Using Standard Parts or Methods | I421 (Availability of Standard Parts) | |
| I422 (Availability of Methods/Procedures) | ||
| I43Using Troubleshooting Processes | I431 (Minimizing the Required Time to Find the Fault) | |
| I432 (Minimizing the Required Cost to Find the Fault) | ||
| I5Creating Required Processes | I51Using Simultaneous Bilateral Processes | I511 (Having Qualitative Aspects) |
| I512 (Having Quantitative Aspects) | ||
| I52Using Customer-focused Processes | I521 (Maximizing Quality of Product or Service) | |
| I522 (Minimizing Cost of Product or Service) | ||
| I523 (Maximizing On-time Delivery) | ||
| I53Using Strong Processes in all Levels | I531 (To be Complete) | |
| I532 (To be Comprehensive) | ||
| I533 (To be Consistent and Clear) | ||
| I54Using Affordable Processes | I541 (Minimizing Process Time) | |
| I542 (Minimizing Process Cost) | ||
| I6Effectiveness of the Suppliers | I61Supplier Assessment before Purchasing | I611 (Allocation of Evaluation Tables) |
| I612 (Categorizing Suppliers to A, B, C, and D) | ||
| I613 (Preparing an Authorized List for Purchasing) | ||
| I62Supplier Control during Purchasing | I621 (Preparing a List of Control Points) | |
| I622 (Provision of Appropriate Control Tools) | ||
| I623 (Checking Quality Certificates of Items/Services) | ||
| I63Satisfaction Record after Purchasing | I631 (Allocation of Scoring to the Selected Suppliers) | |
| I632 (Categorizing Satisfaction Score from Purchasing) |
Sub-indicators and characteristics of I7, I8, and I9 in lean SCM.
| MainIndicators | Sub-indicators | Characteristics |
|---|---|---|
| I7Reinforcement of the Suppliers | I71Targeted Equipping of Suppliers | I711 (Software Equipping) |
| I712 (Hardware Equipping) | ||
| I72Targeted Training of Suppliers | I721 (Implementation of Presence Training) | |
| I722 (Implementation of On-line Training) | ||
| I73Targeted Development of Suppliers | I731 (Cooperating to do QMS in Supplier's Place)QMS = Quality Management System | |
| I732 (Cooperating to Use QET in Supplier's Place)QET = Quality Engineering Techniques | ||
| I8Correct Placement of the Products | I81Correct Storage for the Products | I811 (FIFO Method for the Appropriate Products)FIFO = First In, First Out |
| I812 (LIFO Method for the Appropriate Products)LIFO = Last In, First Out | ||
| I82Attention to the Mandatory Rules | I821 (Considering the Appropriate Temperature) | |
| I822 (Considering the Appropriate Moisture) | ||
| I823 (Considering the Appropriate Light) | ||
| I83Attention to the Rules of Movement | I831 (Movement before Entering the Warehouse) | |
| I832 (Movement inside the Warehouse) | ||
| I833 (Movement after Leaving the Warehouse) | ||
| I84Controlling the Quantity and Quality | I841 (Maximizing the Quality of Physical Methods) | |
| I842 (Maximizing the Quality of Documentary Rules) | ||
| I9On-time and Reliable Delivery of Product | I91Transportation/Delivery Specifications | I911 (Maximizing On-time Transportation/Delivery) |
| I912 (Maximizing Qualified Transportation/Delivery) | ||
| I913 (Maximizing Reliable Transportation/Delivery) | ||
| I92Transportation/Delivery Economical Aspects | I921 (Minimizing Cost of Transportation/Delivery) | |
| I922 (Minimizing Waste of Transportation/Delivery) | ||
| I923 (Optimizing Decision of Transportation/Delivery) | ||
| I93Transportation/Delivery Supportive Actions | I931 (Maximizing the Quality of Packaging) | |
| I932 (Maximizing the Quality of Cargo Handling) |
Sub-indicators and characteristics of I1, I2, and I3 in agile SCM.
| MainIndicators | Sub-indicators | Characteristics |
|---|---|---|
| I1Rapid Response | I11Rapid Communication | I111 (Creating Suitable Organizational Structure) |
| I112 (Use of New Technologies for Example social media) | ||
| I12Customer Complaints | I121 (Clear Definitions of Customer Complaints) | |
| I122 (Making Conditions to Delete the Complaint's Roots) | ||
| I13Quick Action in Handling | I131 (Organizational Rapid Actions) | |
| I132 (Rapid Communication with Customer) | ||
| I2Consumption Estimation | I21Consumption Management | I211 (Consumption Estimation of Product Accurately) |
| I212 (Identification in Internal and External Consumption Management) | ||
| I22Estimation Management | I221 (Estimation System Application within the Organization) | |
| I222 (Organization Estimation Re-engineering) | ||
| I223 (Estimation-Orientation View by all Employees) | ||
| I23New Technologies | I231 (Understanding the Role of New Technologies) | |
| I232 (Approach to New Technologies Effectively) | ||
| I233 (Using New Technologies) | ||
| I24Quality Function Deployment | I241 (Using QFD by the Trained Employees) | |
| I242 (QFD Implementation in Estimation) | ||
| I3Modular Product Design | I31Skilled Employees | I311 (Employing the Skilled Employees) |
| I312 (Employing the Employees Familiar with Modular Design) | ||
| I313 (Implementing the Special Training if Required) | ||
| I32Modular Testing Design | I321 (Creating the Modular Testing System) | |
| I322 (Making the Required Skills in Testing) | ||
| I323 (New Approach to the Modular Testing Design) | ||
| I33Continuous Development | I331 (Innovation in the Modular System) | |
| I332 (Creativity in the Modular System) |
Sub-indicators and characteristics of I4, I5, and I6 in agile SCM.
| MainIndicators | Sub-indicators | Characteristics |
|---|---|---|
| I4Creating Flexible Processes | I41Using Simple Processes | I411 (Minimizing Complicated Concepts) |
| I412 (Reducing Unnecessary Inputs and Outputs to Zero) | ||
| I42Using Adaptive Processes | I421 (Minimizing Process Dependencies to External Factors) | |
| I422 (Maximizing the Power of the Process to Match any Conditions) | ||
| I43Using Effective Processes | I431 (Minimizing Process Startup Time) | |
| I432 (Maximizing Process Desirable Output) | ||
| I5Creating all Valued Processes (VP) | I51Employees Perspective | I511 (Respect the Opinions of Employees) |
| I512 (Considering the Interests of Employees) | ||
| I52Customers Perspective | I521 (Maximum Fulfillment of Stated Customer Needs) | |
| I522 (Anticipating all the Unannounced Customer Needs) | ||
| I523 (Creating Maximum Attractiveness in the Product or Service) | ||
| I53Organization Perspective | I531 (Completely Fulfillment of Legal Commitments) | |
| I532 (Completely Fulfillment of Social Commitments) | ||
| I533 (Maximum Achieving Customer Satisfaction) | ||
| I54Society Perspective | I541 (Considering Environmental Considerations in all Levels) | |
| I542 (Being Responsive to any Question or Ambiguity in each Field) | ||
| I6Using Information Technology in Purchasing | I61Hardware Development | I611 (Simplifying the Process of Physical Purchasing) |
| I612 (Using the Trained Staff for Physical Purchasing) | ||
| I613 (Minimizing Physical Purchasing Time) | ||
| I62Software Development | I621 (Optimizing Purchasing Decisions) | |
| I622 (Using Analytical Applications During Purchasing) | ||
| I623 (Identifying Patterns and Predicting Future Purchasing) | ||
| I63Communication Development | I631 (Using Social Networks for Tenders) | |
| I632 (Using Information Banks for On-line and Physical Purchasing) |
Sub-indicators and characteristics of I7, I8, and I9 in agile SCM.
| MainIndicators | Sub-indicators | Characteristics |
|---|---|---|
| I7Involving Suppliers in Development | I71Participation in Design | I711 (Participation in Product/Service Feasibility Studies) |
| I712 (Participation in the Production of Sample Product/Service) | ||
| I72Participation in Production | I721 (Participation in the Production of Customer Orders) | |
| I722 (Providing the Required Equipment, Materials, and Tools) | ||
| I73After-sale Services Cooperation | I731 (Participation in the Provision of Full Support Services) | |
| I732 (Participation in Fixing Possible Defects and Deficiencies) | ||
| I8Keeping the Work Environment Clean and Safe | I81Implementation the 5S Rules5S =Sort, Set in Order, Shine, Standardize, Sustain | I811 (Minimizing Space Used for Storage) |
| I812 (Minimizing Waste or Unnecessary Items) | ||
| I82 Work Safety Regulations | I821 (Maximizing Number of Fire Capsules) | |
| I822 (Maximizing Number of Automatic Systems of Fires) | ||
| I823 (Minimizing Coefficient of Accident Intensity) | ||
| I83Environment Hygiene Rules | I831 (Minimizing Damage Caused by Production) | |
| I832 (Minimizing Energy Consumption) | ||
| I833 (Minimizing Environmental Pollutants) | ||
| I84Work Health Regulations | I841 (Maximizing Number of Psychological Consultations) | |
| I842 (Maximizing Number of Periodic Checkups) | ||
| I9Equipping After-sales Service Centers | I91Extended Guaranty Services | I911 (Replacement of More Defective Parts without Cost) |
| I912 (Replacement of More Defective Parts as Soon as Possible) | ||
| I913 (Maximizing the Time of Guaranty Services) | ||
| I92Extended Warranty Services | I921 (Replacement of More Defective Parts with Reasonable Cost) | |
| I922 (Replacement of More Defective Parts with Reasonable Time) | ||
| I923 (Maximizing the Time of Warranty Services) | ||
| I93Installing the Tools of Fault-Finding | I931 (Minimizing Time of Fault Finding) | |
| I932 (Minimizing Cost of Fault Finding) |
This phase entails the researchers’ involvement in designing a mathematical model that allows for a coherent evaluation of an SCM system and the effort of the general and senior practitioners to acquire all the data (quantitative assessment) necessary to apply the mathematical formulas. More precisely, this phase comprises the following steps:
- 1)
Researchers define a suitable mathematical model
- 2)
Researchers code the mathematical formula using software known to the practitioners.
- 3)
Practitioners provide the data for the model: (a) general practitioners evaluate the characteristics, and (b) senior practitioners assign weights to all indicators, sub-indicators, and characteristics.
- 4)
Practitioners use the coded program to determine all partial and total scores.
This section provides a formal model to assign a total score to an SCM approach based on a determined set of indicators, sub-indicators, and corresponding characteristics.
The key idea behind this formal model is to allow for multiple initial evaluations of the basic elements of the SCM approach, that is, the characteristics. Various evaluations of single characteristics are possible considering different groups of experts. In our case, five groups of general practitioners evaluated each characteristic.
The other initial data required for the model are the importance weights of all the indicators, sub-indicators, and characteristics. A group of experts usually assigns these weights. In our case, a group of senior practitioners provided the weights.
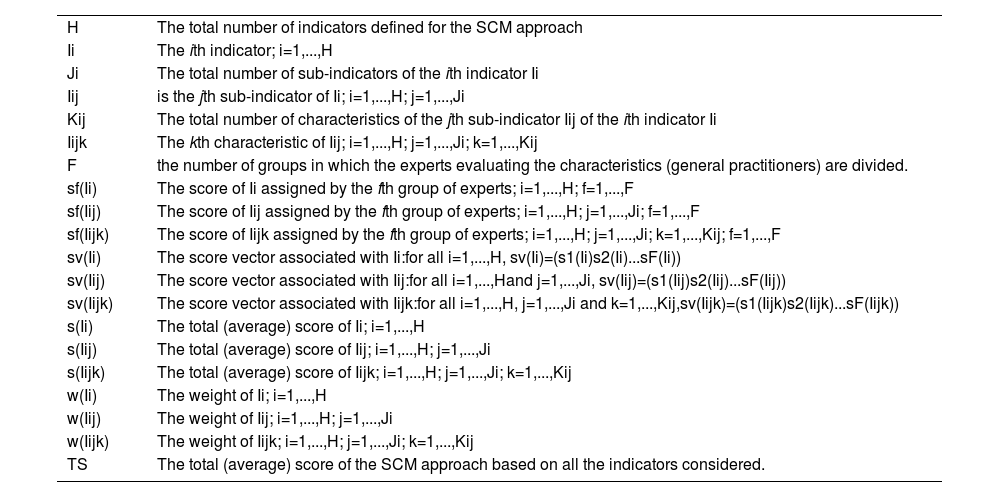
It deserves to be noted that this is a general model and can also be used in other evaluation contexts. We start with the notations and some basic definitions.
| H | The total number of indicators defined for the SCM approach |
| Ii | The ith indicator; i=1,...,H |
| Ji | The total number of sub-indicators of the ith indicator Ii |
| Iij | is the jth sub-indicator of Ii; i=1,...,H; j=1,...,Ji |
| Kij | The total number of characteristics of the jth sub-indicator Iij of the ith indicator Ii |
| Iijk | The kth characteristic of Iij; i=1,...,H; j=1,...,Ji; k=1,...,Kij |
| F | the number of groups in which the experts evaluating the characteristics (general practitioners) are divided. |
| sf(Ii) | The score of Ii assigned by the fth group of experts; i=1,...,H; f=1,...,F |
| sf(Iij) | The score of Iij assigned by the fth group of experts; i=1,...,H; j=1,...,Ji; f=1,...,F |
| sf(Iijk) | The score of Iijk assigned by the fth group of experts; i=1,...,H; j=1,...,Ji; k=1,...,Kij; f=1,...,F |
| sv(Ii) | The score vector associated with Ii:for all i=1,...,H, sv(Ii)=(s1(Ii)s2(Ii)...sF(Ii)) |
| sv(Iij) | The score vector associated with Iij:for all i=1,...,Hand j=1,...,Ji, sv(Iij)=(s1(Iij)s2(Iij)...sF(Iij)) |
| sv(Iijk) | The score vector associated with Iijk:for all i=1,...,H, j=1,...,Ji and k=1,...,Kij,sv(Iijk)=(s1(Iijk)s2(Iijk)...sF(Iijk)) |
| s(Ii) | The total (average) score of Ii; i=1,...,H |
| s(Iij) | The total (average) score of Iij; i=1,...,H; j=1,...,Ji |
| s(Iijk) | The total (average) score of Iijk; i=1,...,H; j=1,...,Ji; k=1,...,Kij |
| w(Ii) | The weight of Ii; i=1,...,H |
| w(Iij) | The weight of Iij; i=1,...,H; j=1,...,Ji |
| w(Iijk) | The weight of Iijk; i=1,...,H; j=1,...,Ji; k=1,...,Kij |
| TS | The total (average) score of the SCM approach based on all the indicators considered. |
The sum of the weights of indicators (Ii), sub-indicators (Iij), and characteristics (Iijk) must be as follows:
As mentioned above, we assume that the multiple initial scores of the single characteristics and all the weights are known. Thus, the data of the mathematical model are as follows:
- •
sv(Iijk)=(s1(Iijk)s2(Iijk)...sF(Iijk)), i=1,...,H, j=1,...,Ji, k=1,...,Kij
- •
w(Ii), i=1,...,H
- •
w(Iij), i=1,...,H, j=1,...,Ji
- •
w(Iijk), i=1,...,H, j=1,...,Ji, k=1,...,Kij
For all i=1,...,H, j=1,...,Ji and k=1,...,Kij, we compute the total score of Iijk:
Then, the scores of sub-indicators are obtained from those of the characteristics. For all i=1,...,Hand j=1,...,Ji, we compute the score vector and the total score of Iij as follows:Similarly, the scores of the indicators are obtained from those of the sub-indicators. For all i=1,...,H, we compute the score vector and the total score of Ii as follows:
Finally, following the same idea, a score vector can be defined considering all the indicators at the same time. That is, a score vector can be defined for the whole SCM approach as follows:
This leads to a total score associated with the set of all the indicators, that is, the SCM approach's total (average) score. The formula for the computation of this total score is as follows:
To ease the computation of the final total score in Eq. (13), one may equivalently proceed as follows: (a) split the set of indicators into two or more subsets; (b) calculate the total score of each subset of indicators; (c) sum all the total scores obtained.
This is particularly useful when there is a considerable number of indicators. As discussed in the previous sections (Sections 4 and 5), five groups of selected general practitioners performed the characteristics evaluations in parallel with this study's real-life situation. Moreover, with the help of the practitioners, it was possible to define nine main indicators, each described by several sub-indicators and corresponding characteristics varying between two and four. Thus, in the calculations, we have used:
The rest of the index dimensions can be understood from the tables in Section 5.
Computation of partial and total scores of lean and agile SCMAn Excel spreadsheet was prepared so the TQM practitioners could perform all the evaluations automatically. The general Excel spreadsheet is reported in Fig. 5.
The Excel spreadsheets used by the TQM practitioners to assess the lean and the agile approaches to SCM for the target organization to achieve TQM goals are available in Appendix E. To simplify the computations, the practitioners split the set of indicators into three subsets and filled in an Excel spreadsheet per each set to assess each of the two methods. Figs. E1 to E3 show the evaluations of the lean approach, while Figs. E4 to E6 are those relative to the agile approach.
The total score of the lean approach was obtained by summing together the partial scores computed using the corresponding three subsets of indicators.
Similarly, the total score of the agile approach was computed as the sum of the partial scores provided by three subsets of indicators.
The details of some of the computations leading to the partial scores of Eqs. (15) and (16) are included in Appendix E.
Phase 3: action plan recommendationIn this phase, the TQM practitioners interpret the total scores obtained for lean and agile SCM. Based on this interpretation, they decide which actions to recommend to the organization to achieve the TQM goals.
The guidelines for interpreting the total scores from Phase 2 were defined, exploiting almost two decades of experience in implementing TQM strategies through data from the 25 organizations participating in the study.
This data set (see Appendix D) comprised the percentages of success in achieving each of the five TQM goals considered in this study. The percentages referred to TQM data/assessments performed by each organization between 2002 and 2020 and were compared to the total score of SCM computed by each organization in the same period. From these data, it was possible to extrapolate three different approaches (i.e., action plans) to deal with TQM.
Table 11 shows the guidelines for interpreting the total scores and selecting the right plan.
Proposed guidelines to select the most adequate action plan.
| Average of Lean and Agile Scores | Recommended Actions in the TQM System of Organization |
|---|---|
| 1 - 2.99 | The TQM structure of the organization needs fundamental changes. |
| 3 - 5.99 | The TQM structure of the organization needs a reinforcement action plan. |
| 6 - 8.99 | The TQM structure of the organization needs a deepening action plan. |
When the total score of lean and agile of an organization's supply chain is low, it means that the basic foundations of the quality management of this organization need a fundamental restructuring (i.e., a complete transformation) to achieve TQM goals. When the average total score of lean and agile of an organization's supply chain is intermediate, it means that the basic foundations of the organization's quality are well established but need to be strengthened to become widespread. When the total score of lean and agile of an organization's supply chain is high, the organization is ready to implement advanced quality plans for deepening.
Based on the average of the lean and agile total scores (6.15 + 6.50)/2 = 6.325, it was concluded that the TQM structure of the target organization needed a deepening action plan.
Fig. 6 provides a schematic representation of the deepening action plan applied to the target organization. Three actions were implemented. The arrows point towards the goals pursued by each action.
Phase 4: results assessmentIn this phase, independent practitioners are asked to validate the methodology and the results. Moreover, the reliability of the tools used to derive the results must be checked. Finally, the organization's progress and performance improvements must be verified due to the methodology's implementation.
ValidityAs already mentioned, we provided the organization with a questionnaire (see Appendix C) for the experts to apprise the proposed methodology and its applicability. Experts were asked to reply to the questions by assigning a value between 1 and 9. The results of this survey are summarized in Table 12.
ReliabilityAs for the tools’ reliability, the matrices used to compute the lean and agile scores were checked by computing Cronbach's alpha coefficient. Cronbach's alpha assesses reliability by comparing the percentage of shared variance, or covariance, among the items to be assessed with the percentage of overall variance. The assessment range of Cronbach's alpha is as follows:
- •
60% and above indicates an acceptable level of reliability.
- •
70% and above indicates a good level of reliability.
- •
80% and above indicates a very good level of reliability.
- •
90% and above indicates the best level of reliability.
The values obtained for this coefficient are given in Table 13.
Progresses in terms of productivity and sustainabilityOne of the best ways of showing the advantages of implementing a scientific approach or model is by using a capability analysis such as PCI. We focused on the benefits deriving from the concepts of productivity and sustainability. To learn more about the importance of managing productivity and sustainability processes in today's modern industries, one may refer to the related research by Gavareshki et al. (2018) and Gavareshki et al. (2020).
The average PCI, usually denoted by Cpmk, was computed for the target organization before and after implementing the recommended actions for achieving TQM goals. The corresponding values are given in Table 14. These values support the validity of the proposed evaluation procedure and the recommended action plan. Moreover, following Anil and Satish (2016) and Olaleye et al. (2023), we can state that the proposed model directly impacts a successful TQM system concerning the main core productivity and sustainability.
DiscussionManagerial implicationsThe current study aims to establish a coherent link between lean and agile SCM concepts and successful TQM practices. From the practical viewpoint, this link can be exploited to propose further applications of the model. The organizations involved in the study were all similar to each other in terms of characteristics and goals, but the specific characteristics of the organization did not affect the implementation of the proposed evaluation procedure. The study could have been performed with a different group of homogeneous organizations.
The key practical advantage of the current study is the involvement of TQM practitioners in all the phases of the proposed procedure. The commitment of severe and experienced practitioners is the key to an accurate global assessment that encompasses assigning total scores to lean and agile SCM, choosing the action plan to implement, and validating the organization's results in terms of productivity and sustainability.
In this sense, ensuring suitable experts are chosen becomes the main problem of organizations interested in computing the scores of their lean and agile SCM approaches. Senior managers are called to take measures that would facilitate the identification of the right TQM experts and their training to act as assessors to deal with this problem. For example, a database with the levels of expertise of the different employees could be created and updated as the employees gain documented experience.
Theoretical implicationsA mathematical model was developed in the quantitative phase to assign a total score to the lean and agile SCM approach. The model's variables (indicators, sub-indicators, and characteristics) reflect a multicriteria-like approach, but the scoring is performed following a tree-like hierarchical structure. The analysis of the variables is based on a bottom-up scheme. The first variables to be considered are those furthest away from the tree's root, i.e., the characteristics. The last variables to assess are those closest to the tree's root, i.e., the leading indicators.
The formulation proposed for this model is general enough to allow for computing the total score of any well-defined SCM system. Consequently, the proposed evaluation procedure can be adjusted to fit several other contexts.
Finally, the mathematical formulas can be coded for an easy and automated computation of all the scores. The Excel software was used in the empirical implementation presented in this study. However, many other software can be used to program the score spreadsheet.
Limitations and future research directionsThe limitations of this study are related to the subjective character of the initial evaluations (of characteristics and weights) performed by the TQM practitioners and used as data to implement the mathematical model. Selecting different practitioners would yield different initial assessments and, consequently, different total scores. Practitioners’ evaluations necessarily suffer from some level of imprecision and uncertainty.
However, this issue has not been considered in the present study. This issue would have made the paper much more theoretical, driving it away from its main purpose. An extension of the model in this direction could be considered for future developments. The use of fuzzy numbers and other fuzzy concepts could be integrated into the proposed procedure to account for subjective biases in the computation of the scores.
Today's industrial world has become very competitive in production and services. This forces organizations to continuously look for an efficient approach to make the best decision in the shortest possible time. An exciting development of the current study would be computing the total score of lean and agile SCM to decide what actions should be implemented to satisfy industries 4.0 and 5.0 requirements. Lean and agile indicators could be defined to account for the components of industrial generations 4.0 and 5.0, and an evaluation procedure could be designed following the methodological approach proposed in this paper. Pursuing a study in this direction would yield a highly applicable framework that can be useful to any organization willing to implement industrial generations 4.0 and 5.0 to improve its competitive profile successfully.
ConclusionThe previous studies have kept the analysis of the features of SCM impacting organizational performance separated from the design of TQM practices. In particular, the recent literature on SCM has focused on integrating lean and agile elements in SCM strategies without paying much attention to possibly related TQM goals.
Many studies have been proposed for lean and agile SCM. However, to our knowledge, none of them has presented a structured analysis of the SCM workflow components’ possible influence on achieving TQM, neither qualitative nor quantitative. Qualitative and/or quantitative concepts have been developed to evaluate lean and agile SCM practices and/or TQM action plans, but no concrete integrated approach has been proposed.
More precisely, none of the existing studies have considered identifying the relationship between the features that allow for an efficient design of lean and agile SCM and those characterizing the TQM assessment framework.
Designing indicators, sub-indicators, and their characteristics represents the first contribution of the current paper. The other novel aspect of the current study is the definition of a formal model that allows scores to be assigned to lean and agile factors in SCM. The actions to implement for a successful TQM are decided based on these scores. Finally, a structured and computer programming-based procedure is introduced to compute the scores of lean and/or agile factors.
We have proposed a comprehensive and collaboration-based framework where suitable lean and agile indicators of SCM are fully characterized and thought scores have been assessed to support the choice of TQM actions for specific predetermined goals.
Two objectives guided the development of the necessary concepts: 1) make use of the components of lean and agile SCM to define and compute the total score of lean and agile SCM; 2) make use of the scores obtained to decide what actions must be implemented in an organization for it to achieve TQM goals.
The combined efforts of the authors and the TQM practitioners favored the design of a four-phase evaluation procedure that served two main purposes: defining lean and agile factors and performing a systematic analysis of the impact that these factors have on the selection process of TQM approaches. More precisely, a qualitative phase (phase 1) for defining indicators, sub-indicators, and characteristics is followed by a quantitative phase (phase 2) for assessing all the indicators and the whole SCM approach by applying a mathematical model. This phase is followed by an action recommendation phase (phase 3), while a validation phase (phase 4) for assessing the validity and reliability of the results ends the procedure.
A case study was conducted involving 33 organizations operating in the Middle East To evaluate the empirical validity of the proposed framework. The organizations were asked for the availability of their TQM experts. One organization was chosen as the target organization to check the applicability and validity of the proposed four-phase evaluation procedure.
Managerial and theoretical implications have been highlighted. Advantages and limitations have been illustrated together with some possible future research directions.
CRediT authorship contribution statementMadjid Tavana: Writing – review & editing, Writing – original draft, Methodology, Formal analysis, Conceptualization. Debora Di Caprio: Writing – review & editing, Visualization, Validation, Methodology, Formal analysis. Ramin Rostamkhani: Writing – review & editing, Writing – original draft, Methodology, Formal analysis, Conceptualization.
Expertise and role of TQM Experts
| Type | Department | Expertise | Role in the proposed study |
|---|---|---|---|
| GeneralPractitioners | Quality Department | Quality Tools | Rating the characteristics.Rating scale:Integer between 1 and 10 |
| Design Department | Product Design | ||
| Customer Department | Customer Focus | ||
| Trade and Commercial Department | Supplier Quality | ||
| Manufacturing and Services Department | Process Management | ||
| SeniorPractitioners | Planning Deputy |
| Determining the weights of the indicators, sub-indicators, and characteristicsRating scale:Real value between 0 and 1 |
| Independent Practitioners | External Experts | Second-party audits: external evaluations conducted by one organization on another. Experts from other organizations are hired to evaluate the status of internal projects. | Validation |
Questionnaire for Practitioners
| Respondent's personal information and organizational characteristics | ||||
|---|---|---|---|---|
| Name & Surname (optional) | ||||
| Type | Manufacturing | Services | ||
| Education level | Bachelor's | Master's | Professional | |
| Organizational position | Manager | Expert | Trainee | |
| Work experience (Year) | Less than 10 | Between 10 to 20 | More than 20 | |
| Level of familiarity with leanSupply Chain Management (SCM)Supply Chain Networks (SCN) | Elementary | |||
| Intermediate | ||||
| Advanced | ||||
| Level of familiarity with agileSupply Chain Management (SCM)Supply Chain Networks (SCN) | Elementary | |||
| Intermediate | ||||
| Advanced | ||||
| Level of familiarity with the main domains ofTotal Quality Management (TQM) | High | Moderate | Low | |
Questionnaire for External Experts
| Please select a number between 1 and 9 for the assessment in this study. | ||
|---|---|---|
| Question # | Reference elements for results validity assessment | Between 1 and 9 |
| 1 | Has the proposed model had a comprehensive interpretation? | |
| 2 | Has the proposed model had a strong graphical presentation? | |
| 3 | Has the proposed model had an estimation of the change point? | |
| 4 | Has the proposed model had an attraction to stakeholders? | |
| 5 | Has the proposed model had easy conditions to learn? | |
| 6 | Has the proposed model had information interchange? | |
| 7 | Has the proposed model had a mathematical analysis? | |
| 8 | Has the proposed model had approach consistency? | |
| 9 | Has the proposed model had the power of assessment? | |
| 10 | Has the proposed model had approach flexibility? | |
| 11 | Has the proposed model had approach validity? | |
| 12 | Has the proposed model had the power to upgrade? | |
Implementation of the proposed mathematical model for the target organization
This section includes the Excel spreadsheets actually used by the TQM practitioners to assess the lean approach to SCM for the target organization to achieve TQM goals. To simplify the computations, the practitioners split the set of indicators in three subsets and filled in an Excel spreadsheet per each set. Fig. E1 shows the assessment of lean SCM considering the subset {I1,I2,I3}. Similarly, Figs. E2 and E3 show the assessment of lean SCM considering the subsets {I4,I5,I6} and {I7,I8,I9}, respectively. The total score of the lean approach is the total of all partial scores provided by the three spreadsheets.
This section includes the Excel spreadsheets used by the TQM practitioners to assess the agile approach to SCM for the target organization to achieve TQM goals. As for the lean approach, the practitioners assessed agile SCM using three Excel spreadsheets. Fig. E4 shows the assessment of agile SCM based on the subset {I1,I2,I3}. Similarly, Figs. E5 and E6 show the assessment of agile SCM considering the subsets {I4,I5,I6} and {I7,I8,I9}, respectively. Hence, the total score of the whole approach was computed by summing together the partial scores provided by the three subsets of indicators.
For the sake of completeness and to further clarify how the mathematical model works, we show the details of some of the evaluation matrices, weight vectors, and calculations yielding the partial score of lean SCM based on the first three indicators, that is, TS{I1,I2,I3}lean. These are the numerical values of Fig. E1. The calculations leading to the other total scores of lean and agile SCM in Figs. E2 to E6 are developed similarly.
The general practitioners assign the characteristics’ score vectors. The total scores are computed as averages of the components of the corresponding score vectors.
Proceed similarly for all the remaining characteristics.
Proceed similarly for the remaining sub-indicators.
Proceed similarly for the remaining indicators.


