


Background and rational for the study. Chronic HCV is a major cause of HCC development. Caspase Recruitment Domains (CARD) is protein modules that regulate apoptosis and play an important role in various carcinogenesis processes, our aim is to assess the possible role of CARD9, CARD10 and Caspase only protein (COP) in progression of liver fibrosis and pathogenesis of HCC in Egyptian chronic HCV patients.
Material and methods. 130 patients were recruited and classified into 4 groups; I: chronic HCV, II: chronic active hepatitis, III: liver cirrhosis, IV: HCV related HCC. Biochemical, virological studies, abdominal ultrasonography and liver biopsy were performed. Quantitative estimation of mRNA of CARD9, CARD10 and COP gene expression was performed by RT- PCR in liver biopsy from all patients.
Results. In HCC patients; age, AFP and liver profile were significantly higher, HB and platelets were significantly lower (p value <0.01). The expression levels of mRNA of CARD9, CARD10 and COP in liver biopsies of HCC were significantly higher than other groups with direct correlation with age and no correlation with AFP, viral load, liver fibrosis or necroinflammatory activity. On differentiation between HCC and non HCC patients each CARD was assessed separately and combined, on combing the 3 CARDs, the sensitivity was 100%, specificity was 48%, positive predictive value 47% and negative predictive value 100%.
Conclusions. CARD9, CARD10 and COP had no role in liver fibrosis but may be involved in hepatic carcinogenesis and they could be used as markers for HCC diagnosis and candid genes for molecular target therapy.
Hepatitis C virus (HCV) is the main cause of a significant proportion of chronic liver disease and hepatocellular carcinoma (HCC) all over the world.1 Since the rate of HCC development among HCV-in-fected persons ranges from 1% and 3% after 30 years of viral infections,2 HCC is considered a major health problem in Egypt, which has the highest prevalence of hepatitis C virus (HCV) in the world, ranging from 6 to 28% with an average of approximately 13.8% in the general population.3
Protein modules have recently been identified as molecules that play an important role in the assembly of signaling proteins into specific signal transduction pathways.4 The caspase recruitment domains (CARD) constitute a group of these modules, which is involved in various carcinogenesis pro-cesses.5–7 To date, more than 20 human CARD-containing proteins have been identified. Some of these proteins have been linked, in recent studies, to the regulation of apoptosis possibly through activation of BCL10 and NF-κB proteins.8
Apoptosis has been shown to play a critical role in adult tissue homeostasis. Several studies demonstrated that the failure of cells to undergo apoptotic cell death is a crucial factor in the pathogenesis of cancer in several hematological and solid tumors.9 Consistent with this fact, aberrations in apoptosis regulatory genes e.g. NF-κB, BCL10 and BCL2 family members were associated, in several recent studies, with the development and progression of solid tumors, including HCC.7,8,10
Therefore, the current study was conducted to clarify the contribution of some CARD-containing proteins (CARD9, CARD10 and Caspase only protein [COP]) to the development of HCC in chronic HCV-infected patients from Egypt and their relation to fibrosis.
Material and MethodsPatientsThe study included 130 patients with chronic HCV genotype 4 (HCVG4)-associated liver disease and HCC. The studied patients ranged in age from 18–60 years and all were positive for anti-HCV antibodies and HCV RNA in serum. Patients with any cause of liver disease other than HCV, other malignancies, a family history of malignancy and those with any contraindication to liver biopsy were excluded from the study. A written informed consent was obtained from all patients prior to enrollment in the study and the Institutional Review Boards (IRB) of the NCI and Kasr Al-Aini School of Medicine approved the study protocol, which was in accordance with the 2007 Declaration of Helsinki.
Patients were classified into four groups. Group I [chronic, asymptomatic carriers group (AC)], which included 30 patients with chronic HCVG4 and persistent normal liver profile. Absence of any hepatic abnormality in this group was confirmed either by abdominal ultrasonography and F0 or F1 fibrosis by the liver biopsy according to Ishak score.11 Group II [chronic active hepatitis (CAH) non-cirrhotic patients], which included 30 patients with elevated liver enzymes and no cirrhosis in liver biopsy. Group III [cirrhotic hepatitis C patients], which included 30 patients with cirrhosis on top of CAH as confirmed by liver biopsy (F5-6/6 by Ishak score) and group IV [HCC patients], which included 40 HCC patients diagnosed according to BCLC guidelines and by histopathological examination of ultrasound-guided liver biopsies taken from the focal lesions.12
All patients were subjected to complete clinical assessment and laboratory investigations including Quantitative Real Time PCR (Stratagene, USA) for HCV, CBC, liver profile, INR, alfa fetoprotein (AFP), ANA and HCV antibody (using Axyam-Abbot). Abdominal ultrasound was done for all patients using a Toshiba machine with a 3.5MHZ convex probe after 8 h fasting, at least.
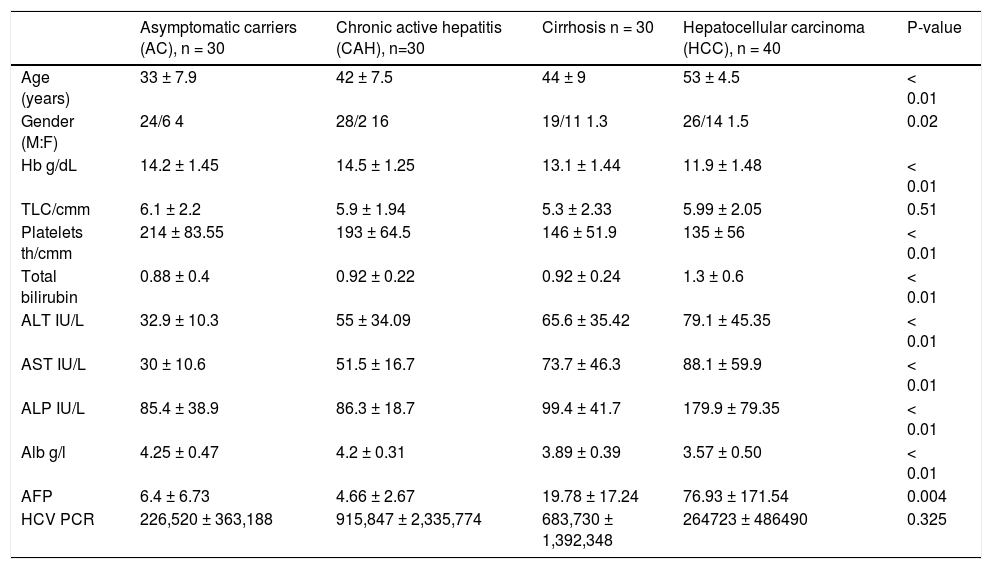
An ultrasound-guided percutaneous liver biopsy was performed using 16 gauge needles whenever possible. Samples of at least 2.5 cm in length, including a minimum of 12 portal tracts were considered reliable and were divided into two parts. The first part was used for preparation of hematoxylin and eosin-stained slides for confirmation of diagnosis, staging of chronic hepatitis and exclusion of other causes. Ishak classification was used for assessment of ne-cro-inflammation and the stage of fibrosis in HCV cases. HCC cases were graded following the WHO criteria13 and staged according to the Salomao, et al.14 The clinic-pathologic features of the studied cases are illustrated in table 1.
Clinical and histopathological features of the studied groups.
| Asymptomatic carriers (AC), n = 30 | Chronic active hepatitis (CAH), n=30 | Cirrhosis n = 30 | Hepatocellular carcinoma (HCC), n = 40 | P-value | |
|---|---|---|---|---|---|
| Age (years) | 33 ± 7.9 | 42 ± 7.5 | 44 ± 9 | 53 ± 4.5 | < 0.01 |
| Gender (M:F) | 24/6 4 | 28/2 16 | 19/11 1.3 | 26/14 1.5 | 0.02 |
| Hb g/dL | 14.2 ± 1.45 | 14.5 ± 1.25 | 13.1 ± 1.44 | 11.9 ± 1.48 | < 0.01 |
| TLC/cmm | 6.1 ± 2.2 | 5.9 ± 1.94 | 5.3 ± 2.33 | 5.99 ± 2.05 | 0.51 |
| Platelets th/cmm | 214 ± 83.55 | 193 ± 64.5 | 146 ± 51.9 | 135 ± 56 | < 0.01 |
| Total bilirubin | 0.88 ± 0.4 | 0.92 ± 0.22 | 0.92 ± 0.24 | 1.3 ± 0.6 | < 0.01 |
| ALT IU/L | 32.9 ± 10.3 | 55 ± 34.09 | 65.6 ± 35.42 | 79.1 ± 45.35 | < 0.01 |
| AST IU/L | 30 ± 10.6 | 51.5 ± 16.7 | 73.7 ± 46.3 | 88.1 ± 59.9 | < 0.01 |
| ALP IU/L | 85.4 ± 38.9 | 86.3 ± 18.7 | 99.4 ± 41.7 | 179.9 ± 79.35 | < 0.01 |
| Alb g/l | 4.25 ± 0.47 | 4.2 ± 0.31 | 3.89 ± 0.39 | 3.57 ± 0.50 | < 0.01 |
| AFP | 6.4 ± 6.73 | 4.66 ± 2.67 | 19.78 ± 17.24 | 76.93 ± 171.54 | 0.004 |
| HCV PCR | 226,520 ± 363,188 | 915,847 ± 2,335,774 | 683,730 ± 1,392,348 | 264723 ± 486490 | 0.325 |
All data are expressed as (mean ± SD).
- •
RNA extraction and cDNA synthesis. Total RNA was extracted from tissue biopsies (HCC, CH and normal hepatic tissues [NHT]) using SV total RNA isolation kit (Promega, Biotech) according to manufacturer’s protocol. The NHT samples were used to optimize the best conditions for the multiplex PCR of B-actin gene (621-bp fragments) vs. each of the studied genes. Reverse transcription (RT) of the isolated total RNA was performed in 25 µL reaction volume containing 200u of Superscript II RT enzyme (Gibco-BRL, Gaithersburg, MD, USA), 1X RT-buffer (250 mM Tris-HCl pH 8.3, 375 mM KCl, 15 mM MgCl2), 1 mM dithiotheritol, 25 ng random primer, 0.6 mM deoxynucleotide triphosphates, 20 U RNAsin (Promega, USA.) and 100 ng of the extracted RNA. Samples were then incubated at 50°C for 60min followed by 4°C.15
- •
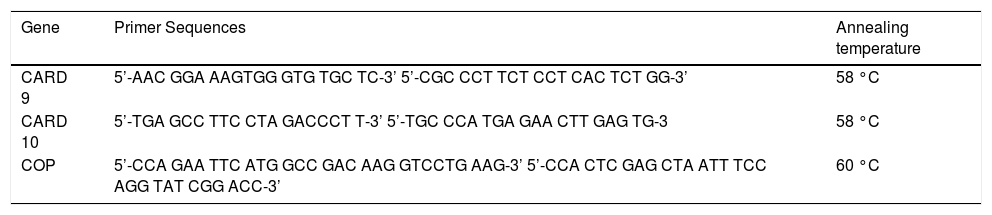
PCR amplification. The sequence of the primers and the PCR conditions of the studied genes are illustrated in table 2. PCR and quantitation were performed in a 50 µL reaction volume containing 5 µL of the RT reaction mixture (c-DNA), 2.5u Taq polymerase (Gibco-BRL, Gaithersburg, MD, USA), 1X PCR buffer (500 mM KCl, 200 mM Tris-HCl, 1.5 mM MgCl2, 1 mg/mL bovine serum albumin (BSA), 200 mM each of the deoxyribonucleotide triphosphate and 0.25mM of each primer. The cycling conditions were as previously described.15
Table 2.Primer sequences of the studied genes.
Gene Primer Sequences Annealing temperature CARD 9 5’-AAC GGA AAGTGG GTG TGC TC-3’ 5’-CGC CCT TCT CCT CAC TCT GG-3’ 58 °C CARD 10 5’-TGA GCC TTC CTA GACCCT T-3’ 5’-TGC CCA TGA GAA CTT GAG TG-3 58 °C COP 5’-CCA GAA TTC ATG GCC GAC AAG GTCCTG AAG-3’ 5’-CCA CTC GAG CTA ATT TCC AGG TAT CGG ACC-3’ 60 °C
Fifteen microliters of each PCR product were separated by electrophoresis through 2% ethidium bromide-stained agarose gel and visualized with ultraviolet light. Gels were photographed and the bands were scanned as digital peaks. Areas of the peaks were calculated in arbitrary units with a digital imaging system (Photodocumentation system, Model IS-1000; Alpha Innotech Co., San Leandro, CA, USA). The expression value of the normal pooled liver tissues (NPLT) was used as a normalizing factor to evaluate the relative expression levels of the target genes in the RT-PCR, and a relative value was calculated for each gene. Samples were assayed in batches that included both cases and controls and no expression in any of the studied genes was considered if there was a complete absence, or more than a 75% decrease in the intensity of the desired band in comparison to the band of the NPLTA. Absence of bands was confirmed by repeating the RT-PCR twice at different days and by consistent presence of β-actin gene amplification.15
Statistical methodsAll patients’ data were tabulated, processed using Statistical Package for the Social Sciences (SPSS) for windows XP professional. Quantitative variables were expressed as mean± SD, compared using student t test for two groups, or ANOVA (analysis of variance) test for more than two groups. Pearson correlation was done to correlate tumor markers with other continuous parameters. ROC (receiver operator characteristic curve) was constructed to assess the reliability of tumor markers in diagnosis, to assess AUC (area under the curve) and to determine the best cutoff level for best sensitivity and specificity. Qualitative variables were expressed by frequency and percentage, compared by Chi-square test or Fischer’s exact test. p value was considered significant if < 0.05 and highly significant if < 0.01.
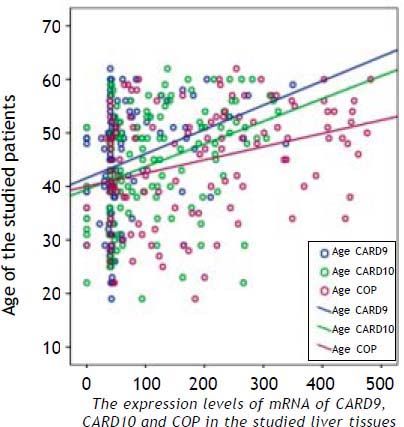
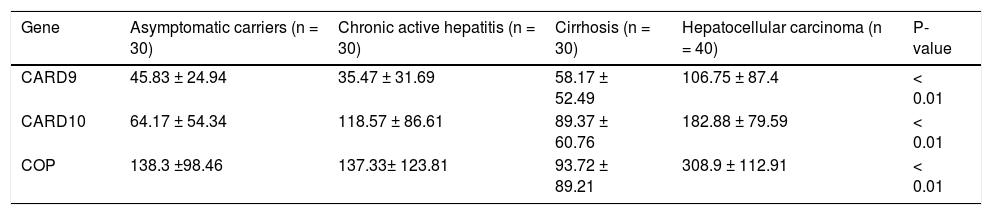
ResultsThe RNA expression level of the studied markers (CARD9, CARD10 and COP) differed between the four groups as illustrated in figure 1 and table 3. The expression levels of the three CRDs assessed were significantly higher in HCC patients compared to all other groups (Table 3). In HCC group, COP showed the highest expression level (308.9 ± 112.91), followed by CARD10 (182.88 ± 79.59) then CARD9 (106.75 ± 87.4) and this was also applicable to all other groups.

The expression levels of CARD9, CARD10 and COP in different studied groups.
| Gene | Asymptomatic carriers (n = 30) | Chronic active hepatitis (n = 30) | Cirrhosis (n = 30) | Hepatocellular carcinoma (n = 40) | P-value |
|---|---|---|---|---|---|
| CARD9 | 45.83 ± 24.94 | 35.47 ± 31.69 | 58.17 ± 52.49 | 106.75 ± 87.4 | < 0.01 |
| CARD10 | 64.17 ± 54.34 | 118.57 ± 86.61 | 89.37 ± 60.76 | 182.88 ± 79.59 | < 0.01 |
| COP | 138.3 ±98.46 | 137.33± 123.81 | 93.72 ± 89.21 | 308.9 ± 112.91 | < 0.01 |
There was a statistically significant difference between group I (AC) and group IV (HCC) regarding the age of the patients (p < 0.01) as well as between group II (CAH) and all other groups regarding the gender (p < 0.02). Hemoglobin and platelets counts were significantly lower in cirrhotic and HCC patients (group III and IV, respectively) than in group I and II (p < 0.01), while liver biochemical parameters, alpha fetoprotein and HCV viral load were differed significantly between HCC patients (group IV) and all other groups (Table 1).
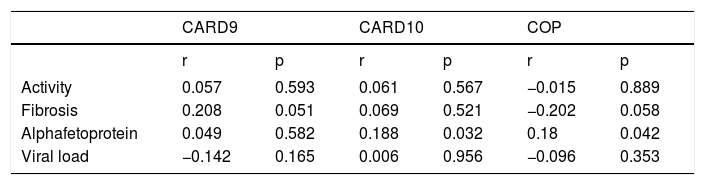
Significant correlations were also reported between high AFP, CARD10 (p = 0.032) and COP (p = 0.042), as well as between the presence of fibrosis and CARD9 (p = 0.051) with a borderline significance between the presence of fibrosis and COP expression (p = 0.058) (Table 4).
The correlation coefficient between the expression of the studied markers and the histopathological changes, alpha-fetoprotein and viral load in the studied cases.
| CARD9 | CARD10 | COP | ||||
|---|---|---|---|---|---|---|
| r | p | r | p | r | p | |
| Activity | 0.057 | 0.593 | 0.061 | 0.567 | −0.015 | 0.889 |
| Fibrosis | 0.208 | 0.051 | 0.069 | 0.521 | −0.202 | 0.058 |
| Alphafetoprotein | 0.049 | 0.582 | 0.188 | 0.032 | 0.18 | 0.042 |
| Viral load | −0.142 | 0.165 | 0.006 | 0.956 | −0.096 | 0.353 |
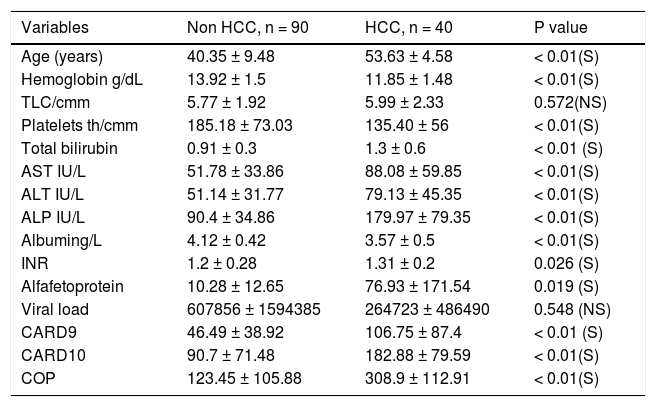
Upon classifying patients into 2 groups only (HCC vs. non HCC), by compiling all non HCC cases together, the significant differences between groups were maintained. Thus, there was a statistically significant difference between HCC and non-HCC cases in all clinical and laboratory data of the patients except for the viral load and TLC count. Similarly, the expression level of CARD9, CARD10 and COP differed significantly between HCC and non HCC patients (Table 5).
The correlation between CARD’s expression and clinical features of HCC and non HCC studied patients.
| Variables | Non HCC, n = 90 | HCC, n = 40 | P value |
|---|---|---|---|
| Age (years) | 40.35 ± 9.48 | 53.63 ± 4.58 | < 0.01(S) |
| Hemoglobin g/dL | 13.92 ± 1.5 | 11.85 ± 1.48 | < 0.01(S) |
| TLC/cmm | 5.77 ± 1.92 | 5.99 ± 2.33 | 0.572(NS) |
| Platelets th/cmm | 185.18 ± 73.03 | 135.40 ± 56 | < 0.01(S) |
| Total bilirubin | 0.91 ± 0.3 | 1.3 ± 0.6 | < 0.01 (S) |
| AST IU/L | 51.78 ± 33.86 | 88.08 ± 59.85 | < 0.01(S) |
| ALT IU/L | 51.14 ± 31.77 | 79.13 ± 45.35 | < 0.01(S) |
| ALP IU/L | 90.4 ± 34.86 | 179.97 ± 79.35 | < 0.01(S) |
| Albuming/L | 4.12 ± 0.42 | 3.57 ± 0.5 | < 0.01(S) |
| INR | 1.2 ± 0.28 | 1.31 ± 0.2 | 0.026 (S) |
| Alfafetoprotein | 10.28 ± 12.65 | 76.93 ± 171.54 | 0.019 (S) |
| Viral load | 607856 ± 1594385 | 264723 ± 486490 | 0.548 (NS) |
| CARD9 | 46.49 ± 38.92 | 106.75 ± 87.4 | < 0.01 (S) |
| CARD10 | 90.7 ± 71.48 | 182.88 ± 79.59 | < 0.01(S) |
| COP | 123.45 ± 105.88 | 308.9 ± 112.91 | < 0.01(S) |
P value: < 0.05 = significant. All data are expressed as mean ± SD.
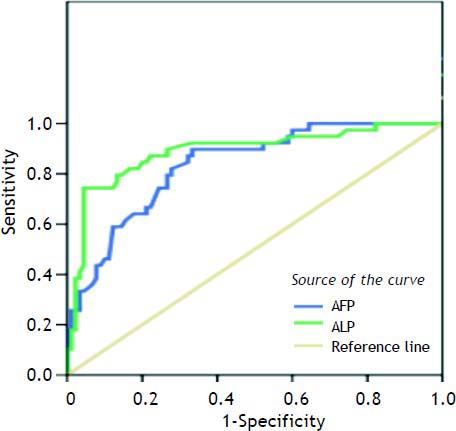
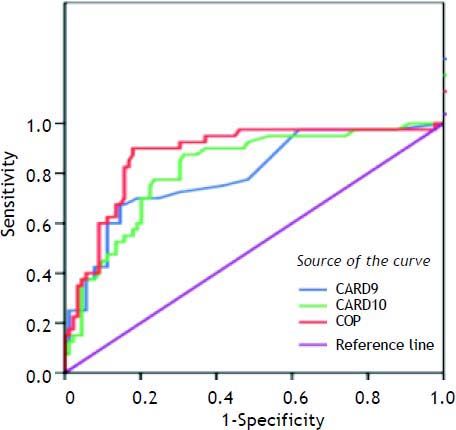
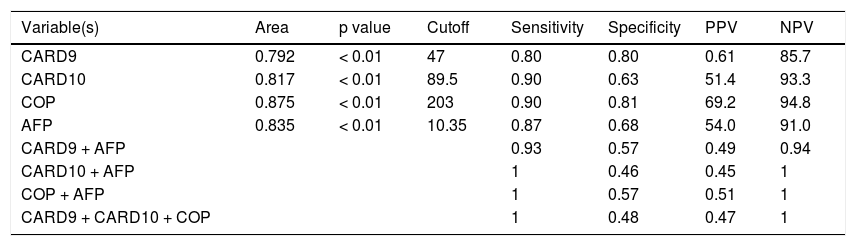
Table 6 shows the best cutoff, for each marker and AFP, which can successfully differentiate between HCC and other non HCC lesions. The best cutoff for CARD9 was 47 with 80% sensitivity, 80% specificity, 61% positive predictive value (PPV) and 85.7% negative predictive value (NPV). For CARD10, the best cutoff was 89.5% with 90% sensitivity, 63% specificity, 51.4% PPV and 93.3% NPV. For COP, the best cutoff was 203 with 90% sensitivity, 81% specificity, 69.2% PPV and 94.8% NPV whereas; the best cutoff for AFP was 10.35 with 87% sensitivity, 68% specificity, 54% PPV and 91% NPV.
CARD9, CARD10, COP and AFP as predictors of HCC.
| Variable(s) | Area | p value | Cutoff | Sensitivity | Specificity | PPV | NPV |
|---|---|---|---|---|---|---|---|
| CARD9 | 0.792 | < 0.01 | 47 | 0.80 | 0.80 | 0.61 | 85.7 |
| CARD10 | 0.817 | < 0.01 | 89.5 | 0.90 | 0.63 | 51.4 | 93.3 |
| COP | 0.875 | < 0.01 | 203 | 0.90 | 0.81 | 69.2 | 94.8 |
| AFP | 0.835 | < 0.01 | 10.35 | 0.87 | 0.68 | 54.0 | 91.0 |
| CARD9 + AFP | 0.93 | 0.57 | 0.49 | 0.94 | |||
| CARD10 + AFP | 1 | 0.46 | 0.45 | 1 | |||
| COP + AFP | 1 | 0.57 | 0.51 | 1 | |||
| CARD9 + CARD10 + COP | 1 | 0.48 | 0.47 | 1 |
PPV: positive predictive value. NPV: negative predictive value.
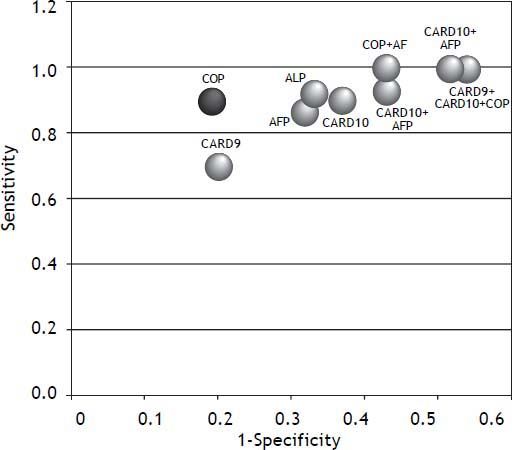
A combination of CRD9, CARD10 and COP showed 100% sensitivity and 48% specificity with 47% PPV and 100% NPV (Figure 2, Table 6). The combination of AFP with each of the studied markers (CARD9 then CARD 10 then COP) showed (93%, 100%, 100% sensitivity), (57%, 46%, 57% specificity), PPVs (49%, 45%, 51%) and NPVs (94%, 100%, 100%); respectively (Figures 3 and 4).


To the best of our knowledge, the current study is the first to address the role of the CADs (CARD9, CARD10 and COP) in HCV-associated HCC and CH. Our results show that all studied CARDs were significantly higher in HCC patients than in the other studied groups (ASC, CH and cirrhosis), and thus they could be used as surrogate markers for HCV-associated HCC. COP showed the highest expression level (308.9 ± 112.91) in all studied groups, followed by CARD10 (182.88 ± 79.59) and then CARD9 (106.75 ± 87.4).
Although the role of CADs has not been addressed in HCV-associated hepato-carcinogenesis yet, a previous study of 65 patients with primary gastric B-cell lymphoma and 18 patients with chronic gastritis demonstrated that CARD9 overexpression was associated with the development and/or progression of gastric B-cell lymphoma, especially among in patients negative for H. pylori (16:28).16
Another study by Soung and Lee17 assessed the entire coding region of caspase-9 for mutations in normal and tumor DNAs, which were isolated from randomly selected 180 gastric, 104 colorectal, 69 lung adenocarcinoma cases and normal tissue samples. Silent mutations were detected in the tumor DNA obtained from two out of 104 colorectal and one out of 180 gastric carcinoma cases only but in none of the lung carcinoma cases. This indicates that caspase-9 gene is rarely mutated in these tumor types and thus, it doesn’t contribute to their development. On the contrary, another case-control study investigated the frequency of caspase-9 promoter polymorphism in a cohort of lung cancer patients matched for age and sex with healthy con-trols.18 The lung cancer cases included 210 squa-mous cell carcinomas, 141 adenocarcinomas, 73 small cell carcinomas, and eight large cell carcinomas. The results of this study showed that caspa-se-9 promoter polymorphisms affected caspase-9 expression and enhanced genetic susceptibility to lung cancer. However, when caspase-9 polymorphism was investigated in 183 multiple myeloma patients and 691 healthy controls, a protective association for caspase-9 polymorphism was repor-ted.19 This discrepancy in the results of different studies could be attributed to the difference in the genetic abnormality assessed, the detection method(s) used, the tumor type or the difference in the population under study, especially in case of polymorphism which usually differs between populations.20
Our data regarding the high expression of CARD10 RNA in human HCC samples is the first to be published in this area since the only available study in this context used a series of caspase-10-spe-cific antibodies to evaluate the expression level of CARD10 mRNA in 55 lung and breast carcinoma cell lines. In this study caspase-10-mRNA was expressed in the majority of these cell lines the results suggesting a possible selective pressure against caspase-10 production in cancer cells, though the results of different studies are still controversial.21
Our results regarding the high RNA expression of COP in HCC compared to other non-HCC studied samples can’t be verified by other studies since there is no data in the literature yet regarding the role of COP in any tumor type and the few available reports concentrate on the theoretical role of COP in inflammatory responses only.22 However this reported role of COP in inflammation provides a possible explain for the significant correlation demonstrated in the current study between COP and the presence of fibrosis. On the other hand, our data regarding the association between COP and CARD10 RNA expression and a high AFP support the contribution of these CADs to the development of HCC in chronic HCV-infected patients.
Upon classifying our patients into two main groups (HCC and the non-HCC) the significant differences in CADs expression were maintained between these two groups providing more evidence to the role of these proteins in the HCV-associated hepatocarcinogenesis. One possible mechanism to be discussed in this context could be the receptor-mediated activation of BCL10 and NF-kB by CARDs.7,8 Then we attempted to determine the best cutoff for each of the three studied CADs and AFP, which can help to differentiate between HCC and other HCV-associated disease stages. We found that, COP has the highest sensitivity and specificity followed by CARD9, AFP and CARD10, and thus we assume that COP could be used as a marker of HCC development in chronic HCV-infected patients.
We also assessed whether a combination of CADs and AFP might increase the probability to differentiate between HCC and non-HCC cases and accordingly, different combinations of CADs and other combinations between AFP and each of the three CADs were tested. We found that, although the sensitivity of the test increases upon using a panel of markers rather than a single one, the specificity is significantly reduced. Thus, we assume that a single marker approach is better than the multiple markers approach in differentiating HCC from non-HCC cases.
Our data regarding the higher age of patients in HCC (53 ± 4.5) compared to other non HCC groups and the higher incidence in males are concordant with most published data, which include age and sex among the risk factors for HCC in chronic hepatitis patients. In a cohort study including 1201 HCV linked HCC Australian patients, the mean age was 54.8 ± 8 years23 and in a second study from Egypt including 150 HCC patients and 150 age and sex matched controls, the mean age in the HCC group was 56.2 ± 10.6.24 Similarly, the male predominance (65%) reported in our HCC patients is in conformity with several epidemiological studies in literature.25,26
Our data regarding the significantly low platelets count and high AST level in HCC and cirrhotic patients compared to other chronic hepatitis C patients is also consistent with previous reports in the literature, which considered AST and platelets count accurate predictors of advancing liver fibrosis. Thus they are used in many of the non-invasive sero-logy dependent formulations for assessment of fibro-sis and they could also be used in an equation (APRI index) to predict cirrhosis in HCV-infected patients.26
Our results regarding the high mean serum alkaline phosphatase and AFP levels in HCC compared to other groups are consistent with those of Yu, et al.27 and Chen, et al.28 among others. Both alkaline phosphatase and AFP are widely used now as tumor markers for screening and estimating disease progression in HCC patients and the development of fibrosis in chronic HCV patients. Moreover, preoperative alkaline phosphatase levels could be utilized to monitor and predict recurrence in high risk HCC patients following hepatectomy.27
We conclude that the CADs, CARD9, CARD10 and COP play an important role in HCV-associated hepatocarcinogenesis, however only CARD9 is associated with the development fibrosis in those. Together with AFP, they could be used as surrogate markers for prediction of HCC in chronic HCV-in-fected patients with or without cirrhosis either singly or in combination. The use of a single marker proved to be more sensitive and specific than the use of multiple markers, however further studies are still needed to confirm these data which represents the first report in this context.


