


Describe the occupational and academic characteristics of medical graduates from three Peruvian universities.
MethodsA cross-sectional study was conducted on medical graduates from the National Universities of Piura, Amazonía Peruana, and San Antonio Abad del Cusco. An online questionnaire was used to gather information related to the occupational and academic characteristics, as well as current job satisfaction. Stratified random sampling was used, with the participants being selected from each university.
ResultsA total of 150 medical graduates with a median age of 32 [IQR=26–41] completed the questionnaire. All of the participants had at least one post-graduate study, and 70% had some specialty. Almost all (96.7%) of the graduates got their first job in less than a year, and 62% got it through personal contacts, and 10% have been or are currently working abroad. The current median number of jobs was 2 [IQR=1–6], and the current salary ranged mainly from $1000 to $3000. The overall job satisfaction score (median) was 84 (IQR=58–95).
ConclusionThe majority of graduates surveyed currently live in Peru and all of them had at least one postgraduate study. Current salaries ranged from $ 1000 to $3000 and work was predominantly health-care related. Participants also reported feeling generally satisfied about their current job status.
Describir las características laborales y académicas del médico egresado de 3 universidades peruanas.
MétodosSe realizó un estudio descriptivo transversal en médicos egresados de la Universidad Nacional de Piura, la Universidad Nacional de la Amazonía Peruana y la Universidad Nacional San Antonio Abad del Cusco. Se aplicó una encuesta virtual para recolectar información relacionada con las características laborales y académicas, así como con la satisfacción laboral actual. Se usó un muestreo aleatorio estratificado, seleccionando a los participantes de cada universidad.
ResultadosSe encuestó un total de 150 médicos, la mediana de edad fue 32 (RIQ=26-41). El 100% de los participantes había realizado al menos un estudio de grado académico y el 70% alguna especialidad. El 96,7% de los egresados consiguió su primer empleo en un tiempo menor a un año, el 62% lo hizo a través de contactos personales y el 10% ha ejercido o ejerce actualmente en el extranjero. La mediana de empleos actuales fue de 2 (RIQ=1-6) y el sueldo actual oscilaba principalmente entre 1.000 a 3.000 dólares. La mediana de la puntuación total de satisfacción laboral fue 84 (RIQ=58-95).
ConclusiónLa mayor parte de egresados encuestados vive actualmente en el Perú, y todos tenían al menos un estudio de posgrado. El sueldo actual osciló principalmente entre 1.000 a 3.000 dólares, y la labor fue predominantemente asistencial. Además, los participantes reportaron sentirse en general satisfechos respecto a su situación laboral actual.
Human resources are a fundamental part of health services1 and currently represents a national and global research priority.2,3
In Peru, the number of medical graduates has been increasing in recent years. Consequently, there has been an oversupply of physicians in the country,4 related to the proliferation of medical schools in Latin America.5,6 In addition, there are important problems in the quality of training at the universities, which has a negative impact on the professional quality of graduates.7
A study by Carrasco-Cortéz et al. (2008) reported that in 2003 there were an average of 2183 physicians recently graduated, meaning a serious concern about the oversupply of professionals with non-homogeneous training profiles. The institutional analysis that address the aspects in the formation of human resources in health confirm that there is a deregulated supply of medical professionals, disconnected from the objectives and public health needs of the country.4
One of the main difficulties is that within the criteria for university accreditation, only evaluation is included in the institution but not the graduated.4,7 Within the quality criteria of a university, the evaluation of the “product” should also be included, since a solid academic, scientific and humanistic education in the undergraduate has a positive effect on the professional stage.8–10 This includes the approach to medical graduates’ job satisfaction, since it is an important predictor of the efficiency and quality of health systems.11
As mentioned above, employment status and career analysis of graduates should be a fundamental part of the process of self-evaluation and continuous improvement of universities. In Latin America, graduate studies have been carried out in Colombia,12–14 Peru15,16 and Chile.17 However, due to the variability in the approach to the employment status and job satisfaction, the reality still remains scarcely studied.
Therefore, the objective of the present study was to describe the job and academic characteristics of medical graduates from three Peruvian universities.
MethodsStudy designA cross-sectional study was carried out during the months of June to December 2016.
Participants and sampleThe population was constituted by physicians graduated from Universidad Nacional de Piura (UNP), Universidad Nacional San Antonio Abad del Cusco (UNSAAC) and Universidad Nacional de la Amazonía Peruana (UNAP), during the years 2006–2011 (n=634). The criterion for the selection of the three universities was that each one is located in a different geographic area (coast, mountain area and jungle). The years were considered because by now they would have five to ten years of graduate, significant time to develop in the different fields of their career (academic, scientific, professional and economic). In addition, it is a considerable time for the physician to evaluate whether he has achieved his goals or is well on his way to achieving it.
The sample size was determined using the statistical calculator Epidat v3.1, considering a confidence level of 95%, precision of 5% and managing an expected proportion of 78.8%,15 obtaining a sample of 183 graduates. Subsequently, stratified random sampling was performed according to the general list, resulting in 71 graduates from the UNP, 45 from UNAP and 67 from UNSAAC.
We included the graduates who started their career from the first semester and finished at one of the three universities. Incorrectly or partial filled virtual surveys were discarded.
Procedures and variablesThe information was collected by JML, AJJ, JSRR and PNS. CJTH carried out the training of the rest of the researchers in virtual and face-to-face sessions. In addition he was in charge of the supervision of data collection.
To contact the participants we used the snowball method. Initially, we asked the scientific societies of medical students (SOCEM) of each University to give us the member list of each year and their contact information, including electronic addresses and phone numbers. The participant selected for the study was given a virtual survey and asked to provide contact information of their close promotion partners.
We sent an email with a link to a virtual survey to each participant. In cases where a first response was not obtained, we sent a second mail in 10 days and if the contact was not yet reached, we sent a third mail 10 days later. If no response was obtained after this, we made a phone call (when this contact information was available) to confirm the participant's emails. We conducted a phone survey with those who agreed to participate in the study. However, if contact was not yet achieved, it was considered that the participant could not be located and was not included in the study. In cases of lack of contact or rejection, we surveyed the participant who was immediately afterwards in the list, performing the same procedure previously mentioned.
To collect the information we use a virtual survey. To evaluate the job characteristics, we used a survey previously validated by Guevara et al. (2016) with a Cronbach's alpha of 0.895.16 To evaluate job satisfaction, we used the Overall Job Satisfaction by Warr et al. (1979),18 in its Spanish version validated by Pérez and Fidalgo (1995), with a Cronbach alpha of 0.88.19 This instrument has two sub-scales that make a total of 15 items and evaluate job intrinsic and extrinsic factors. The first ones are related to the job psychological attributions (nature, responsibility, skill and recognition). The second ones are related to its organization and architecture (time, remuneration and working conditions). Each item is scored from 1 (very unsatisfied) to 7 (very satisfied). The total score ranges from 15 to 105. A higher score reflects a higher overall satisfaction.19,20
Finally, we added questions related to sociodemographic data and academic background.
Statistical analysisTwo different people entered the data in Microsoft Excel. Both data were put together and then reviewed for quality control, refining poorly completed surveys and erroneous data transcription. Data from telephone surveys were entered into a spreadsheet with the same structure and method. The analysis was performed using the statistical package STATA v13.0. A descriptive analysis was performed using frequencies and central tendency measures with confidence intervals at a 95% level. For the use of parametric or non-parametric tests, the presence or absence of normality was verified with the Shapiro–Wilk test, respectively. We considered a p-value<0.01 as statistically significant.
Ethical aspectsThe study was approved by the Institutional Review Board of the Hospital Nacional Almanzor Aguinaga. All persons included volunteered to participate in the study. An information sheet was used prior to filling out the virtual survey. The confidentiality was guaranteed through the use of individual codes for the procedure of data collection and analysis.
ResultsGeneral characteristics of the populationWe surveyed a total of 150 physicians graduated from 2006 to 2011, 71 from the Universidad Nacional de Piura (UNP), 30 from the Universidad Nacional de la Amazonía Peruana (UNAP) and 49 from the Universidad Nacional San Antonio Abad del Cusco (UNSAAC). It was not possible to obtain the desired sample by proportional affixation for the last two universities, due to the lack of contact information of more than 50% of the graduates.
The median age of the 150 participants was 32 [IQR=26–41] and significant differences were found between universities regarding marital status (p<0.01), place of birth (p<0.01) and year of graduation (p<0.01). Table 1 shows the sociodemographic characteristics according to university of origin.
Sociodemographic characteristics of the medical graduates according to university of origin.
| Variable | University | p | ||
|---|---|---|---|---|
| UNP | UNAP | UNSAAC | ||
| n (%) | n (%) | n (%) | ||
| Agea | 32 [26–39] | 32 [29–38] | 31 [27–41] | >0.05b |
| Sex | >0.05c | |||
| Male | 50 (70.4) | 18 (60.0) | 30 (61.2) | |
| Female | 21 (29.6) | 12 (40.0) | 19 (38.8) | |
| Marital status | <0.01d | |||
| Single | 43 (60.6) | 25 (83.3) | 20 (40.8) | |
| Married | 27 (38.0) | 5 (16.7) | 29 (59.2) | |
| Divorced | 1 (1.4) | 0 (0) | 0 (0) | |
| Birth place | <0.01d | |||
| Lima (Capital) | 4 (5.6) | 8 (26.7) | 2 (4.1) | |
| Province | 67 (94.4) | 22 (73.3) | 47 (95.9) | |
| Current living place | >0.05d | |||
| Peru | 64 (90.1) | 28 (93.3) | 44 (89.8) | |
| Other country | 7 (9.9) | 2 (6.7) | 5 (10.2) | |
| Year of graduation | <0.01d | |||
| 2006 | 14 (19.7) | 2 (6.7) | 1 (2.0) | |
| 2007 | 11 (15.5) | 1 (3.3) | 2 (4.1) | |
| 2008 | 9 (12.7) | 3 (10.0) | 2 (4.1) | |
| 2009 | 6 (8.5) | 5 (16.7) | 12 (24.5) | |
| 2010 | 15 (21.1) | 7 (23.3) | 15 (30.6) | |
| 2011 | 16 (22.5) | 12 (40.0) | 17 (34.7) | |
Vocation was the main reason to study medicine. UNSAAC graduates performed more frequently primary health care activities during their undergraduate program (p<0.05) and almost half of the UNAP graduates were satisfied with their undergraduate curriculum (p<0.05), although more than 50% of graduates in general felt dissatisfied. We also found that all the graduates had at least one academic degree (diplomate, master's degree, doctorate or fellowship) and at least 70% was a specialist. In addition, 46.7% of the UNAP graduates currently belong to a scientific or academic society (p<0.01) and 35.2% of the UNP graduates had a master's degree (p<0.05) (Table 2).
Pre and postgraduate academic background of medical graduates according to university of origin.
| Variable | University | p | ||
|---|---|---|---|---|
| UNP | UNAP | UNSAAC | ||
| n (%) | n (%) | n (%) | ||
| Undregraduate level | ||||
| Main reason to study medicine | >0.05a | |||
| Vocation | 56 (78.9) | 21 (70.0) | 39 (79.6) | |
| Job expectations | 15 (21.1) | 9 (30.0) | 9 (18.4) | |
| Economic expectations | 0 (0) | 0 (0) | 1 (2.0) | |
| Third rank | >0.05b | |||
| Upper third | 40 (56.3) | 16 (53.3) | 23 (46.9) | |
| Middle third | 19 (26.8) | 9 (30.0) | 20 (40.8) | |
| Bottom third | 12 (16.9) | 5 (16.7) | 6 (12.2) | |
| PHC activities | <0.05b | |||
| Yes | 54 (76.1) | 20 (66.7) | 44 (89.8) | |
| No | 17 (23.9) | 10 (33.3) | 5 (10.2) | |
| Satisfaction with curriculum | <0.05b | |||
| Satisfied | 20 (28.2) | 14 (46.7) | 10 (20.4) | |
| Unsatisfied | 51 (71.8) | 16 (53.3) | 39 (79.6) | |
| Postgraduate level | ||||
| Current scientific-academic society | <0.01b | |||
| Yes | 27 (38.0) | 14 (46.7) | 8 (16.3) | |
| No | 44 (62.0) | 16 (53.3) | 41 (83.7) | |
| Academic degree studies | ||||
| Diplomate | 50 (70.42) | 19 (63.3) | 27 (55.1) | >0.05b |
| Masters | 25 (35.2) | 5 (16.7) | 8 (16.3) | <0.05b |
| Doctorate | 9 (12.7) | 1 (3.3) | 2 (4.1) | >0.05a |
| Fellowship | 6 (8.45) | 3 (10.0) | 3 (6.1) | >0.05a |
| Medical specialty studies | ||||
| Specialty | 50 (70.4) | 23 (76.7) | 32 (65.3) | >0.05b |
| Subspecialty | 16 (22.5) | 3 (10.0) | 5 (10.2) | >0.05b |
| Abroad studies | ||||
| Yes | 21 (29.6) | 8 (26.7) | 8 (16.3) | >0.05b |
| No | 50 (70.42) | 22 (73.3) | 41 (83.7) | |
PHC=primary health care.
There were significant differences between the years of graduation in terms of top third rank (p<0.05), primary health care (PHC) activities in undergraduate (p<0.001), belonging to a scientific-academic society (p<0.001), being a specialist (p<0.01) and have performed some postgraduate study abroad (p<0.01).
Career path, first job and current jobThe 96.7% of the graduates got their first job in less than a year, 62% made it through personal contacts and 10% have been or are currently working abroad. The median of previous jobs was 3 [IQR=0–10], current jobs median was 2 [IQR=1–6] and four graduates had a non-health-related job.
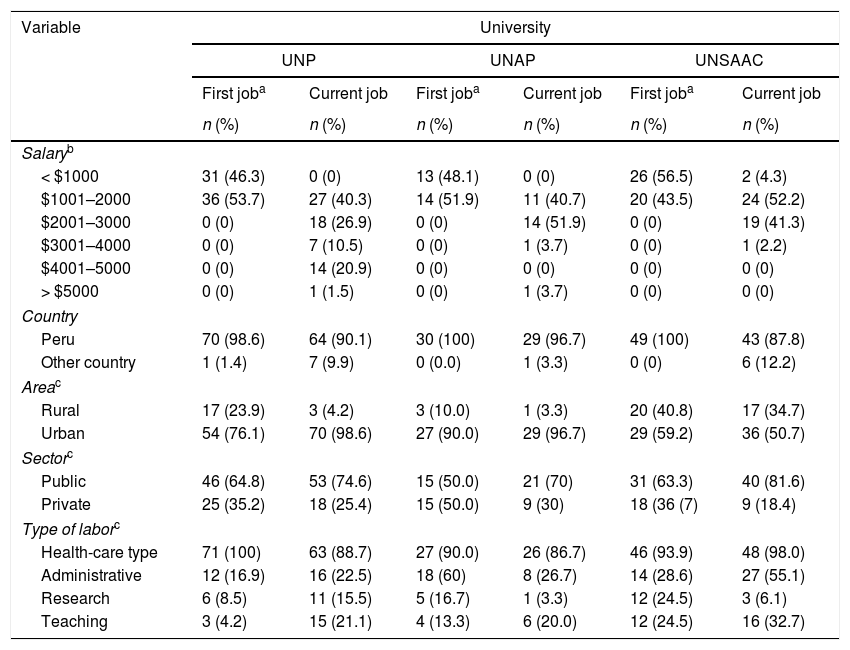
The 80.7% of the graduates had a current salary ranging from 1000 to 3000 dollars and 90.7% were working in Peru. In addition, 90% and 76% was working in the urban area and the public sector, respectively. The job was predominantly health-care type (91.3%). Table 3 shows the rest of the characteristics of the first job and the current job.
Characteristics of the first job and current job of medical graduates according to university of origin.
| Variable | University | |||||
|---|---|---|---|---|---|---|
| UNP | UNAP | UNSAAC | ||||
| First joba | Current job | First joba | Current job | First joba | Current job | |
| n (%) | n (%) | n (%) | n (%) | n (%) | n (%) | |
| Salaryb | ||||||
| < $1000 | 31 (46.3) | 0 (0) | 13 (48.1) | 0 (0) | 26 (56.5) | 2 (4.3) |
| $1001–2000 | 36 (53.7) | 27 (40.3) | 14 (51.9) | 11 (40.7) | 20 (43.5) | 24 (52.2) |
| $2001–3000 | 0 (0) | 18 (26.9) | 0 (0) | 14 (51.9) | 0 (0) | 19 (41.3) |
| $3001–4000 | 0 (0) | 7 (10.5) | 0 (0) | 1 (3.7) | 0 (0) | 1 (2.2) |
| $4001–5000 | 0 (0) | 14 (20.9) | 0 (0) | 0 (0) | 0 (0) | 0 (0) |
| > $5000 | 0 (0) | 1 (1.5) | 0 (0) | 1 (3.7) | 0 (0) | 0 (0) |
| Country | ||||||
| Peru | 70 (98.6) | 64 (90.1) | 30 (100) | 29 (96.7) | 49 (100) | 43 (87.8) |
| Other country | 1 (1.4) | 7 (9.9) | 0 (0.0) | 1 (3.3) | 0 (0) | 6 (12.2) |
| Areac | ||||||
| Rural | 17 (23.9) | 3 (4.2) | 3 (10.0) | 1 (3.3) | 20 (40.8) | 17 (34.7) |
| Urban | 54 (76.1) | 70 (98.6) | 27 (90.0) | 29 (96.7) | 29 (59.2) | 36 (50.7) |
| Sectorc | ||||||
| Public | 46 (64.8) | 53 (74.6) | 15 (50.0) | 21 (70) | 31 (63.3) | 40 (81.6) |
| Private | 25 (35.2) | 18 (25.4) | 15 (50.0) | 9 (30) | 18 (36 (7) | 9 (18.4) |
| Type of laborc | ||||||
| Health-care type | 71 (100) | 63 (88.7) | 27 (90.0) | 26 (86.7) | 46 (93.9) | 48 (98.0) |
| Administrative | 12 (16.9) | 16 (22.5) | 18 (60) | 8 (26.7) | 14 (28.6) | 27 (55.1) |
| Research | 6 (8.5) | 11 (15.5) | 5 (16.7) | 1 (3.3) | 12 (24.5) | 3 (6.1) |
| Teaching | 3 (4.2) | 15 (21.1) | 4 (13.3) | 6 (20.0) | 12 (24.5) | 16 (32.7) |
The mean of the total satisfaction score was 81.93 (SD=8.28) and the median was 84 (IQR=58–95), being significantly higher in the UNP graduates (p<0.001). The level of satisfaction with the opportunity to use their own abilities was the highest (p<0.05), followed by job security (p<0.001). The lowest satisfaction scores were reported in the rate of pay and the way in which the organization is managed (Table 4). In addition, a higher salary was associated with higher job satisfaction (p<0.05).
Descriptive statistics of the 15 items and Overall Job Satisfaction scale, according to university of origin.
| Job satisfaction statement (ESG) | University | |||||
|---|---|---|---|---|---|---|
| UNP | UNAP | UNSAAC | ||||
| Mean (SD) | Median (IQR) | Mean (SD) | Median (IQR) | Mean (SD) | Median (IQR) | |
| Physical working conditions | 5.80 (0.43) | 6 (4–6) | 5.48 (0.77) | 6 (2–7) | 5.41 (0.81) | 6 (2–6) |
| Freedom to choose your own method of working | 5.69 (0.99) | 6 (4–7) | 5.59 (0.61) | 6 (4–7) | 5.47 (0.58) | 6 (4–6) |
| Your colleagues and fellow workers | 5.82 (1.06) | 6 (2–7) | 5.67 (0.67) | 6 (4–7) | 5.59 (0.70) | 6 (4–7) |
| Recognition you get for good work | 5.77 (0.90) | 6 (4–7) | 5.80 (0.59) | 6 (4–7) | 5.86 (0.65) | 6 (4–7) |
| Your immediate boss | 5.90 (0.78) | 6 (4–7) | 5.53 (0.83) | 6 (3–7) | 5.37 (0.86) | 6 (3–6) |
| The amount of responsibility you are given | 5.60 (0.76) | 6 (3–6) | 5.72 (0.62) | 6 (4–7) | 5.76 (0.66) | 6 (4–7) |
| Rate of pay | 5.20 (1.26) | 6 (2–7) | 5.46 (0.90) | 6 (2–6) | 5.57 (0.82) | 6 (2–6) |
| Opportunity to use your abilities | 6.07 (0.68) | 6 (4–7) | 5.66 (0.90) | 6 (2–7) | 5.55 (1.0) | 6 (2–6) |
| Relations between management and workers | 5.93 (0.52) | 6 (4–7) | 5.54 (0.80) | 6 (3–7) | 5.43 (0.87) | 6 (3–6) |
| Your chance of promotion | 5.94 (0.58) | 6 (4–7) | 5.43 (1.07) | 6 (2–7) | 5.39 (1.06) | 6 (2–6) |
| The way the organization is managed | 5.77 (0.45) | 6 (4–6) | 5.52 (0.77) | 6 (2–6) | 5.49 (0.87) | 6 (2–6) |
| The attention paid to suggestions you make | 5.66 (0.72) | 6 (4–7) | 5.44 (1.02) | 6 (2–7) | 5.41 (1.02) | 6 (2–7) |
| Your hours of work | 5.51 (1.16) | 6 (2–7) | 5.58 (0.81) | 6 (2–6) | 5.47 (0.94) | 6 (2–6) |
| The amount of variety in your job | 5.66 (0.84) | 6 (3–7) | 5.70 (0.54) | 6 (3–6) | 5.65 (0.60) | 6 (3–6) |
| Your job security | 6.10 (0.68) | 6 (4–7) | 5.61 (0.69) | 6 (2–7) | 5.55 (0.71) | 6 (2–6) |
| Total score (Overall scale job satisfaction)a | 85.4 (7.97) | 89 (60–95) | 78.77 (7.24) | 81 (58–94) | 77.84 (6.83) | 80 (58–85) |
ESG=Escala de Satisfacción Laboral, Warr-Cook-Wall (1979) & Pérez-Fidalgo (1995), SD=standard deviation, IQR=interquartile range.
There are few studies that address the job status of medical graduates from universities in Latin America. In our study we found that the male gender was the most frequent and the age range was similar to other studies in Peru15,16 and Colombia.14 On the other hand, the majority of graduates surveyed were from the last years, which can be due to the greater ease of contact through the social networks and other virtual communication media with greater use in the last years.20
Graduates reported that vocation was the main reason to study medicine, a result similar to that obtained by Guevara et al.16 It is important to deepen this aspect at undergraduate and postgraduate level, since it has been related to variables such as career choice,21 student desertion22,23 and job and professional satisfaction.21,24 UNSAAC graduates most frequently performed primary health care (PHC) activities during their undergraduate program, which may be due to their proximity to rural communities and to the promotion of PHC at this university. These results differ from those reported in a study conducted in Chile, which shows a low interest in this type of undergraduate activities.25 In Peru there are studies that show a student population that considers important the training in PHC, but with a little interest in developing professionally in related areas or working in the interior of the country and rural areas.26–28
We found that the majority of graduates were dissatisfied with the curriculum of their university of origin, results that differ from those found by Park et al. (2011)29 and Castro (2014).13 It is necessary that the universities evaluated in the present study analyze their undergraduate curriculum and make the necessary innovations to improve the quality of teaching. Currently there are several strategies that not only engage teachers, but also include student participation for the continuous improvement of their university curricula.8,30,31
All the graduates surveyed had completed at least one academic postgraduate academic study, mainly a diplomate and/or a master's degree. Also, more than 50% had performed some medical specialty. Similar results were found in previous studies in Peru15,16 and Chile,17 but differ from those reported by Castro (2014) who found that more than 50% of graduates from a University of Colombia had not performed any postgraduate study.13
In our study we found that the majority of graduates got their first job (not including SERUMS) in less than a year, mainly through personal contacts. In addition, 81% of participants had a current salary ranging from $1000 to $3000. These results related to the first job and to the current salary are in line with those reported in studies in Peru16 and Chile.17
The majority of graduates had more than one job, working in the public and private sector at the same time. Studies in Colombia,13 Peru15 and Chile32 found a similar reality, having as main cause the lack of economic satisfaction. We also show a low labor projection in the rural area, which would be closely related to the causes described above.26–28 On the other hand, we found that the majority had a health-care related job, similar to the findings in studies conducted in countries of the Americas13,15–17,32,33 and Asia.34 The other side of the coin was seen in the scientific aspect, since only 10% also carried out research activities. This may be due to the scarce scientific promotion of Peruvian medical societies.35
In our study, there was a positive outlook for the job satisfaction of graduates, a result that is consistent with the findings in studies from Peru15,16 and Colombia.14 This may be due to factors such as a nice work environment, incentives and recognition and good relationships between workers.11,36 The approach to these aspects should not be overlooked as it has been seen that good job satisfaction is directly related to a higher quality and efficiency of health systems.11
One limitation of the study was the difficulty of contacting with the graduates of older generations, which may have generated an error factor in the results. Future researches should propose strategies for a greater subject inclusion in this type of studies, probably using virtual media recently developed.
In conclusion, the majority of graduates surveyed currently live in Peru. Vocation was the main reason to study medicine and more than half were dissatisfied with their undergraduate curriculum. All graduates had at least one postgraduate study, either academic or specialization. Current salaries ranged from $ 1000 to $3000 and work was predominantly in the public sector and in urban areas. Finally, participants reported feeling generally satisfied about their current job status.
It is necessary that universities evaluate the implementation of educational interventions, seeking to foster inter-institutional relations and create an increasingly better and broader work field for their medical graduates. In addition, this job status analysis should be a fundamental part of the process of self-evaluation and continuous improvement of universities.
FundingPart of the study was funded by the “Competitive Research Fund 2015” of the Sociedad Científica Médico Estudiantil Peruana (SOCIMEP).
Authors’ contributionsCJTH conceived the idea and design of the study. All the authors analyzed and interpreted the data, drafted the manuscript, critically reviewed the content, and gave the final approval to the manuscript.
Conflict of interestThe authors declare no conflict of interest concerning this article.
To Cristian Díaz MD MSc and Jorge Osada Liy MD MSc, for critically review this manuscript.