This study aims to adapt and assess the validity and reliability of the “Mes Outils de Travail Intellectuel” (My Intellectual Work Tools) scale for measuring learning strategies among Moroccan nursing students.
Subjects and methodsThe validation study was conducted in the Marrakesh-Safi region of Morocco, utilizing the “Mes Outils de Travail Intellectuel” scale developed by Wolfs in 1998. To accommodate the Moroccan linguistic context, the scale was maintained in French, undergoing revision by local experts and pre-testing with 30 nursing students. Subsequently, it was administered to a comprehensive sample of 465 first-year undergraduate students for psychometric validation. Acceptability was evaluated by examining refusal rates, missing data, and item comprehension. Factorial validity was assessed through principal component analysis for each questionnaire construct, while reliability was determined using Cronbach's alpha coefficient.
Results and discussionThe questionnaire achieved a response rate of 98%, with no instances of misunderstanding or missing data. Principal component analysis facilitated the removal of irrelevant items and extraction of essential factors from the dataset. The reliability of the questionnaire constructs was satisfactory, with Cronbach's alpha exceeding 0.7. These findings affirm the efficacy of the adapted “Mes Outils de Travail Intellectuel” scale for evaluating learning strategies among Moroccan nursing students. Although the study is limited to first-year students, it establishes a framework for the instrument's application in the specific context of nursing education in Morocco.
El presente estudio tiene como objetivo adaptar y evaluar la validez y fiabilidad de la escala de medición de estrategias de aprendizaje «Mes Outils de Travail Intellectuel» (Mis Herramientas de Trabajo Intelectual) entre estudiantes de enfermería en Marruecos.
Sujetos y métodosLa validación se llevó a cabo en la región de Marrakech-Safi, utilizando el cuestionario «Mes Outils de Travail Intellectuel» desarrollado por Wolfs en 1998. Para adecuarla al contexto lingüístico marroquí, la escala se mantuvo en francés, siendo revisada por expertos locales y pretestada con 30 estudiantes de enfermería. Posteriormente, se administró a una muestra amplia de 465 estudiantes de primer año de licenciatura para una validación psicométrica completa. La aceptabilidad se evaluó analizando las tasas de rechazo, los datos faltantes y la comprensión de los ítems. La validez factorial se examinó mediante análisis de componentes principales para cada constructo del cuestionario, mientras que la fiabilidad se evaluó mediante el coeficiente alfa de Cronbach.
Resultados y discusiónLa tasa de respuesta al cuestionario fue del 98%, sin casos de malentendidos o datos faltantes. El análisis de componentes principales permitió eliminar ítems irrelevantes y extraer factores importantes. La fiabilidad de los constructos del cuestionario resultó satisfactoria, con un coeficiente alfa de Cronbach superior a 0,7. Estos resultados confirman la efectividad del instrumento adaptado «Mes Outils de Travail Intellectuel» en la evaluación de estrategias de aprendizaje entre estudiantes de enfermería marroquíes. Aunque el estudio se limitó a estudiantes de primer año, sienta las bases para su uso en el contexto específico de la educación en enfermería en Marruecos.
Nursing education encounters numerous challenges, including the rapid evolution of healthcare knowledge, skills, techniques, and technologies.1 This underscores the pressing need to significantly enhance teaching quality to cultivate competent and self-regulated professionals capable of lifelong learning. Meeting these demands necessitates acquiring a profound understanding of learning mechanisms and strategies, mastering self-regulation skills, and comprehending new technologies.
The concept of learning strategies originates from the transposition of concepts from cognitive psychology into the realm of education and pedagogy. As articulated by Weinstein and Mayer (1986), it encompasses a range of deliberate actions such as behaviors, thoughts, methods, means, procedures, or techniques that facilitate skill demonstration and are selected based on the context and objective to be achieved.2 This definition, widely cited in the literature, has influenced subsequent authors.3
Several studies have examined learning strategies in students across different education levels, either descriptively or comparatively,4–9 elucidating their impact on academic performance and long-term learning outcomes. These strategies are evaluated through self-report questionnaires, affording students the opportunity to uncover their learning profile and assess their habitual learning approaches.10 Among these instruments, the one developed by Wolfs in 1998, titled “Mes Outils de Travail Intellectuel” (My Intellectual Work Tools), distinguishes itself for its objective of identifying the most effective learning strategies for students' academic success.9 It serves as a valuable foundation for enhancing students' study methods.11
In Morocco, nursing education functions within the framework of the Licence-Master-Doctorat (LMD) system, tailored to address contemporary healthcare demands. Its primary objective is to cultivate nursing competence from the onset of training, while enhancing the efficiency of care delivery and overall performance. This student-centered educational model necessitates the deliberate and systematic integration of effective learning strategies to foster autonomous and strategic future professionals.
Nevertheless, the existing scientific literature lacks studies examining the learning strategies and methodologies employed by nursing students in Morocco. This preliminary investigation proposes an approach to validate the “Mes Outils de Travail Intellectuel” measurement instrument among Moroccan nursing students. This tool will enable researchers to explore and assess students' learning strategies, fostering metacognitive reflection on their study behaviors, learning approaches, and encountered difficulties during their transition from “pupil” to “student” or from “Lycée” to “higher education.” It will also establish a robust foundation for implementing a training program aimed at cultivating “strategic students” capable of effectively engaging in comprehensive learning with appropriate strategies. Furthermore, this tool will contribute to the development of essential study skills such as time management, study planning, note-taking, memorization, and self-assessment, which are invaluable assets for their future professional and academic endeavors.
Subjects and methodsMeasuring instrumentThe “Mes Outils de Travail Intellectuel” measurement scale is a self-assessment questionnaire developed by Wolfs in 1998 for students in the French community attending secondary education and/or commencing higher education within the Belgian context. Its purpose is to evaluate learners' perceptions of their learning strategies, attitudes, and behaviors. Consisting of 42 questions and 130 items, the questionnaire employs a Likert scale with 4 options, ranging from “Never ”to “Always.” These questions are categorized by the author into 10 intellectual work tools covering various cognitive, metacognitive, affective, and support aspects. These tools are further organized into 4 learning dimensions: “comprehension-appropriation,” “analysis-synthesis,” “feeling of low competence,” and “involvement-commitment”.9
Study location and target populationThe validation study was conducted at the 3 Higher Institutes of Nursing Professions and Health Techniques (ISPITS) in the Marrakesh-Safi region, one of the main regions of Morocco,12 between February and June 2022. The sample comprised 465 students (364 girls and 101 boys) newly enrolled in the first year of the bachelor's cycle, selected using an exhaustive sampling method. The study encompassed 5 streams.
ProceduresIn Morocco, French is second only to Arabic in terms of linguistic importance,13 playing a leading role in higher education, particularly in the field of nursing. To maintain consistency with the context of use, the French language of the original tool has been preserved in this adaptation.
Use of educational expertsThe experts were selected based on their profiles and professional experience. A committee of 5 Moroccan experts, including a nursing teacher, revised the original version of “Mes Outils de Travail Intellectuel”. Their expertise and current use of the French language in teaching were crucial. A preliminary reading was conducted to understand the meaning of each item and identify any divergent interpretations that might lead to confusion among Moroccan students.
Pre-testing with studentsThe revised version, after rewording ambiguous elements, underwent pre-testing with 30 first-year nursing students randomly selected from another ISPITS outside the study region. The students' feedback was considered to enhance the tool's quality, given that the allotted time to complete the questionnaire was 90 min.
Synthesis and validation of the adapted versionA meeting with the experts facilitated the synthesis of necessary adjustments and consensus on the version tailored to the Moroccan context.
Validation of the psychometric properties of the adapted versionThe adapted version of the “Mes Outils de Travail Intellectuel” questionnaire was administered to a comprehensive sample of 465 first-year nursing students in the Marrakech-Safi region, including students from all 3 institutes in the region. Questionnaires were distributed according to a pre-established timetable, in coordination with the Director of Studies and option coordinators, during scheduled class hours.
Before commencing the questionnaire, students were briefed on the study's purpose and assured that it did not assess their academic level, with a guarantee of anonymity for their responses. The importance of providing honest and sincere answers was emphasized by the researcher.
Following questionnaire distribution, students had the opportunity to seek clarification on any unclear points. An example of a questionnaire item was provided to demonstrate the application of the Likert scale. The allotted time for completing both the questionnaire and the survey in its entirety was 35 min.
AcceptabilityThe acceptability of the adapted version of the “Mes Outils de Travail Intellectuel” instrument was assessed by analyzing the percentage of refusals, missing data, and items that were difficult to understand.
ValidityThe factorial structure of each group of items was verified using principal component analysis (PCA), a method aimed at reducing the considerable number of variables to a minimal number of principal components to explain the maximum total variance in the set of variables.14,15
Before applying PCA, a correlation matrix and determinant score analysis were performed to assess the relevance of the dataset. The correlation matrix ensured the presence of minimal correlations between the studied variables (correlation coefficient >0.3), while the determinant score verified the absence of multicollinearity between variables, with a threshold set at 0.00001.16
Additional measures, such as the Kaiser–Meyer–Olkin (KMO) index and Bartlett's sphericity test, were used to assess the factorability of the data. A KMO index above 0.80 indicates satisfactory factorability, between 0.60 and 0.80 average factorability, and below 0.60 unsatisfactory factorability. Bartlett's test evaluated the null hypothesis that the variables are orthogonal, with a significance threshold set at P<.001 to continue the analysis.17
To determine the number of factors to extract, the Kaiser criterion, also known as the eigenvalue criterion, was used. An eigenvalue greater than 1 is generally retained, indicating a significant contribution of the factor to the total variance.15 It is recommended to retain factors explaining at least 50% of the total variance to ensure adequate representation of the data.17
To simplify the interpretation of the factors extracted during the initial extraction, an orthogonal approach was adopted using the Varimax method. This method aims to reduce the number of variables with high loadings on each factor, thus maximizing the differences between the structure coefficients and promoting optimal dispersion of loadings.18 Only items with factor loadings above 0.6 were retained, demonstrating their usefulness in measuring the particular construct. Items with factor loadings of less than 0.6 were excluded, as they did not contribute significantly to the construction of the construct.19
To ensure a more stable and valid factorial solution, it is recommended that 3 or more items are loaded onto each component. However, an insufficient number of items loaded on a component may indicate low reliability of that component or poor item specificity, thus compromising the validity and reliability of the factor analysis.18,20,21
ReliabilityReliability, expressed in terms of internal consistency, was assessed using Cronbach's alpha coefficient, widely used in the field of educational sciences.22 This coefficient measures the degree of homogeneity of a set of items measuring the same phenomenon or the same dimensions of a phenomenon.23–25 It ranges from 0 to 1, with a value close to 1 indicating a more robust correlation between items on the same scale. Generally, a value between 0.50 and 0.70 is considered acceptable, while a value above 0.70 indicates a high level of reliability.26–28
In exploratory research, a coefficient of 0.50 or 0.60 is generally considered acceptable, while in confirmatory research, a recommended value should exceed 0.8.29 It is important to note that the value of Cronbach's alpha is influenced both by the internal consistency of the questions and by the number of items making up the construct studied; the fewer questions or items there are in the scale or test, the lower Cronbach's alpha may be.30–32
ResultsPopulation characteristicsThe majority of participants in our study were female (78.3%). Most fell within the 18–20 age bracket (76.1%). Nearly all participants were single (98.3%) and resided in urban areas (77%), predominantly with their parents (67.5%). The most common field of study among our sample was “nursing care” (75.9%), with the “multi-skilled nurse” option being most prevalent (38.3%). The decision to pursue a particular study option was primarily driven by vocational aspirations for 68.4% of participants.
Adapted versionThe expert committee synthesized their analysis and the outcomes of the pre-test, leading to a consensus on the content of the adapted questionnaire version. Discussions addressed specific items, with agreement reached on a unified version by all experts. For instance, item 4 “When I fail a test or exam...” was revised to “When I receive a low grade in a test or exam...”. Similarly, item 20 “...I phone a more knowledgeable colleague” was adjusted to “...I phone a colleague with expertise in the subject”.
To enhance the validity and reliability of the tools, they were categorized into 3 distinct groups: “cognitive tools”, “metacognitive tools”, and “affective and supportive tools", ensuring a balanced distribution of items in each category.
Tool 6,2 “Memorization through appropriation", was removed due to redundancy with elements of tools 1, 2, and 4.1 The experts deemed that the “understanding-appropriation ”dimension, comprising tools 1, 2, and 3, covered this aspect of memorization.
Tool 9,1 “self-assessment of difficulties", was classified under metacognitive tools, while tool 9,2 “self-confidence", was categorized as affective tools. The label “dimension ”was replaced with “tools ”for the “understanding-appropriation ”and “analysis-synthesis ”sub-dimensions.
To standardize the item rating scale, questions 38, 40, and 41 were rephrased to align with the Likert scale, while adhering to the author's specified scoring rules.
To streamline response times, non-essential questions were excluded. Only questions essential for calculating the frequency of tool use were retained. Consequently, questions 6, 9, 30, 33, 36, 37, 39, and 42 were eliminated, resulting in a reduced version comprising 3 classes of intellectual work tools with 34 questions and 56 items: cognitive tools (23 items), metacognitive tools (19 items), and affective and supportive tools (14 items).
Psychometric testsAcceptabilityThe response rate among participants was 98%, with a complete absence of misunderstandings or missing data.
Validity and reliabilityThe cognitive toolsThese tools consist of 23 items and are categorized into 3 subgroups: comprehension-appropriation tools (10 items), analysis-synthesis tools (10 items), and the rote memorization tool (3 items).
The comprehension-appropriation toolsThese encompass items related to seeking meaning and information, reformulating, exemplifying, and memorizing through appropriation.
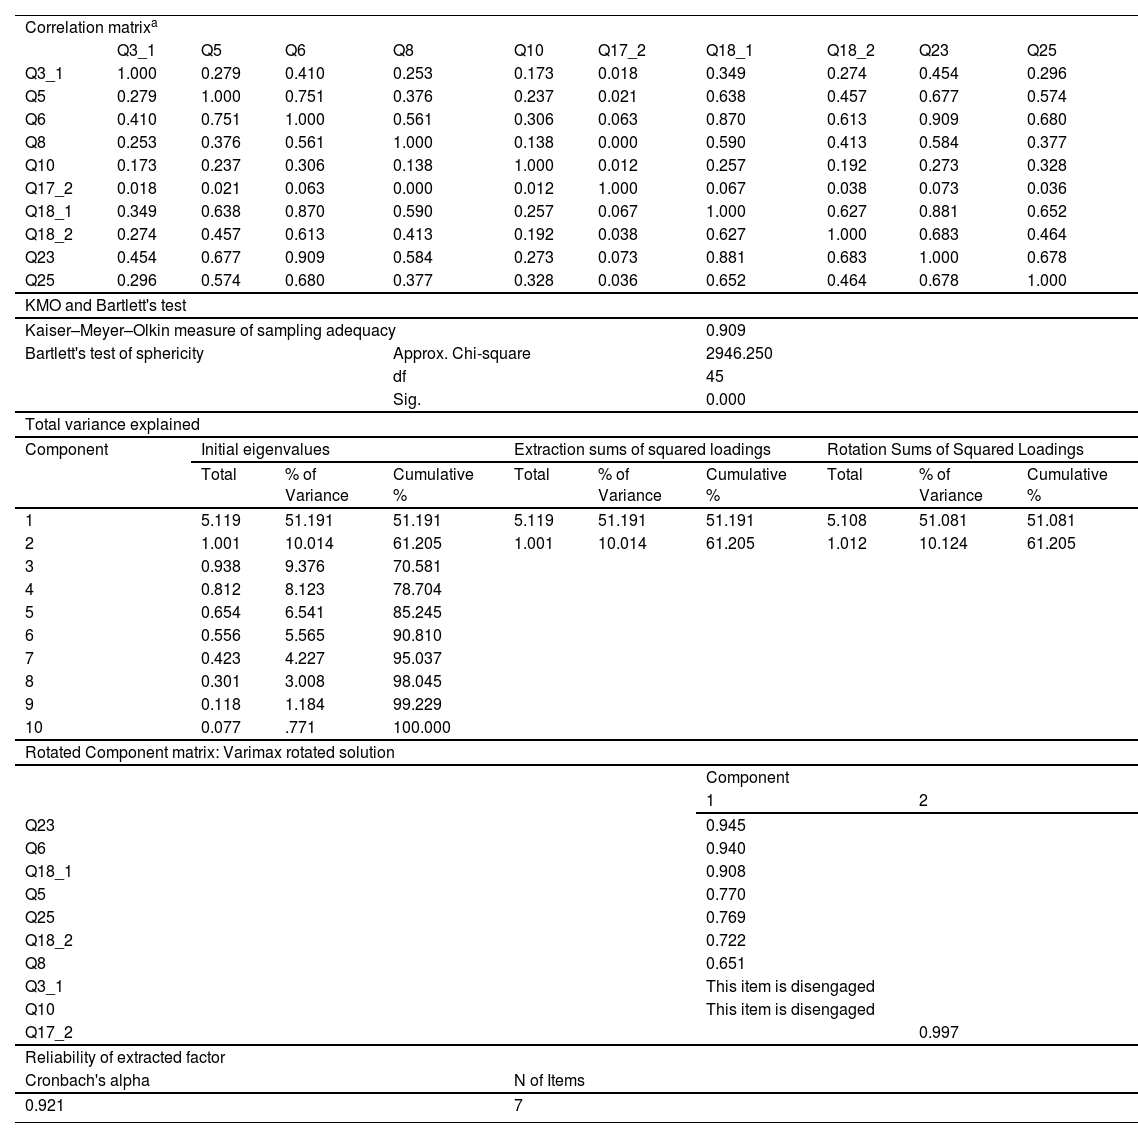
Prior to PCA, the suitability of the data for factor analysis was assessed. Table 1 presents the results showing that the correlation matrix indicates sufficient correlations between the items studied, all exceeding 0.3. The determinant score, calculated at 0.002, significantly surpasses 0.00001, indicating an absence of multicollinearity in the data. The KMO index, evaluated at 0.909, is considered satisfactory. Additionally, Bartlett's sphericity test yielded a statistically significant result (P=.000), supporting the factorability of the data and justifying the utilization of factor analysis.
Summary of statistical analyses of comprehension-appropriation tools.
| Correlation matrixa | ||||||||||
| Q3_1 | Q5 | Q6 | Q8 | Q10 | Q17_2 | Q18_1 | Q18_2 | Q23 | Q25 | |
| Q3_1 | 1.000 | 0.279 | 0.410 | 0.253 | 0.173 | 0.018 | 0.349 | 0.274 | 0.454 | 0.296 |
| Q5 | 0.279 | 1.000 | 0.751 | 0.376 | 0.237 | 0.021 | 0.638 | 0.457 | 0.677 | 0.574 |
| Q6 | 0.410 | 0.751 | 1.000 | 0.561 | 0.306 | 0.063 | 0.870 | 0.613 | 0.909 | 0.680 |
| Q8 | 0.253 | 0.376 | 0.561 | 1.000 | 0.138 | 0.000 | 0.590 | 0.413 | 0.584 | 0.377 |
| Q10 | 0.173 | 0.237 | 0.306 | 0.138 | 1.000 | 0.012 | 0.257 | 0.192 | 0.273 | 0.328 |
| Q17_2 | 0.018 | 0.021 | 0.063 | 0.000 | 0.012 | 1.000 | 0.067 | 0.038 | 0.073 | 0.036 |
| Q18_1 | 0.349 | 0.638 | 0.870 | 0.590 | 0.257 | 0.067 | 1.000 | 0.627 | 0.881 | 0.652 |
| Q18_2 | 0.274 | 0.457 | 0.613 | 0.413 | 0.192 | 0.038 | 0.627 | 1.000 | 0.683 | 0.464 |
| Q23 | 0.454 | 0.677 | 0.909 | 0.584 | 0.273 | 0.073 | 0.881 | 0.683 | 1.000 | 0.678 |
| Q25 | 0.296 | 0.574 | 0.680 | 0.377 | 0.328 | 0.036 | 0.652 | 0.464 | 0.678 | 1.000 |
| KMO and Bartlett's test | ||||||||||
| Kaiser–Meyer–Olkin measure of sampling adequacy | 0.909 | |||||||||
| Bartlett's test of sphericity | Approx. Chi-square | 2946.250 | ||||||||
| df | 45 | |||||||||
| Sig. | 0.000 | |||||||||
| Total variance explained | ||||||||||
| Component | Initial eigenvalues | Extraction sums of squared loadings | Rotation Sums of Squared Loadings | |||||||
| Total | % of Variance | Cumulative % | Total | % of Variance | Cumulative % | Total | % of Variance | Cumulative % | ||
| 1 | 5.119 | 51.191 | 51.191 | 5.119 | 51.191 | 51.191 | 5.108 | 51.081 | 51.081 | |
| 2 | 1.001 | 10.014 | 61.205 | 1.001 | 10.014 | 61.205 | 1.012 | 10.124 | 61.205 | |
| 3 | 0.938 | 9.376 | 70.581 | |||||||
| 4 | 0.812 | 8.123 | 78.704 | |||||||
| 5 | 0.654 | 6.541 | 85.245 | |||||||
| 6 | 0.556 | 5.565 | 90.810 | |||||||
| 7 | 0.423 | 4.227 | 95.037 | |||||||
| 8 | 0.301 | 3.008 | 98.045 | |||||||
| 9 | 0.118 | 1.184 | 99.229 | |||||||
| 10 | 0.077 | .771 | 100.000 | |||||||
| Rotated Component matrix: Varimax rotated solution | ||||||||||
| Component | ||||||||||
| 1 | 2 | |||||||||
| Q23 | 0.945 | |||||||||
| Q6 | 0.940 | |||||||||
| Q18_1 | 0.908 | |||||||||
| Q5 | 0.770 | |||||||||
| Q25 | 0.769 | |||||||||
| Q18_2 | 0.722 | |||||||||
| Q8 | 0.651 | |||||||||
| Q3_1 | This item is disengaged | |||||||||
| Q10 | This item is disengaged | |||||||||
| Q17_2 | 0.997 | |||||||||
| Reliability of extracted factor | ||||||||||
| Cronbach's alpha | N of Items | |||||||||
| 0.921 | 7 | |||||||||
PCA unveiled the presence of two initial non-rotated factors to be extracted, with eigenvalues exceeding Kaiser's criterion of 1, explaining 51.081% and 10.124% of the variance, respectively. The two extracted factors, collectively accounting for 61.205% of the variance, are well represented. To facilitate interpretation, a Varimax rotation was performed unveiling factor loadings exceeding 0.6 for each of the two factors. Seven items clustered on the first factor and only one on the second. However, items Q3_1 and Q10 exhibited factor loadings below 0.6, thus exlcuding them from the questionnaire. Furthermore, the second component, comprising fewer than three items, was deemed unreliable and removed from the questionnaire, resulting in the retention of only one factor.
Cronbach's alpha for the extracted factor stands at 0.921, indicative of high reliability and affirming the internal consistency of the construct.
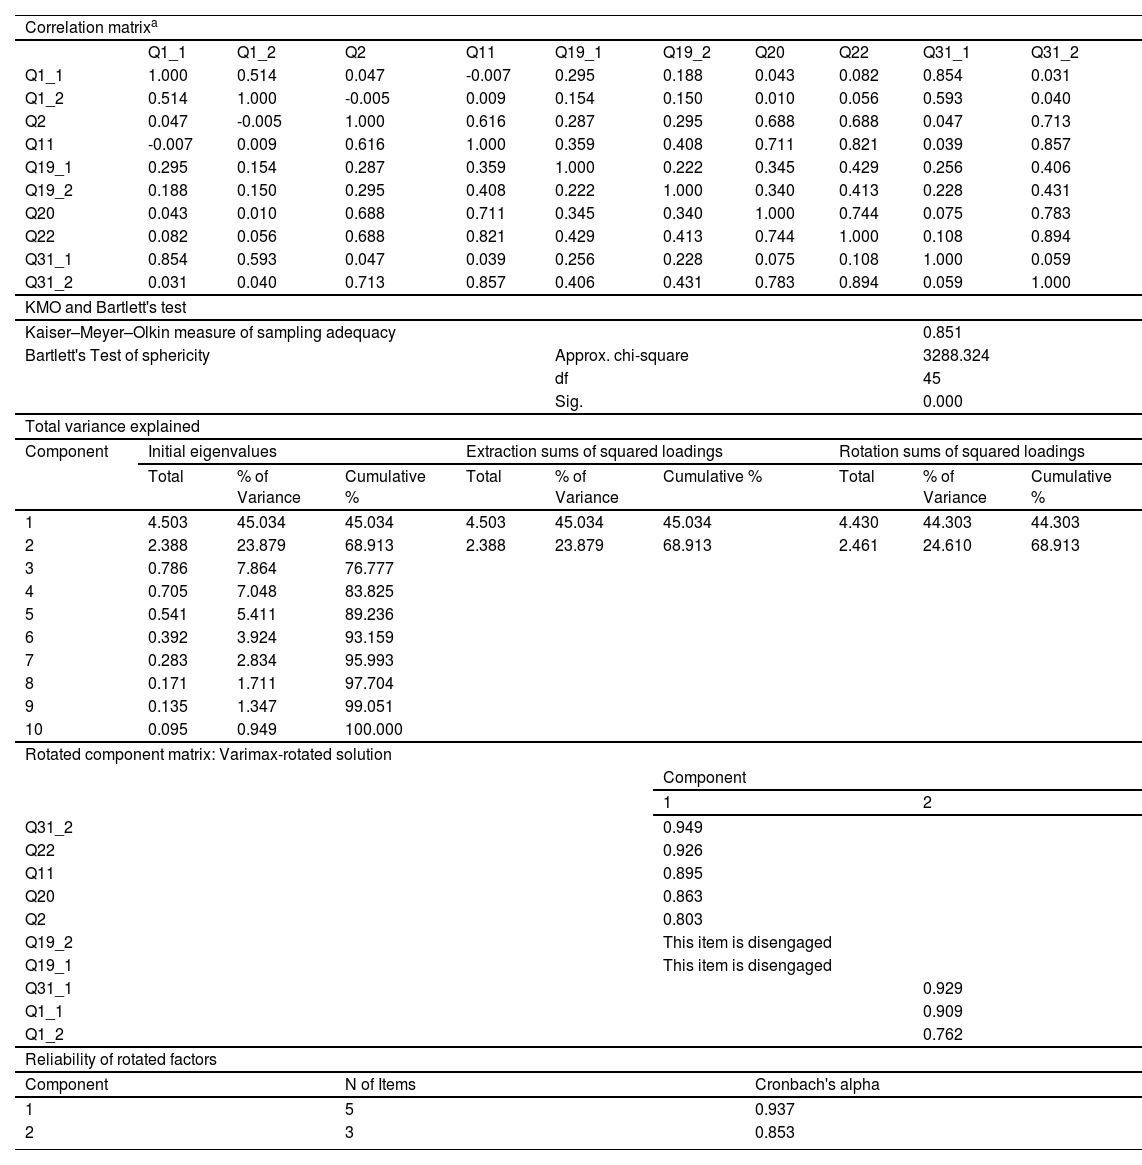
The analysis-synthesis toolsThese encompass items pertaining to the analysis of relationships between ideas, as well as the structuring and reorganization of information based on personal criteria. The outcomes presented in Table 2 indicate that the correlation matrix demonstrates satisfactory correlations among the 10 items comprising the synthesis analysis tools (all exceeding 0.3). The determinant score, calculated at 0.001 (above 0.00001), suggests an absence of multicollinearity in the data. The KMO index, assessed at 0.851, meets the criteria for adequacy. Additionally, Bartlett's sphericity test yields a statistically significant result (P=.000), confirming the factorability of the data and justifying a factor analysis.
Summary of statistical analyses of analysis-synthesis tools.
| Correlation matrixa | ||||||||||
| Q1_1 | Q1_2 | Q2 | Q11 | Q19_1 | Q19_2 | Q20 | Q22 | Q31_1 | Q31_2 | |
| Q1_1 | 1.000 | 0.514 | 0.047 | -0.007 | 0.295 | 0.188 | 0.043 | 0.082 | 0.854 | 0.031 |
| Q1_2 | 0.514 | 1.000 | -0.005 | 0.009 | 0.154 | 0.150 | 0.010 | 0.056 | 0.593 | 0.040 |
| Q2 | 0.047 | -0.005 | 1.000 | 0.616 | 0.287 | 0.295 | 0.688 | 0.688 | 0.047 | 0.713 |
| Q11 | -0.007 | 0.009 | 0.616 | 1.000 | 0.359 | 0.408 | 0.711 | 0.821 | 0.039 | 0.857 |
| Q19_1 | 0.295 | 0.154 | 0.287 | 0.359 | 1.000 | 0.222 | 0.345 | 0.429 | 0.256 | 0.406 |
| Q19_2 | 0.188 | 0.150 | 0.295 | 0.408 | 0.222 | 1.000 | 0.340 | 0.413 | 0.228 | 0.431 |
| Q20 | 0.043 | 0.010 | 0.688 | 0.711 | 0.345 | 0.340 | 1.000 | 0.744 | 0.075 | 0.783 |
| Q22 | 0.082 | 0.056 | 0.688 | 0.821 | 0.429 | 0.413 | 0.744 | 1.000 | 0.108 | 0.894 |
| Q31_1 | 0.854 | 0.593 | 0.047 | 0.039 | 0.256 | 0.228 | 0.075 | 0.108 | 1.000 | 0.059 |
| Q31_2 | 0.031 | 0.040 | 0.713 | 0.857 | 0.406 | 0.431 | 0.783 | 0.894 | 0.059 | 1.000 |
| KMO and Bartlett's test | ||||||||||
| Kaiser–Meyer–Olkin measure of sampling adequacy | 0.851 | |||||||||
| Bartlett's Test of sphericity | Approx. chi-square | 3288.324 | ||||||||
| df | 45 | |||||||||
| Sig. | 0.000 | |||||||||
| Total variance explained | ||||||||||
| Component | Initial eigenvalues | Extraction sums of squared loadings | Rotation sums of squared loadings | |||||||
| Total | % of Variance | Cumulative % | Total | % of Variance | Cumulative % | Total | % of Variance | Cumulative % | ||
| 1 | 4.503 | 45.034 | 45.034 | 4.503 | 45.034 | 45.034 | 4.430 | 44.303 | 44.303 | |
| 2 | 2.388 | 23.879 | 68.913 | 2.388 | 23.879 | 68.913 | 2.461 | 24.610 | 68.913 | |
| 3 | 0.786 | 7.864 | 76.777 | |||||||
| 4 | 0.705 | 7.048 | 83.825 | |||||||
| 5 | 0.541 | 5.411 | 89.236 | |||||||
| 6 | 0.392 | 3.924 | 93.159 | |||||||
| 7 | 0.283 | 2.834 | 95.993 | |||||||
| 8 | 0.171 | 1.711 | 97.704 | |||||||
| 9 | 0.135 | 1.347 | 99.051 | |||||||
| 10 | 0.095 | 0.949 | 100.000 | |||||||
| Rotated component matrix: Varimax-rotated solution | ||||||||||
| Component | ||||||||||
| 1 | 2 | |||||||||
| Q31_2 | 0.949 | |||||||||
| Q22 | 0.926 | |||||||||
| Q11 | 0.895 | |||||||||
| Q20 | 0.863 | |||||||||
| Q2 | 0.803 | |||||||||
| Q19_2 | This item is disengaged | |||||||||
| Q19_1 | This item is disengaged | |||||||||
| Q31_1 | 0.929 | |||||||||
| Q1_1 | 0.909 | |||||||||
| Q1_2 | 0.762 | |||||||||
| Reliability of rotated factors | ||||||||||
| Component | N of Items | Cronbach's alpha | ||||||||
| 1 | 5 | 0.937 | ||||||||
| 2 | 3 | 0.853 | ||||||||
PCA reveals the presence of 2 initial non-rotating factors to be extracted, with eigenvalues surpassing the Kaiser criterion of 1, elucidating 44.303% and 24.61% of variance, respectively. Together, these 2 factors account for 68.913% of the variance, providing a comprehensive representation. To facilitate interpretation, a Varimax rotation was conducted, demonstrating item loadings above 0.6 on 2 factors, with 5 items on component 1 and 3 items on component 2. However, items Q19_1 and Q19_2 exhibit factor loadings below 0.6, leading to their exclusion from the questionnaire. Items related to text structuring and reorganization load prominently on component 1, whereas those pertaining to text analysis load strongly on component 2.
Cronbach's alpha coefficients for the 2 rotated factors stand at 0.937 and 0.853, respectively, attesting to their high reliabilities and confirming the internal consistency of each component.
The rote memorization toolThe findings of the factor analysis applied of this tool demonstrate that the correlation matrix exhibits adequate correlations among the three items comprising the rote memorization tool (all exceeding 0.3). The determinant score, calculated at 0.012, substantially exceeds 0.00001, indicating an absence of multicollinearity in the dataset. With a KMO index of 0.742, the data demonstrate moderate factorability. Additionally, Bartlett's sphericity test yielded a statistically significant result (P=.000), further affirming the factorability of the data and justifying the utilization of factor analysis.
PCA revealed the presence of a single initial non-rotating factor to be extracted, with an eigenvalue exceeding the Kaiser criterion of 1, explaining 95.144% of the total variance, thereby providing a comprehensive representation. The component matrix affirms that the 3 items, each with factor loadings surpassing the minimum threshold of 0.6, are closely associated with a single factor, thus contributing significantly to its definition.
Cronbach's alpha coefficient for the extracted factor stands at 0.974, confirming the high reliability and internal consistency of the construct.
The metacognitive toolsThis category encompasses 19 items, which are further subdivided into 2 sub-categories: the tool for anticipating assessment situations and utilizing knowledge (4 items), and the tool for self-assessment of learning difficulties (15 items).
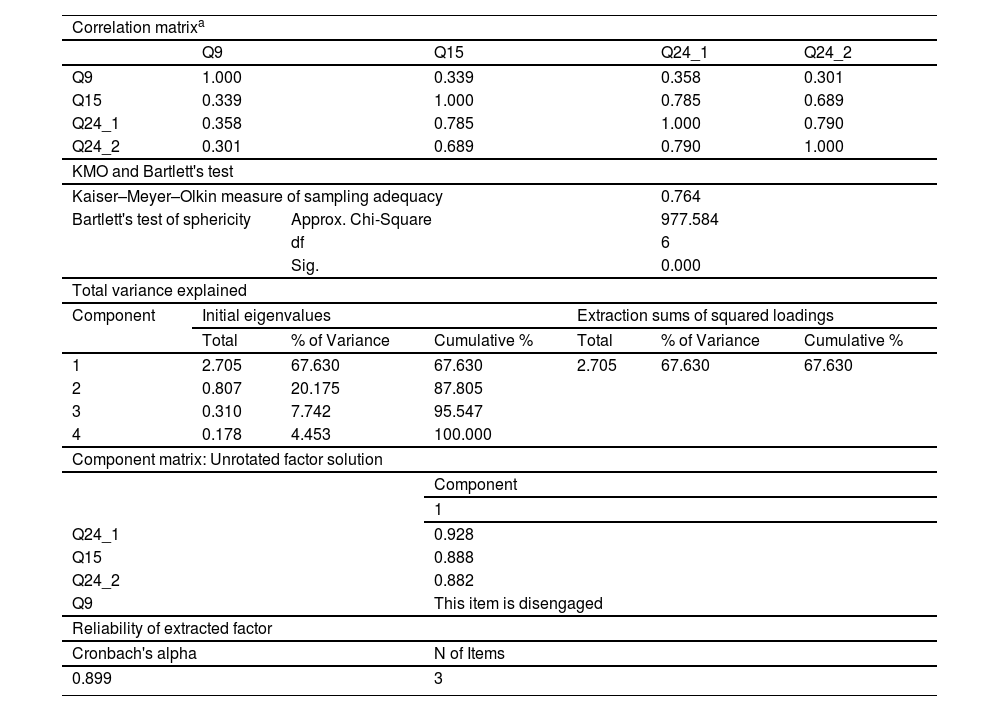
The anticipation toolThe results presented in Table 3 demonstrate sufficient correlations among the 4 items comprising the anticipation tool, all surpassing the threshold of 0.3. The determinant score of 0.12 significantly exceeds 0.00001, indicating an absence of multicollinearity within the dataset. The KMO index, although moderate at 0.764, still supports the factorability of the data. Additionally, Bartlett's sphericity test yielded a statistically significant result (P=.000), further justifying the application of factor analysis.
Summary of statistical analyses of anticipation tool
| Correlation matrixa | ||||||
| Q9 | Q15 | Q24_1 | Q24_2 | |||
| Q9 | 1.000 | 0.339 | 0.358 | 0.301 | ||
| Q15 | 0.339 | 1.000 | 0.785 | 0.689 | ||
| Q24_1 | 0.358 | 0.785 | 1.000 | 0.790 | ||
| Q24_2 | 0.301 | 0.689 | 0.790 | 1.000 | ||
| KMO and Bartlett's test | ||||||
| Kaiser–Meyer–Olkin measure of sampling adequacy | 0.764 | |||||
| Bartlett's test of sphericity | Approx. Chi-Square | 977.584 | ||||
| df | 6 | |||||
| Sig. | 0.000 | |||||
| Total variance explained | ||||||
| Component | Initial eigenvalues | Extraction sums of squared loadings | ||||
| Total | % of Variance | Cumulative % | Total | % of Variance | Cumulative % | |
| 1 | 2.705 | 67.630 | 67.630 | 2.705 | 67.630 | 67.630 |
| 2 | 0.807 | 20.175 | 87.805 | |||
| 3 | 0.310 | 7.742 | 95.547 | |||
| 4 | 0.178 | 4.453 | 100.000 | |||
| Component matrix: Unrotated factor solution | ||||||
| Component | ||||||
| 1 | ||||||
| Q24_1 | 0.928 | |||||
| Q15 | 0.888 | |||||
| Q24_2 | 0.882 | |||||
| Q9 | This item is disengaged | |||||
| Reliability of extracted factor | ||||||
| Cronbach's alpha | N of Items | |||||
| 0.899 | 3 | |||||
PCA revealed a single initial non-rotating factor to be extracted, with an eigenvalue surpassing the Kaiser criterion of 1. This factor explains 67.63% of the total variance, effectively representing the data. The component matrix identifies three items with factor loadings exceeding the threshold of 0.6, indicating their strong association with the factor. However, item Q9 exhibits a factor loading below 0.6 and is consequently excluded from the questionnaire.
The calculated Cronbach's alpha coefficient for the extracted factor is 0.899, indicative of high reliability and affirming the internal consistency of the scale.
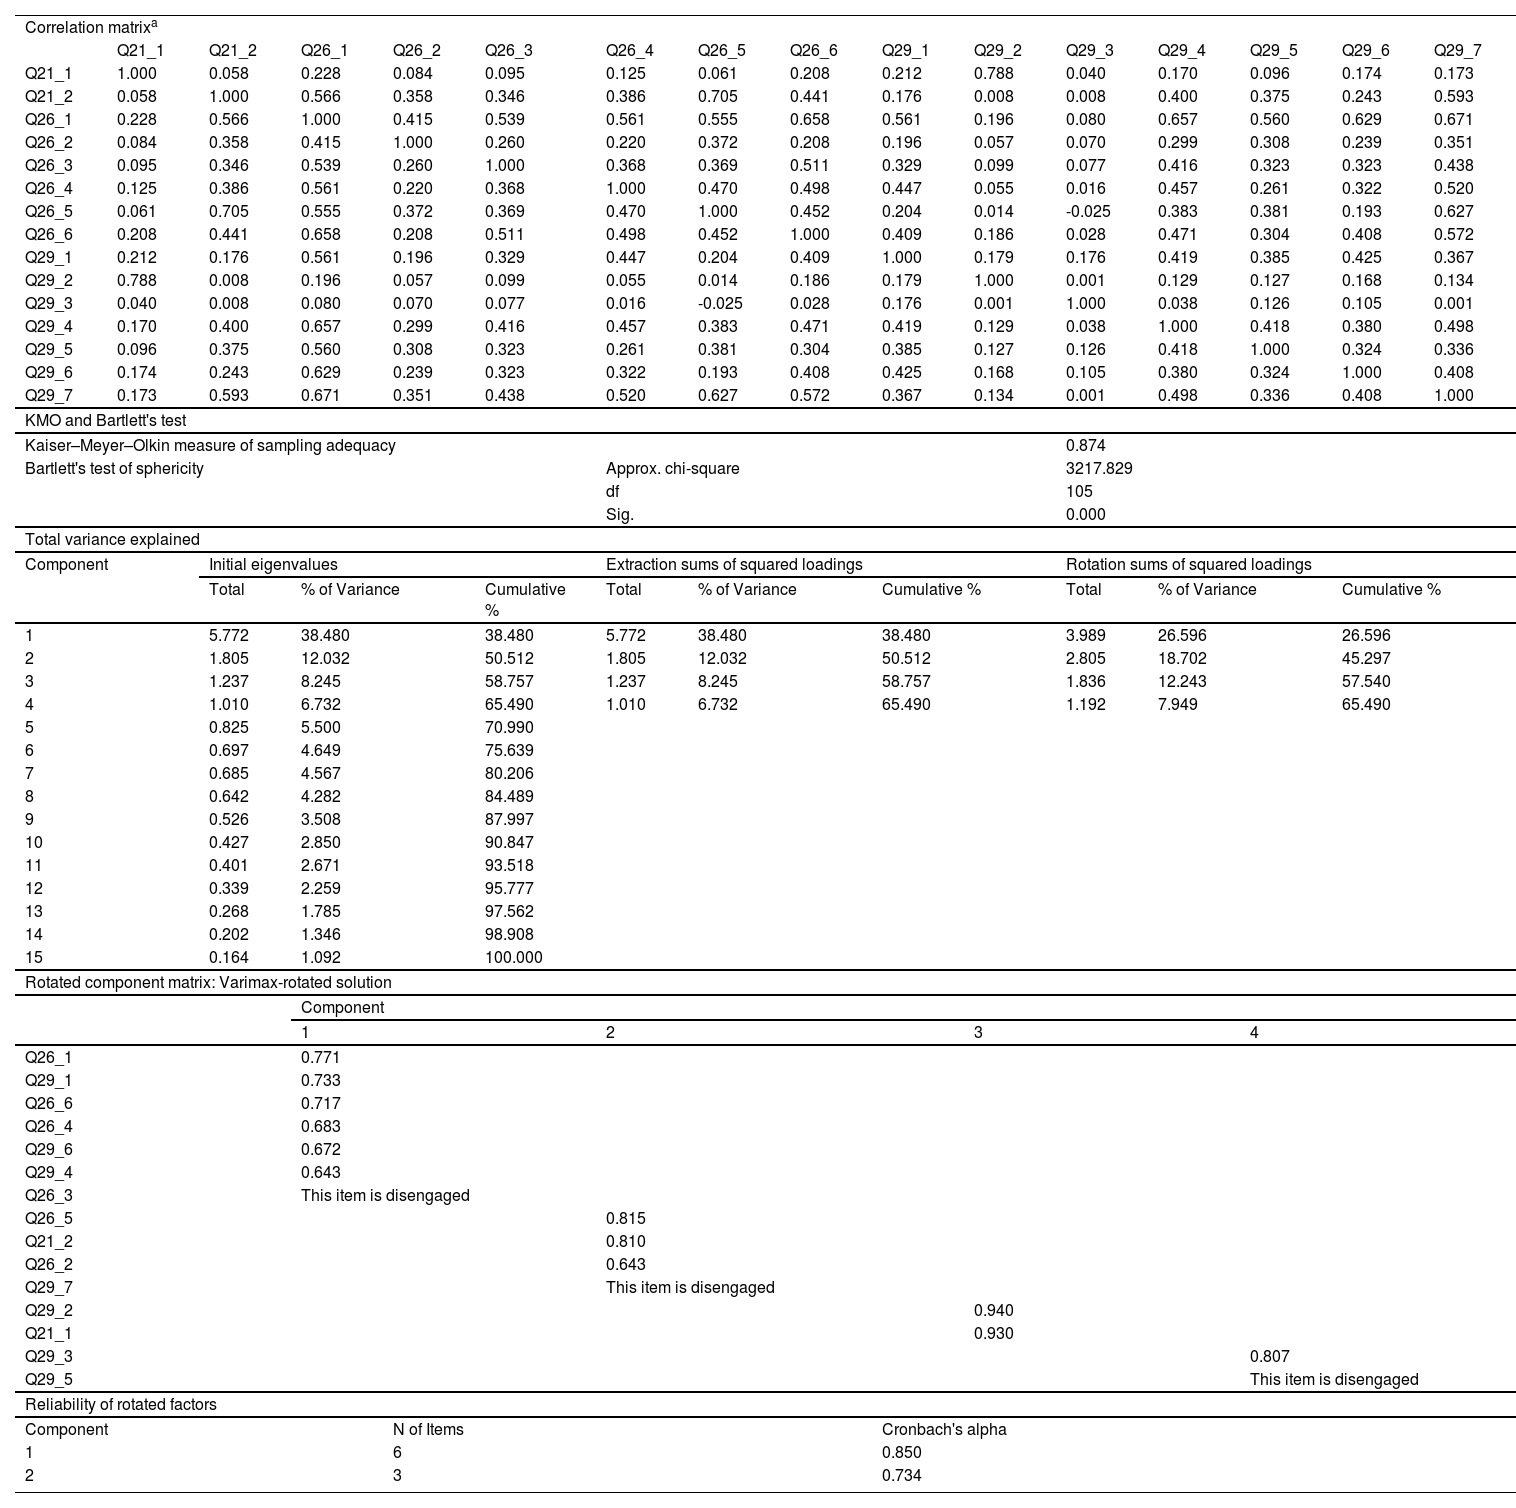
The self-assessment of learning difficulties toolThe findings presented in Table 4 indicate sufficient correlations among the 15 items comprising the Learning Difficulties Self-Assessment Tool, all exceeding the threshold of 0.3. The determinant score of 0.001, significantly greater than 0.00001, suggests an absence of multicollinearity within the dataset. Moreover, the KMO index, evaluated at 0.874, is considered satisfactory. Bartlett's sphericity test yielded a statistically significant result (P=.000), further confirming the factorability of the data and justifying a factor analysis.
Summary of statistical analyses of self-assessment of learning difficulties tool.
| Correlation matrixa | |||||||||||||||
| Q21_1 | Q21_2 | Q26_1 | Q26_2 | Q26_3 | Q26_4 | Q26_5 | Q26_6 | Q29_1 | Q29_2 | Q29_3 | Q29_4 | Q29_5 | Q29_6 | Q29_7 | |
| Q21_1 | 1.000 | 0.058 | 0.228 | 0.084 | 0.095 | 0.125 | 0.061 | 0.208 | 0.212 | 0.788 | 0.040 | 0.170 | 0.096 | 0.174 | 0.173 |
| Q21_2 | 0.058 | 1.000 | 0.566 | 0.358 | 0.346 | 0.386 | 0.705 | 0.441 | 0.176 | 0.008 | 0.008 | 0.400 | 0.375 | 0.243 | 0.593 |
| Q26_1 | 0.228 | 0.566 | 1.000 | 0.415 | 0.539 | 0.561 | 0.555 | 0.658 | 0.561 | 0.196 | 0.080 | 0.657 | 0.560 | 0.629 | 0.671 |
| Q26_2 | 0.084 | 0.358 | 0.415 | 1.000 | 0.260 | 0.220 | 0.372 | 0.208 | 0.196 | 0.057 | 0.070 | 0.299 | 0.308 | 0.239 | 0.351 |
| Q26_3 | 0.095 | 0.346 | 0.539 | 0.260 | 1.000 | 0.368 | 0.369 | 0.511 | 0.329 | 0.099 | 0.077 | 0.416 | 0.323 | 0.323 | 0.438 |
| Q26_4 | 0.125 | 0.386 | 0.561 | 0.220 | 0.368 | 1.000 | 0.470 | 0.498 | 0.447 | 0.055 | 0.016 | 0.457 | 0.261 | 0.322 | 0.520 |
| Q26_5 | 0.061 | 0.705 | 0.555 | 0.372 | 0.369 | 0.470 | 1.000 | 0.452 | 0.204 | 0.014 | -0.025 | 0.383 | 0.381 | 0.193 | 0.627 |
| Q26_6 | 0.208 | 0.441 | 0.658 | 0.208 | 0.511 | 0.498 | 0.452 | 1.000 | 0.409 | 0.186 | 0.028 | 0.471 | 0.304 | 0.408 | 0.572 |
| Q29_1 | 0.212 | 0.176 | 0.561 | 0.196 | 0.329 | 0.447 | 0.204 | 0.409 | 1.000 | 0.179 | 0.176 | 0.419 | 0.385 | 0.425 | 0.367 |
| Q29_2 | 0.788 | 0.008 | 0.196 | 0.057 | 0.099 | 0.055 | 0.014 | 0.186 | 0.179 | 1.000 | 0.001 | 0.129 | 0.127 | 0.168 | 0.134 |
| Q29_3 | 0.040 | 0.008 | 0.080 | 0.070 | 0.077 | 0.016 | -0.025 | 0.028 | 0.176 | 0.001 | 1.000 | 0.038 | 0.126 | 0.105 | 0.001 |
| Q29_4 | 0.170 | 0.400 | 0.657 | 0.299 | 0.416 | 0.457 | 0.383 | 0.471 | 0.419 | 0.129 | 0.038 | 1.000 | 0.418 | 0.380 | 0.498 |
| Q29_5 | 0.096 | 0.375 | 0.560 | 0.308 | 0.323 | 0.261 | 0.381 | 0.304 | 0.385 | 0.127 | 0.126 | 0.418 | 1.000 | 0.324 | 0.336 |
| Q29_6 | 0.174 | 0.243 | 0.629 | 0.239 | 0.323 | 0.322 | 0.193 | 0.408 | 0.425 | 0.168 | 0.105 | 0.380 | 0.324 | 1.000 | 0.408 |
| Q29_7 | 0.173 | 0.593 | 0.671 | 0.351 | 0.438 | 0.520 | 0.627 | 0.572 | 0.367 | 0.134 | 0.001 | 0.498 | 0.336 | 0.408 | 1.000 |
| KMO and Bartlett's test | |||||||||||||||
| Kaiser–Meyer–Olkin measure of sampling adequacy | 0.874 | ||||||||||||||
| Bartlett's test of sphericity | Approx. chi-square | 3217.829 | |||||||||||||
| df | 105 | ||||||||||||||
| Sig. | 0.000 | ||||||||||||||
| Total variance explained | |||||||||||||||
| Component | Initial eigenvalues | Extraction sums of squared loadings | Rotation sums of squared loadings | ||||||||||||
| Total | % of Variance | Cumulative % | Total | % of Variance | Cumulative % | Total | % of Variance | Cumulative % | |||||||
| 1 | 5.772 | 38.480 | 38.480 | 5.772 | 38.480 | 38.480 | 3.989 | 26.596 | 26.596 | ||||||
| 2 | 1.805 | 12.032 | 50.512 | 1.805 | 12.032 | 50.512 | 2.805 | 18.702 | 45.297 | ||||||
| 3 | 1.237 | 8.245 | 58.757 | 1.237 | 8.245 | 58.757 | 1.836 | 12.243 | 57.540 | ||||||
| 4 | 1.010 | 6.732 | 65.490 | 1.010 | 6.732 | 65.490 | 1.192 | 7.949 | 65.490 | ||||||
| 5 | 0.825 | 5.500 | 70.990 | ||||||||||||
| 6 | 0.697 | 4.649 | 75.639 | ||||||||||||
| 7 | 0.685 | 4.567 | 80.206 | ||||||||||||
| 8 | 0.642 | 4.282 | 84.489 | ||||||||||||
| 9 | 0.526 | 3.508 | 87.997 | ||||||||||||
| 10 | 0.427 | 2.850 | 90.847 | ||||||||||||
| 11 | 0.401 | 2.671 | 93.518 | ||||||||||||
| 12 | 0.339 | 2.259 | 95.777 | ||||||||||||
| 13 | 0.268 | 1.785 | 97.562 | ||||||||||||
| 14 | 0.202 | 1.346 | 98.908 | ||||||||||||
| 15 | 0.164 | 1.092 | 100.000 | ||||||||||||
| Rotated component matrix: Varimax-rotated solution | |||||||||||||||
| Component | |||||||||||||||
| 1 | 2 | 3 | 4 | ||||||||||||
| Q26_1 | 0.771 | ||||||||||||||
| Q29_1 | 0.733 | ||||||||||||||
| Q26_6 | 0.717 | ||||||||||||||
| Q26_4 | 0.683 | ||||||||||||||
| Q29_6 | 0.672 | ||||||||||||||
| Q29_4 | 0.643 | ||||||||||||||
| Q26_3 | This item is disengaged | ||||||||||||||
| Q26_5 | 0.815 | ||||||||||||||
| Q21_2 | 0.810 | ||||||||||||||
| Q26_2 | 0.643 | ||||||||||||||
| Q29_7 | This item is disengaged | ||||||||||||||
| Q29_2 | 0.940 | ||||||||||||||
| Q21_1 | 0.930 | ||||||||||||||
| Q29_3 | 0.807 | ||||||||||||||
| Q29_5 | This item is disengaged | ||||||||||||||
| Reliability of rotated factors | |||||||||||||||
| Component | N of Items | Cronbach's alpha | |||||||||||||
| 1 | 6 | 0.850 | |||||||||||||
| 2 | 3 | 0.734 | |||||||||||||
PCA revealed the presence of 4 initial non-rotating factors to be extracted, with eigenvalues surpassing the Kaiser criterion of 1. These factors explain 26.596%, 18.702%, 12.243%, and 7.949% of variance, respectively, cumulatively accounting for 65.49% of variance. A Varimax rotation facilitated interpretation, demonstrating factor loadings greater than 0.6 for each of the 4 factors. However, items Q26_3, Q29_7, and Q29_5 exhibited factor loadings below 0.6 and were therefore excluded from the questionnaire. Additionally, components with fewer than 3 items were deemed unreliable and removed from the questionnaire, resulting in 2 factors. Items related to self-assessment of difficulties in understanding content and applying concepts loaded heavily on component 1, while items related to self-assessment of difficulties in synthesizing and evaluating loaded heavily on component 2.
The calculated Cronbach's alpha coefficients for the 2 rotated components are 0.850 and 0.734, respectively, indicating high reliabilities and confirming the internal consistency of each component.
The affective and support toolsThese tools comprise 14 items divided into 3 sub-categories: the work planning and time management tool, the self-confidence tool and the involvement or commitment to studies tool.
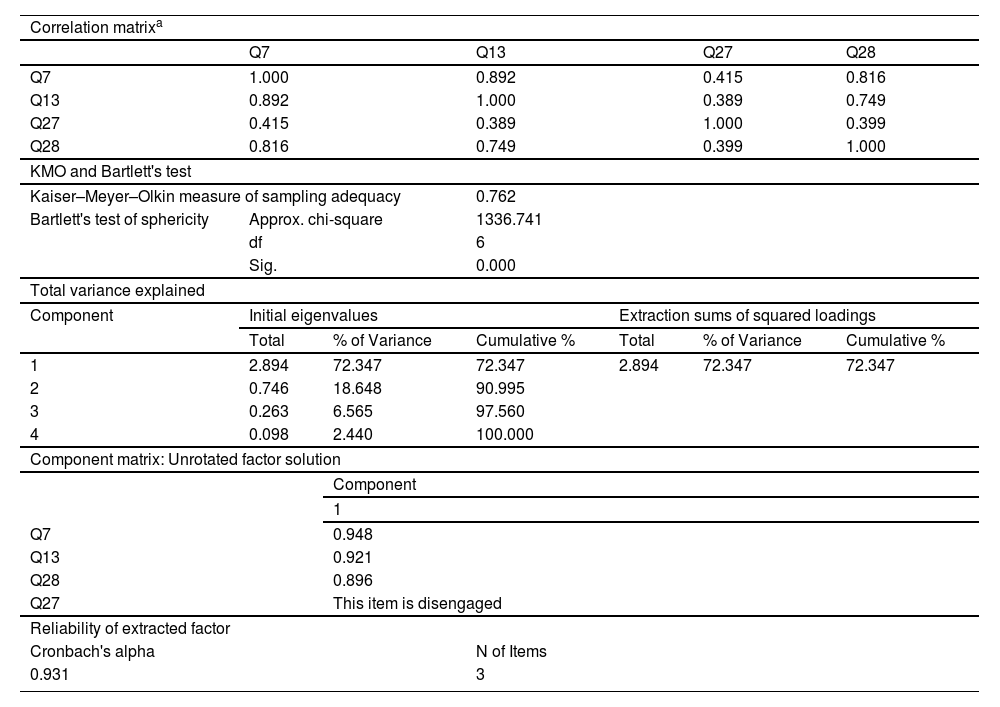
The work planning and time management toolThe findings presented in Table 5 indicate adequate correlations among the 4 items comprising the work planning and time management tool, all exceeding the threshold of 0.3. The determinant score of 0.055, significantly greater than 0.00001, suggests an absence of multicollinearity within the dataset. Moreover, the KMO index, evaluated at 0.762, is considered average. Bartlett's sphericity test yielded a statistically significant result (P=.000), further confirming the factorability of the data and justifying a factor analysis.
Summary of statistical analyses of work planning and time management tool.
| Correlation matrixa | ||||||
| Q7 | Q13 | Q27 | Q28 | |||
| Q7 | 1.000 | 0.892 | 0.415 | 0.816 | ||
| Q13 | 0.892 | 1.000 | 0.389 | 0.749 | ||
| Q27 | 0.415 | 0.389 | 1.000 | 0.399 | ||
| Q28 | 0.816 | 0.749 | 0.399 | 1.000 | ||
| KMO and Bartlett's test | ||||||
| Kaiser–Meyer–Olkin measure of sampling adequacy | 0.762 | |||||
| Bartlett's test of sphericity | Approx. chi-square | 1336.741 | ||||
| df | 6 | |||||
| Sig. | 0.000 | |||||
| Total variance explained | ||||||
| Component | Initial eigenvalues | Extraction sums of squared loadings | ||||
| Total | % of Variance | Cumulative % | Total | % of Variance | Cumulative % | |
| 1 | 2.894 | 72.347 | 72.347 | 2.894 | 72.347 | 72.347 |
| 2 | 0.746 | 18.648 | 90.995 | |||
| 3 | 0.263 | 6.565 | 97.560 | |||
| 4 | 0.098 | 2.440 | 100.000 | |||
| Component matrix: Unrotated factor solution | ||||||
| Component | ||||||
| 1 | ||||||
| Q7 | 0.948 | |||||
| Q13 | 0.921 | |||||
| Q28 | 0.896 | |||||
| Q27 | This item is disengaged | |||||
| Reliability of extracted factor | ||||||
| Cronbach's alpha | N of Items | |||||
| 0.931 | 3 | |||||
PCA revealed that only one initial non-rotating factor should be extracted, with an eigenvalue surpassing the Kaiser criterion of 1. This factor explains 72.347% of the total variance, which is significant. The component matrix reveals 3 elements whose factor loadings exceed the minimum threshold of 0.6. These items are strongly associated with a single factor and contribute to its definition. However, item Q27 exhibits a factor loading below 0.6 and is therefore excluded from the questionnaire.
The calculated Cronbach's alpha for the extracted component is 0.931, confirming high reliability and internal consistency of the construct.
The self-confidence toolThe results of the factor analysis applied of this tool indicate adequate correlations among the 3 items constituting the self-confidence tool, all surpassing the threshold of 0.3. The determinant score, calculated at 0.11, significantly exceeds 0.00001, suggesting an absence of multicollinearity within the dataset. The KMO index, evaluated at 0.708, is considered average, while Bartlett's sphericity test yielded a statistically significant result (P=.000), further confirming the factorability of the data and justifying a factor analysis.
PCA revealed the presence of a single initial non-rotating factor to be extracted, with an eigenvalue exceeding the Kaiser criterion of 1. This factor explains 84.599% of the total variance, which is well represented. The component matrix confirms that all 3 items have factor loadings surpassing the minimum threshold of 0.6 and are closely associated with a single factor, contributing to its definition.
The computed Cronbach's alpha for the extracted component is 0.931, indicating high reliability and internal consistency of the construct.
The involvement or engagement in studies toolThe outcomes presented in Table 6 demonstrate adequate correlations among the seven items constituting the study involvement tool, all surpassing the threshold of 0.3. The determinant score, calculated at 0.004, significantly exceeds 0.00001, suggesting an absence of multicollinearity within the dataset. The KMO index, evaluated at 0.793, is considered average, while Bartlett's sphericity test yielded a statistically significant result (P=.000), further confirming the factorability of the data and justifying a factor analysis.
Summary of statistical analyses of involvement or engagement in studies tool.
| Correlation matrixa | |||||||||
| Q4_1 | Q4_2 | Q12_2 | Q14 | Q16 | Q32 | Q34 | |||
| Q4_1 | 1.000 | 0.595 | 0.395 | 0.751 | 0.496 | 0.406 | 0.829 | ||
| Q4_2 | 0.595 | 1.000 | 0.423 | 0.809 | 0.605 | 0.552 | 0.687 | ||
| Q12_2 | 0.395 | 0.423 | 1.000 | 0.520 | 0.395 | 0.341 | 0.375 | ||
| Q14 | 0.751 | 0.809 | 0.520 | 1.000 | 0.751 | 0.670 | 0.689 | ||
| Q16 | 0.496 | 0.605 | 0.395 | 0.751 | 1.000 | 0.820 | 0.463 | ||
| Q32 | 0.406 | 0.552 | 0.341 | 0.670 | 0.820 | 1.000 | 0.402 | ||
| Q34 | 0.829 | 0.687 | 0.375 | 0.689 | 0.463 | 0.402 | 1.000 | ||
| KMO and Bartlett's test | |||||||||
| Kaiser–Meyer–Olkin measure of sampling adequacy | 0.793 | ||||||||
| Bartlett's test of sphericity | Approx. chi-square | 2591.115 | |||||||
| df | 21 | ||||||||
| Sig. | 0.000 | ||||||||
| Total variance explained | |||||||||
| Component | Initial eigenvalues | Extraction sums of squared loadings | |||||||
| Total | % of Variance | Cumulative % | Total | % of Variance | Cumulative % | ||||
| 1 | 4.482 | 64.029 | 64.029 | 4.482 | 64.029 | 64.029 | |||
| 2 | 0.950 | 13.572 | 77.601 | ||||||
| 3 | 0.719 | 10.266 | 87.868 | ||||||
| 4 | 0.383 | 5.470 | 93.338 | ||||||
| 5 | 0.217 | 3.102 | 96.440 | ||||||
| 6 | 0.161 | 2.298 | 98.739 | ||||||
| 7 | 0.088 | 1.261 | 100.000 | ||||||
| Component matrix: Unrotated factor solution | |||||||||
| Component | |||||||||
| 1 | |||||||||
| Q14 | 0.940 | ||||||||
| Q4_2 | 0.848 | ||||||||
| Q16 | 0.816 | ||||||||
| Q4_1 | 0.810 | ||||||||
| Q34 | 0.805 | ||||||||
| Q32 | 0.752 | ||||||||
| Q12_2 | This item is disengaged | ||||||||
| Reliability of extracted factor | |||||||||
| Cronbach's alpha | N of Items | ||||||||
| 0.911 | 6 | ||||||||
PCA revealed the presence of a single initial non-rotated factor to be extracted, with an eigenvalue exceeding Kaiser's criterion of 1, explaining 64.029% of the total variance, which is well represented. The component matrix reveals 6 items whose factor loadings surpass the minimum threshold of 0.6. These items are closely associated with a single factor and contribute to its definition. However, item Q12_2 has a factor loading below 0.6 and is therefore excluded from the questionnaire.
The computed Cronbach's alpha for the extracted component is 0.911, indicating high reliability and internal consistency of the construct.
DiscussionThis study represents the inaugural endeavor to validate an instrument for assessing learning strategies among nursing students in Morocco. The validation process encompassed 3 distinct phases: expert consultation, pre-testing, and a formal survey. The adapted version of the instrument includes 3 principal tool categories, subdivided into 8 sub-categories, with a total of 34 questions and 56 items. PCA was conducted on each item sub-category, revealing robust factorial validity and satisfactory internal consistency of the constructs, as indicated by Cronbach's alpha coefficients exceeding 0.7.
The final reduced model of the measurement instrument consists of 3 main categories of intellectual work tools with 30 questions and 42 items, providing a well-defined framework for evaluating learning-related behaviors and attitudes. It is noteworthy, however, that this classification diverges from that delineated and validated by Wolfs in his study. Wolfs grouped intellectual work tools into 4 learning dimensions: comprehension-appropriation, analysis-synthesis, feeling of low competence, and involvement-commitment.9
Nonetheless, several limitations warrant consideration. Firstly, the sample was confined to first-year undergraduate students, constraining the generalizability of the findings to the broader nursing student population. Secondly, the exploratory nature of the factor analysis underscores the necessity for future confirmatory factor analysis to bolster the conclusions presented in this study. Despite these limitations, this study is pioneering and establishes a foundation for employing the “Mes Outils de Travail Intellectuel” instrument within the specific context of foundational nursing education in Morocco.
ConclusionThis study marks a significant milestone as the inaugural effort to validate an instrument for assessing learning strategies among student nurses in Morocco. The “Mes Outils de Travail Intellectuel” questionnaire exhibited both validity and reliability as a self-report measure of learning strategies in this demographic. These findings furnish a solid foundation for its utilization within this specific context, furnishing researchers, educators, and educational administrators with valuable insights to enhance student learning quality and formulate targeted interventions.
To fortify the attained results, future confirmatory factor analysis is recommended. Moreover, further investigation is imperative to refine the learning strategies scale and evaluate its applicability across diverse cohorts of health science students in varying locales.
Ethical considerationsThe study was conducted in strict adherence to local ethical principles, involving obtaining appropriate authorization from ISPITS management and informed consent from all participating students. Rigorous data confidentiality protocols were implemented, ensuring anonymity throughout all data collection procedures. Participants were informed of their voluntary participation rights and retained the autonomy to withdraw from the study at any juncture. The four fundamental ethical principles of autonomy, beneficience, non-maleficence, and justice were scrupulously respected. The collected data were exclusively utilized for investigative purposes, with meticulous care taken to preserve the anonymity of the individuals prior to obtaining free and informed consent.
The authors would like to express their warm gratitude to José-Luis Wolfs, Professor in Educational Sciences at the Université Libre de Bruxelles, for his collaboration and for granting permission to use his own measuring instrument.


